Downloaded 475 times

![Follow-on Discussion Happy to chat with anyone (get with me either today or contact me via email) Email [email_address] LinkedIn http://www.linkedin.com/in/jjansen Twitter jimjansen](https://image.slidesharecdn.com/webanalyticswebinar-111019191654-phpapp02/85/Web-analytics-presentation-45-320.jpg)

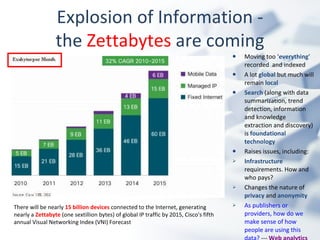
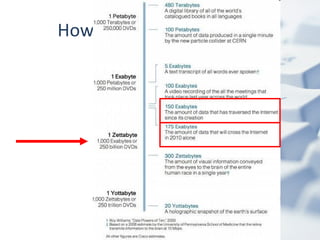
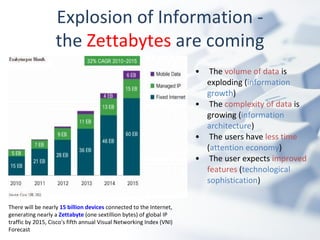
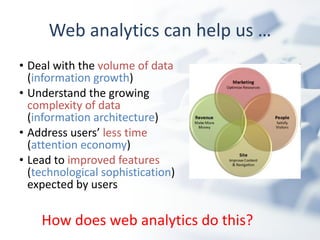
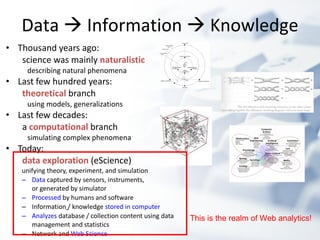
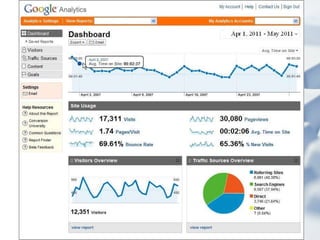
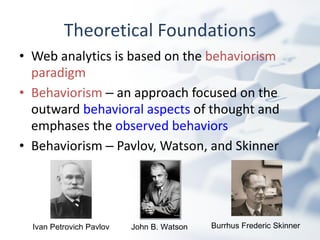
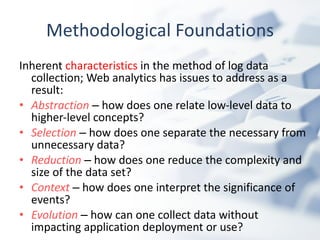
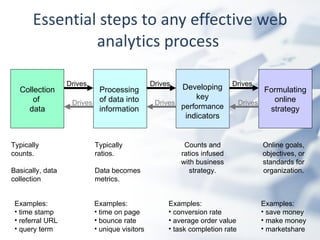
The document provides background information on Jim Jansen, an associate professor who researches web analytics. It discusses the growth of data on the internet and how web analytics can help address issues around analyzing large volumes of complex data. Specifically, it summarizes that web analytics uses a behavioral and empirical approach to collect, analyze and report on internet data through the measurement of user behaviors online in order to optimize web usage.


