>: Data isa set of values of qualitative or
quantitative variables. It is information in raw or
unorganized form. It may be a fact, f igure,
characters, symbols etc. Data can be numbers, like
the record of daily weather, or daily sales. Data can
be alphanumeric, such as the names of employees
and customers.
>- Meaningful or organized data is information,
comes from analyzing data.
3.
A database isa modeled collection of data
that is accessible in many ways. A data model can be
designed to integrate the operational data of the
organization. The data model abstracts the key entities
involved in an action and their relationships. Most
databases today follow the relational data model and its
variants.
Take the example of a sales organization. A
data model for managing customer orders will involve
data about customers, orders, products, and their
interrelationships. The relationship between the
customers and orders would be such that one customer
can place many orders, but one order will be placed by
one and only one customer. It is called a one-to-many
relationship. The relationship between orders and
4.
A data warehouseis an organized store of data
from all over the organization, specially designed
to help make management decisions.
Data can be extracted from operational database
to answer a particular set of queries. This data,
combined with other data, can be rolled up to a
consistent granularity and uploaded to a separate
data store called the data warehouse. Therefore,
the data warehouse is a simpler version of the
operational data base, with the purpose of
addressing reporting and decision-making needs
only.
Data Mining is the art and science of discovering
useful innovative patterns from data. There is a
wide variety of patterns that can be found in the
data.
5.
Organizations today handleand store billions of
rows of data, possibly with millions of
combinations. Data Analytics has been hailed as
the ‘Game Changer’, because businesses could
transform the raw data into something
actionable, which improved their profits. One of
the first applications of analytics were found in
the field of marketing, sales and customer
relationship management.
Once the firms had analyzed the data, they
found plethora of information ranging from
insights into the customer’s needs to consumer
behavior to understanding the demand for
products/ services.
6.
The first erais also known as the era of ‘Business
Intelligence’. Analytics 1.0 was a time of real
progress in gaining an objective, deep
understanding of important business phenomena
and giving managers the fact-based comprehension
to go beyond intuition when making decisions.
For the first time, data about production processes,
sales, customer interactions, and more were
recorded, aggregated, and analyzed. Data sets were
small enough in volume and static enough in
velocity to be segregated in warehouses for
analysis.
However, readying a data set for inclusion in a
warehouse was difficult. Analysts spent much of
their time preparing data for analysis.
7.
Also known asthe era of ‘Big
Data’.
The analytics 1.0 era lasted until the mid- 2000’s
and as analytics entered the 2.0 phase, the need
for powerful new tools and the opportunity to
profit by providing them quickly became apparent.
Companies rushed to build new capabilities and
acquire new customers.
LinkedIn, created numerous data
products, including People You May Know, Jobs You
May Be Interested In, Groups You May Like,
Companies You May Want to Follow, Network
Updates, and Skills and Expertise and to do so, it
built a strong infrastructure and hired smart,
8.
Innovative technologies ofmany kinds had to be
created, acquired, and mastered in this era.
Big data could not fit or be analyzed fast enough on
a single server, so it was processed with Hadoop, an
open source software framework for fast batch data
processing across parallel servers.
To deal with relatively unstructured data, companies
turned to a new class of databases known as NoSQL.
Much information was stored and analyzed in public or
private cloud-computing environments.
Machine-learning methods (semi-automated
model development and testing) were used to
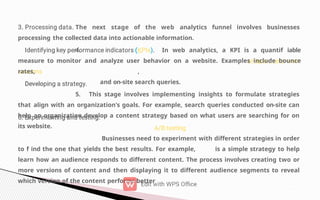
rapidly generate models from the fast-moving
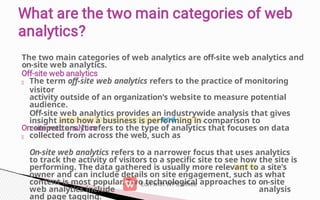
data.
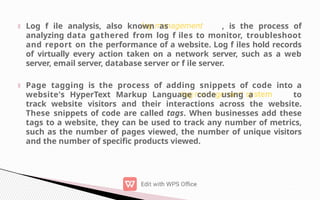
The competencies/ skills thus required for Analytics
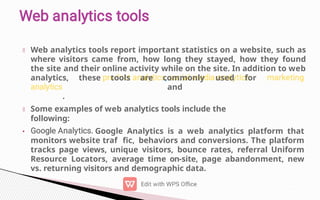
2.0 were quite different from those needed for 1.0.
The next-generation quantitative analysts were
called data scientists, and they possessed both
computational and analytical skills.
9.
Like the firsttwo eras of analytics, this one
brings new challenges and opportunities, both
for the companies that want to compete on
analytics and for the vendors that supply the
data and tools with which to do so.
High-performing companies will embed analytics
directly into decision and operational processes,
and take advantage of machine-learning and other
technologies to generate insights in the millions
per second rather than an “insight a week or
month.”
Data architectures (i.e., Hadoop) will augment the
traditional approaches removing scale barriers.
Analytics truly becomes the competitive
differentiator for enterprises who capitalize on the
possibilities of this new era (International institute
for analytics, 2015).
11.
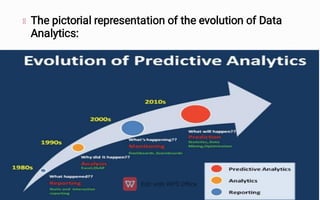
The pictorial representationof the evolution of Data
Analytics shows that the concept of Data Analytics
started in the early 1980s.
In 1980’s the Data Analytics is used in such a way
that only reporting is used to happen.
That means what is happening with the data being
obtained. After this type of Data Analytic modeling,
the Data Analytic is being moved into the second
phase that is with early 1990’s more of Analysis
(Analytics) came into existence.
In this period, it focuses on “why did it happen” to the
data. Then in 2000 onwards, the Monitoring of data
happens. The dashboards and the scoreboards are
being used for the same. With this type of analysis, a
clear idea of what’s happening to the data is being
understood.
12.
Then after 2010onwards, the Prediction with
the data and the data inputs being
implemented with.
That means, what will happen with the data is
the main question being asked in the period
after 2010. The different methods of statistics,
data mining and the optimization is being
used in this period.
Now we are in the era with the more
detailed data analytics and that is of nature
Prescriptive.
In this period we are training our machines to
be smarter and focusing on the computations
to happen with less time and less efforts.
So we can conclude that we are in the
13.
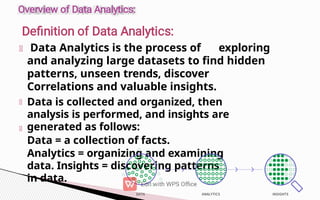
Data Analytics isthe process of exploring
and analyzing large datasets to find hidden
patterns, unseen trends, discover
Correlations and valuable insights.
Data is collected and organized, then
analysis is performed, and insights are
generated as follows:
Data = a collection of facts.
Analytics = organizing and examining
data. Insights = discovering patterns
in data.
14.
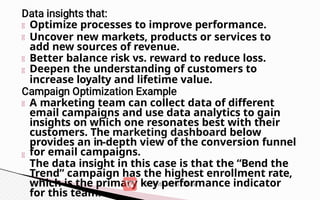
Optimize processes toimprove performance.
Uncover new markets, products or services to
add new sources of revenue.
Better balance risk vs. reward to reduce loss.
Deepen the understanding of customers to
increase loyalty and lifetime value.
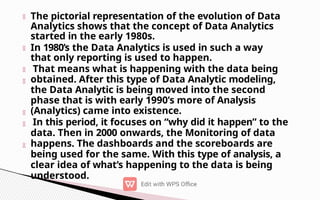
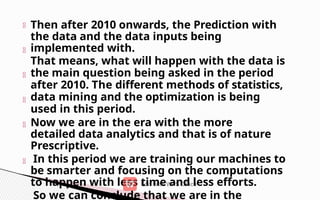
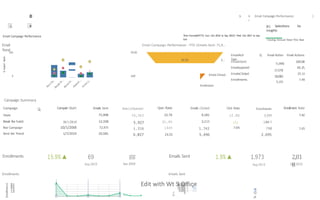
A marketing team can collect data of different
email campaigns and use data analytics to gain
insights on which one resonates best with their
customers. The marketing dashboard below
provides an in-depth view of the conversion funnel
for email campaigns.
The data insight in this case is that the “Bend the
Trend” campaign has the highest enrollment rate,
which is the primary key performance indicator
for this team.
17.
E
maisl
Sent
Enrollmenst
Email Campaign Performance
Email
Trend
CampaignSummary
Campaign Campain Start Emails Sent EmaiIs0pened Open Rate Emails Clicked Click Rate Enrolments Enrollment Rate
Totals 71,998 16,3&3 22.7¥ 9,181 12.6X 5,355 7.4Z
Break the habit lB/1/2818 12,338 5,927 31.8% 2,115 1,B4 5
Nor Campaign 10/1/20t8 72,97t i,316 l4S% 1,742 7.6% 790
Bend the Trend 1/7/2019 20,585 6,027 S,496 2,695
Enrollments
Enrollments
2
2
1.0
b 6 Email Campaign Performance
I
}
jy-j Selections Ila
insights
I loving Annual Total This Year
Tlme Frame(ldATTY): Corr: Oct 2818 to Sep 2B19| Pre¥: Oct 2B17 to 6ep
tels
Email Campaign Performance - YTD |Emails Sent: 71,9...
8.8/
gg
Sep 2919
Emails Sent
Emails Sent
Edit with Wt
E
EmailActi
Type
Q Email Action
7},990
J7,S78
18,082
5,J55
Email Actions
EmailsSent
Emailsopered
100.08
45.3
25.1t
7.48
ErnaiIsC!icked
Enrollments
2,81
8
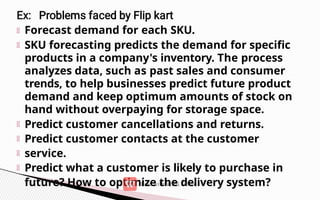
Forecast demand foreach SKU.
SKU forecasting predicts the demand for specific
products in a company's inventory. The process
analyzes data, such as past sales and consumer
trends, to help businesses predict future product
demand and keep optimum amounts of stock on
hand without overpaying for storage space.
Predict customer cancellations and returns.
Predict customer contacts at the customer
service.
Predict what a customer is likely to purchase in
future? How to optimize the delivery system?
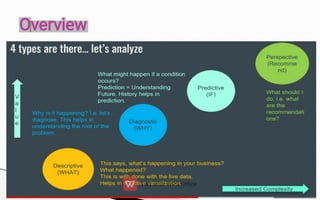
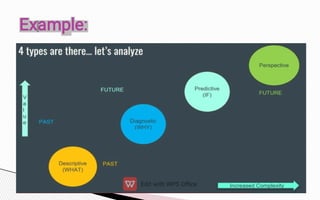
21.
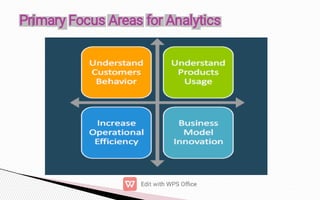
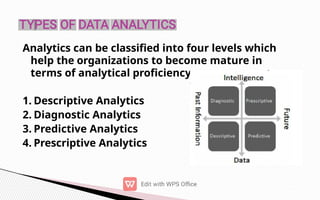
Analytics can beclassified into four levels which
help the organizations to become mature in
terms of analytical proficiency.
1. Descriptive Analytics
2. Diagnostic Analytics
3. Predictive Analytics
4. Prescriptive Analytics
22.
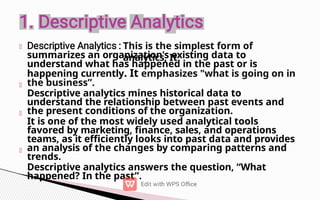
This is thesimplest form of
analytics, It
summarizes an organization's existing data to
understand what has happened in the past or is
happening currently. It emphasizes "what is going on in
the business”.
Descriptive analytics mines historical data to
understand the relationship between past events and
the present conditions of the organization.
It is one of the most widely used analytical tools
favored by marketing, finance, sales, and operations
teams, as it efficiently looks into past data and provides
an analysis of the changes by comparing patterns and
trends.
Descriptive analytics answers the question, “What
happened? In the past”.
23.
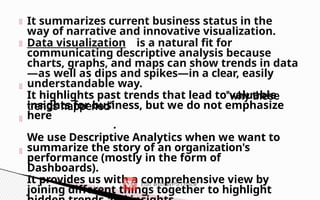
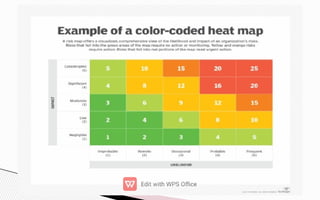
It summarizes currentbusiness status in the
way of narrative and innovative visualization.
Data visualization is a natural fit for
communicating descriptive analysis because
charts, graphs, and maps can show trends in data
—as well as dips and spikes—in a clear, easily
understandable way.
It highlights past trends that lead to valuable
insights for business, but we do not emphasize
here
.
We use Descriptive Analytics when we want to
summarize the story of an organization's
performance (mostly in the form of
Dashboards).
It provides us with a comprehensive view by
joining different things together to highlight
25.
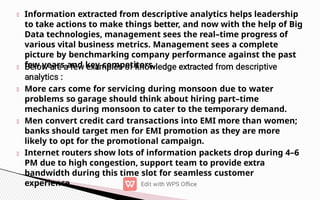
Information extracted fromdescriptive analytics helps leadership
to take actions to make things better, and now with the help of Big
Data technologies, management sees the real–time progress of
various vital business metrics. Management sees a complete
picture by benchmarking company performance against the past
few years and key competitors.
More cars come for servicing during monsoon due to water
problems so garage should think about hiring part–time
mechanics during monsoon to cater to the temporary demand.
Men convert credit card transactions into EMI more than women;
banks should target men for EMI promotion as they are more
likely to opt for the promotional campaign.
Internet routers show lots of information packets drop during 4–6
PM due to high congestion, support team to provide extra
bandwidth during this time slot for seamless customer
experience.
26.
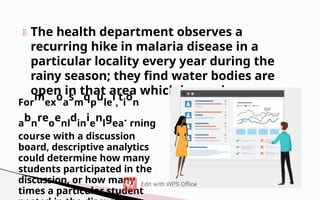
The health departmentobserves a
recurring hike in malaria disease in a
particular locality every year during the
rainy season; they find water bodies are
open in that area which is causing
For
mex
oa
sm
qp
ule
i,
ti
on
a
bn
reo
enl
din
ie
nl
gea
. rning
course with a discussion
board, descriptive analytics
could determine how many
students participated in the
discussion, or how many
times a particular student
27.
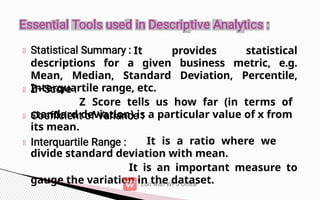
It provides statistical
descriptionsfor a given business metric, e.g.
Mean, Median, Standard Deviation, Percentile,
Interquartile range, etc.
Z Score tells us how far (in terms of
standard deviation) is a particular value of x from
its mean.
It is a ratio where we
divide standard deviation with mean.
It is an important measure to
gauge the variation in the dataset.
28.
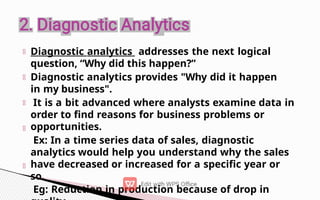
Diagnostic analytics addressesthe next logical
question, “Why did this happen?”
Diagnostic analytics provides "Why did it happen
in my business".
It is a bit advanced where analysts examine data in
order to find reasons for business problems or
opportunities.
Ex: In a time series data of sales, diagnostic
analytics would help you understand why the sales
have decreased or increased for a specific year or
so.
Eg: Reduction in production because of drop in
30.
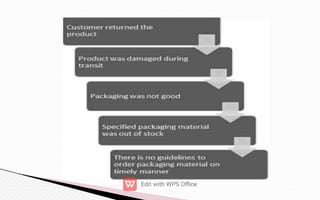
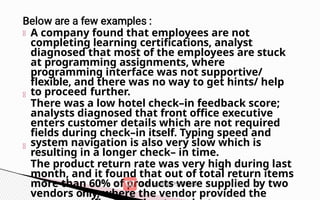
A company foundthat employees are not
completing learning certifications, analyst
diagnosed that most of the employees are stuck
at programming assignments, where
programming interface was not supportive/
flexible, and there was no way to get hints/ help
to proceed further.
There was a low hotel check–in feedback score;
analysts diagnosed that front office executive
enters customer details which are not required
fields during check–in itself. Typing speed and
system navigation is also very slow which is
resulting in a longer check– in time.
The product return rate was very high during last
month, and it found that out of total return items
more than 60% of products were supplied by two
vendors only, where the vendor provided the
31.
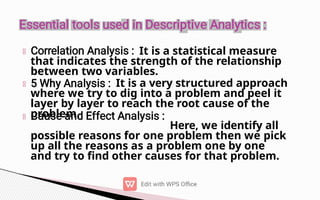
It is astatistical measure
that indicates the strength of the relationship
between two variables.
It is a very structured approach
where we try to dig into a problem and peel it
layer by layer to reach the root cause of the
problem.
Here, we identify all
possible reasons for one problem then we pick
up all the reasons as a problem one by one
and try to find other causes for that problem.
32.
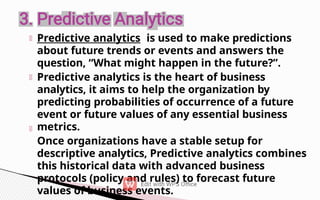
Predictive analytics isused to make predictions
about future trends or events and answers the
question, “What might happen in the future?”.
Predictive analytics is the heart of business
analytics, it aims to help the organization by
predicting probabilities of occurrence of a future
event or future values of any essential business
metrics.
Once organizations have a stable setup for
descriptive analytics, Predictive analytics combines
this historical data with advanced business
protocols (policy and rules) to forecast future
values of business events.
33.
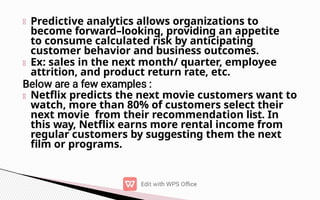
Predictive analytics allowsorganizations to
become forward–looking, providing an appetite
to consume calculated risk by anticipating
customer behavior and business outcomes.
Ex: sales in the next month/ quarter, employee
attrition, and product return rate, etc.
Netflix predicts the next movie customers want to
watch, more than 80% of customers select their
next movie from their recommendation list. In
this way, Netflix earns more rental income from
regular customers by suggesting them the next
film or programs.
34.
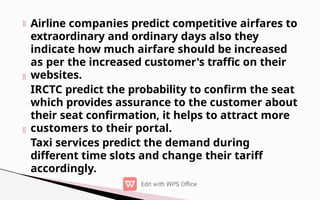
Airline companies predictcompetitive airfares to
extraordinary and ordinary days also they
indicate how much airfare should be increased
as per the increased customer's traffic on their
websites.
IRCTC predict the probability to confirm the seat
which provides assurance to the customer about
their seat confirmation, it helps to attract more
customers to their portal.
Taxi services predict the demand during
different time slots and change their tariff
accordingly.
35.
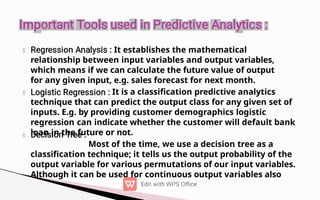
It establishes themathematical
relationship between input variables and output variables,
which means if we can calculate the future value of output
for any given input, e.g. sales forecast for next month.
It is a classification predictive analytics
technique that can predict the output class for any given set of
inputs. E.g. by providing customer demographics logistic
regression can indicate whether the customer will default bank
loan in the future or not.
Most of the time, we use a decision tree as a
classification technique; it tells us the output probability of the
output variable for various permutations of our input variables.
Although it can be used for continuous output variables also
36.
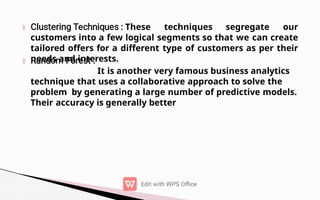
These techniques segregateour
customers into a few logical segments so that we can create
tailored offers for a different type of customers as per their
needs and interests.
It is another very famous business analytics
technique that uses a collaborative approach to solve the
problem by generating a large number of predictive models.
Their accuracy is generally better
37.
Finally, prescriptive analyticsanswers the
question, “What should we do next?”
Prescriptive analytics solves the complex business
problem as it is the most advanced form of analytics,
where we have to choose the most optimal way to
increase important business metrics.
perspective analytics can be applied once we have
sound business knowledge from descriptive and
predictive analytics.
Descriptive and predictive analytics suggest to us
various ways to
improve business performance while prescriptive
analytics tells
us the pros and cons of all alternatives and try to
provide the optimal outputs by keeping minimum risk
in execution.
Prescriptive analytics is not limited to predict "what
will happen"
38.
In 2019, therewas a prediction of the cyclone
on coastal areas of Gujarat (by predicting
changing airspeed, varying wind direction, and
mathematical relationship between low
pressure in the ocean with changes in cyclone
intensity) therefore Government and disaster
management team had taken proactive actions
in shifting citizens from coastal areas to save
places, and they stopped fishermen from going
to sea and arrange comfortable camps. While in
a similar situation in 1999 we lost approx.
10,000 lives due to cyclone.
Banks use prescriptive analytics to identify
investment options for their customers to
maximize their returns and minimize risk. They
balance customer's portfolio by having an
optimized ratio of equity, debt, and other types
39.
At the timeof launching a new service or a product
into the market, organizations have to keep various
factors into the mind like the cost of the product,
features of the product, geographies in which they
will launch first, customer segments whom they
want to attract, marketing channels for product
promotion, etc. By getting analytical results from
descriptive and predictive analytics, analysts apply
prescriptive analytics to decide the right mix of all
these factors to make a product launch successful.
In agriculture crop yield depends on various factors
like rainfall, soil type, demand in the market, etc.
Analysts apply prescriptive analytics and suggest the
best kind of crop in different regions as per the
40.
In linear programming,we
optimize the objective functions like revenue, market
share, customer feedback ratings by also keeping
constraints in the model like budget, no. of people
deployed, etc. as linear functions.
We apply these techniques
in scenarios where we have to identify the best
solution among various available options, and there is
the list of criteria's to select the solution, e.g. select
best cloud service providers among top 5
organizations by keeping multiple factors into
consideration like budget, customer service, flexibility
to upgrade, backup services, maintenance cost, etc.
It involves identifying
optimal solutions from a considerable number of finite
solutions, e.g. the travelling salesman problem, vehicle
routing problem, etc.
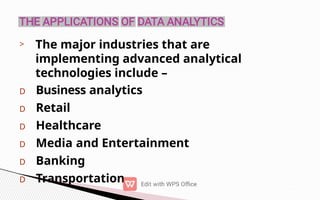
44.
> The majorindustries that are
implementing advanced analytical
technologies include –
D Business analytics
D Retail
D Healthcare
D Media and Entertainment
D Banking
D Transportation
45.
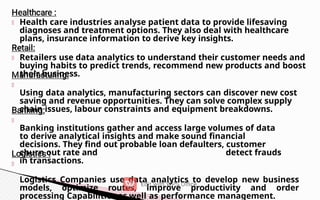
Health care industriesanalyse patient data to provide lifesaving
diagnoses and treatment options. They also deal with healthcare
plans, insurance information to derive key insights.
Retailers use data analytics to understand their customer needs and
buying habits to predict trends, recommend new products and boost
their business.
Using data analytics, manufacturing sectors can discover new cost
saving and revenue opportunities. They can solve complex supply
chain issues, labour constraints and equipment breakdowns.
Banking institutions gather and access large volumes of data
to derive analytical insights and make sound financial
decisions. They find out probable loan defaulters, customer
churn out rate and detect frauds
in transactions.
Logistics Companies use data analytics to develop new business
models, optimize routes, improve productivity and order
processing Capabilities as well as performance management.
46.
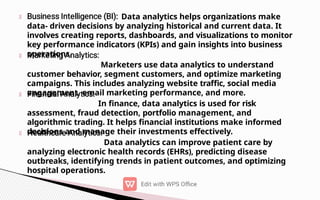
Data analytics helpsorganizations make
data- driven decisions by analyzing historical and current data. It
involves creating reports, dashboards, and visualizations to monitor
key performance indicators (KPIs) and gain insights into business
operations.
Marketers use data analytics to understand
customer behavior, segment customers, and optimize marketing
campaigns. This includes analyzing website traffic, social media
engagement, email marketing performance, and more.
In finance, data analytics is used for risk
assessment, fraud detection, portfolio management, and
algorithmic trading. It helps financial institutions make informed
decisions and manage their investments effectively.
Data analytics can improve patient care by
analyzing electronic health records (EHRs), predicting disease
outbreaks, identifying trends in patient outcomes, and optimizing
hospital operations.
47.
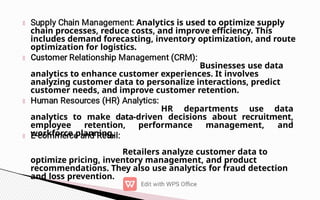
Analytics is usedto optimize supply
chain processes, reduce costs, and improve efficiency. This
includes demand forecasting, inventory optimization, and route
optimization for logistics.
Businesses use data
analytics to enhance customer experiences. It involves
analyzing customer data to personalize interactions, predict
customer needs, and improve customer retention.
HR departments use data
analytics to make data-driven decisions about recruitment,
employee retention, performance management, and
workforce planning.
Retailers analyze customer data to
optimize pricing, inventory management, and product
recommendations. They also use analytics for fraud detection
and loss prevention.
48.
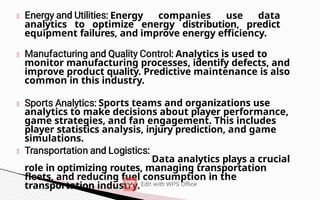
Energy companies usedata
analytics to optimize energy distribution, predict
equipment failures, and improve energy efficiency.
Analytics is used to
monitor manufacturing processes, identify defects, and
improve product quality. Predictive maintenance is also
common in this industry.
Sports teams and organizations use
analytics to make decisions about player performance,
game strategies, and fan engagement. This includes
player statistics analysis, injury prediction, and game
simulations.
Data analytics plays a crucial
role in optimizing routes, managing transportation
fleets, and reducing fuel consumption in the
transportation industry.
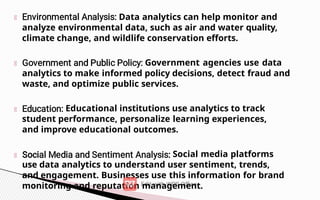
49.
Data analytics canhelp monitor and
analyze environmental data, such as air and water quality,
climate change, and wildlife conservation efforts.
Government agencies use data
analytics to make informed policy decisions, detect fraud and
waste, and optimize public services.
Educational institutions use analytics to track
student performance, personalize learning experiences,
and improve educational outcomes.
Social media platforms
use data analytics to understand user sentiment, trends,
and engagement. Businesses use this information for brand
monitoring and reputation management.
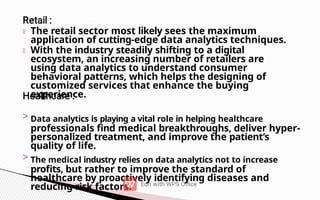
50.
The retail sectormost likely sees the maximum
application of cutting-edge data analytics techniques.
With the industry steadily shifting to a digital
ecosystem, an increasing number of retailers are
using data analytics to understand consumer
behavioral patterns, which helps the designing of
customized services that enhance the buying
experience.
> Data analytics is playing a vital role in helping healthcare
professionals find medical breakthroughs, deliver hyper-
personalized treatment, and improve the patient’s
quality of life.
> The medical industry relies on data analytics not to increase
profits, but rather to improve the standard of
healthcare by proactively identifying diseases and
reducing risk factors.
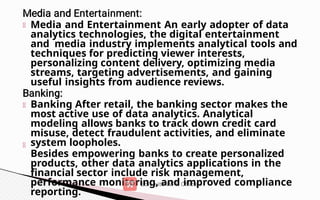
51.
Media and EntertainmentAn early adopter of data
analytics technologies, the digital entertainment
and media industry implements analytical tools and
techniques for predicting viewer interests,
personalizing content delivery, optimizing media
streams, targeting advertisements, and gaining
useful insights from audience reviews.
Banking After retail, the banking sector makes the
most active use of data analytics. Analytical
modeling allows banks to track down credit card
misuse, detect fraudulent activities, and eliminate
system loopholes.
Besides empowering banks to create personalized
products, other data analytics applications in the
financial sector include risk management,
performance monitoring, and improved compliance
reporting.
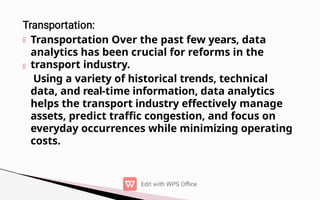
52.
Transportation Over thepast few years, data
analytics has been crucial for reforms in the
transport industry.
Using a variety of historical trends, technical
data, and real-time information, data analytics
helps the transport industry effectively manage
assets, predict traffic congestion, and focus on
everyday occurrences while minimizing operating
costs.
53.
understand the businessproblem. Define the
organizational goals and plan for a lucrative
solution.
Gather the right data from various sources
and other information based on your priorities.
Data analytics begins with the collection of data
from various sources, including databases,
websites, sensors, and more. Data can be
structured (e.g., databases, spreadsheets) or
unstructured (e.g., text, images, social media
54.
Clean the datato remove unwanted,
redundant and missing values and make it
ready for analysis.
use data visualization and business intelligence
tools, data mining techniques and predictive
modeling to analyses data.
Interpret the results to find out hidden
patterns, future trends, and gain insights.
55.
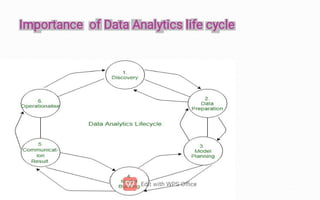
Data analytics lifecycle defines the roadmap of how the
data is generated, collected, processed, used, and
analyzed to achieve business goals.
It offers a systematic way to manage data for
converting it into information that can be used to fulfill
organization and project goals.
The process provides the direction and methods to
extract information from the data and proceed in the
right direction to accomplish business goals.
Based on the newly received insights, they can decide
whether to proceed with their existing Research or scrap
it and redo the Complete analysis.
The data Analytics life cycle guides them throughout this
process.
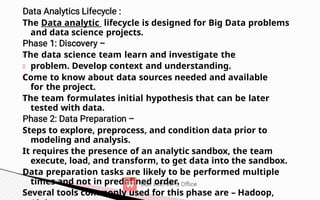
57.
The Data analyticlifecycle is designed for Big Data problems
and data science projects.
The data science team learn and investigate the
problem. Develop context and understanding.
Come to know about data sources needed and available
for the project.
The team formulates initial hypothesis that can be later
tested with data.
Steps to explore, preprocess, and condition data prior to
modeling and analysis.
It requires the presence of an analytic sandbox, the team
execute, load, and transform, to get data into the sandbox.
Data preparation tasks are likely to be performed multiple
times and not in predefined order.
Several tools commonly used for this phase are – Hadoop,
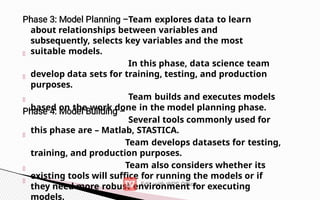
58.
Team explores datato learn
about relationships between variables and
subsequently, selects key variables and the most
suitable models.
In this phase, data science team
develop data sets for training, testing, and production
purposes.
Team builds and executes models
based on the work done in the model planning phase.
Several tools commonly used for
this phase are – Matlab, STASTICA.
Team develops datasets for testing,
training, and production purposes.
Team also considers whether its
existing tools will suffice for running the models or if
they need more robust environment for executing
models.
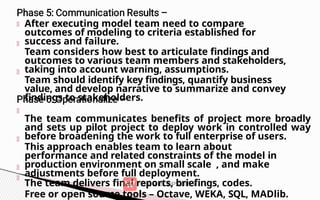
59.
After executing modelteam need to compare
outcomes of modeling to criteria established for
success and failure.
Team considers how best to articulate findings and
outcomes to various team members and stakeholders,
taking into account warning, assumptions.
Team should identify key findings, quantify business
value, and develop narrative to summarize and convey
findings to stakeholders.
The team communicates benefits of project more broadly
and sets up pilot project to deploy work in controlled way
before broadening the work to full enterprise of users.
This approach enables team to learn about
performance and related constraints of the model in
production environment on small scale , and make
adjustments before full deployment.
The team delivers final reports, briefings, codes.
Free or open source tools – Octave, WEKA, SQL, MADlib.
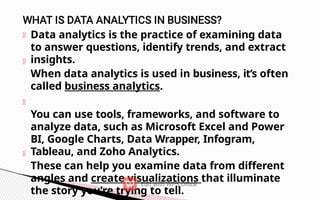
60.
Data analytics isthe practice of examining data
to answer questions, identify trends, and extract
insights.
When data analytics is used in business, it’s often
called business analytics.
You can use tools, frameworks, and software to
analyze data, such as Microsoft Excel and Power
BI, Google Charts, Data Wrapper, Infogram,
Tableau, and Zoho Analytics.
These can help you examine data from different
angles and create visualizations that illuminate
the story you’re trying to tell.
61.
Any business professionalwho makes decisions
needs foundational data analytics knowledge.
who utilize customer data, industry
trends, and performance data from past campaigns
to plan marketing strategies
, who analyze market, industry, and
user data to improve their companies’ products
, who use historical performance
data and industry trends to forecast their companies’
financial trajectories
who gain insights into employees’
opinions, motivations, and behaviors and pair it with
industry trend data to make meaningful changes
within their organizations.
62.
Data is anunorganized and raw collection of
facts that has massive importance for a
company.
In the modern world, every company wants to
collect and analyze data to know their past
mistakes.
It might help them to build a better future.
Sometimes these companies find it
challenging to use analytics tools.
The demand for data analysts and their
related roles comes into the picture. You
might understand that industries require data
analytics skills.
63.
Data Analytics alwayshelps companies to get an insight
into how to develop the business.
There are several types of tools you will require to interpret
the data. Companies use data analytics tools to understand
customer behavior and increase productivity.
It might help them to store information about the latest
trends in the market.
The company uses tools related to business intelligence
and data management to identify the changing functions.
The main three things will give good insight, immediate
action, and information system. A good insight will help
you to understand the business context.
The information will help to access the organization’s
storage and information system.
You will be able to take immediate action based on
valuable information.
The companies are trends to focus on experiments with
analytical languages and tools to develop new ideas.
64.
When big datajoins forces with artificial
intelligence, machine learning, and data
mining, companies are better equipped to
make accurate predictions.
For example, predictive analytics can suggest
what could happen in response to changes to
the business, and prescriptive analytics can
indicate how the company should react to
these changes.
Additionally, enterprises can use data analytics
tools to determine the success of changes and
visualize the results, so decision-makers know
whether to roll the changes out across the
business.
65.
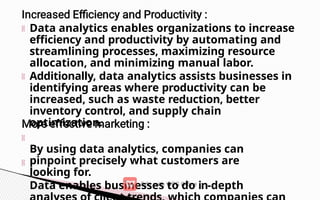
Data analytics enablesorganizations to increase
efficiency and productivity by automating and
streamlining processes, maximizing resource
allocation, and minimizing manual labor.
Additionally, data analytics assists businesses in
identifying areas where productivity can be
increased, such as waste reduction, better
inventory control, and supply chain
optimization.
By using data analytics, companies can
pinpoint precisely what customers are
looking for.
Data enables businesses to do in-depth
66.
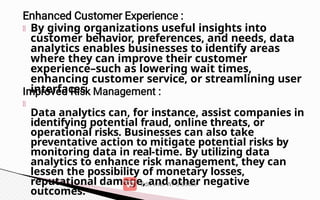
By giving organizationsuseful insights into
customer behavior, preferences, and needs, data
analytics enables businesses to identify areas
where they can improve their customer
experience–such as lowering wait times,
enhancing customer service, or streamlining user
interfaces.
Data analytics can, for instance, assist companies in
identifying potential fraud, online threats, or
operational risks. Businesses can also take
preventative action to mitigate potential risks by
monitoring data in real-time. By utilizing data
analytics to enhance risk management, they can
lessen the possibility of monetary losses,
reputational damage, and other negative
outcomes.
67.
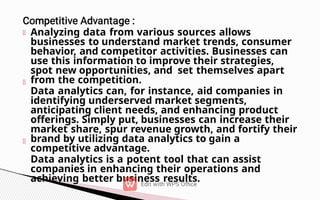
Analyzing data fromvarious sources allows
businesses to understand market trends, consumer
behavior, and competitor activities. Businesses can
use this information to improve their strategies,
spot new opportunities, and set themselves apart
from the competition.
Data analytics can, for instance, aid companies in
identifying underserved market segments,
anticipating client needs, and enhancing product
offerings. Simply put, businesses can increase their
market share, spur revenue growth, and fortify their
brand by utilizing data analytics to gain a
competitive advantage.
Data analytics is a potent tool that can assist
companies in enhancing their operations and
achieving better business results.
68.
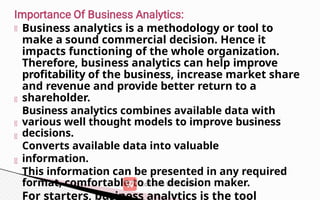
Business analytics isa methodology or tool to
make a sound commercial decision. Hence it
impacts functioning of the whole organization.
Therefore, business analytics can help improve
profitability of the business, increase market share
and revenue and provide better return to a
shareholder.
Business analytics combines available data with
various well thought models to improve business
decisions.
Converts available data into valuable
information.
This information can be presented in any required
format, comfortable to the decision maker.
For starters, business analytics is the tool
69.
Improves performance bygiving your business
a clear picture of what is and isn’t working.
Provides faster and more accurate decisions .
Minimizes risks as it helps a business make the
right choices regarding consumer behaviour,
trends, and performance.
Inspires change and innovation by answering
questions about the consumer.
70.
Apart from havingapplications in various arenas,
following are the benefits of Business Analytics and its
impact on business – Accurately transferring
information
Consequent improvement in
efficiency Help portray Future
Challenges
Make Strategic decisions
As a perfect blend of data science and
analytics Reduction in Costs
Improved Decisions
Share information with a larger audience
Ease in Sharing information with
stakeholders
71.
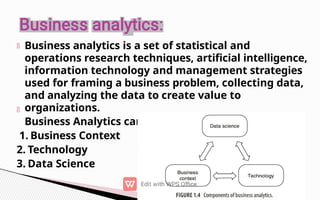
Business analytics isa set of statistical and
operations research techniques, artificial intelligence,
information technology and management strategies
used for framing a business problem, collecting data,
and analyzing the data to create value to
organizations.
Business Analytics can be broken into 3 components:
1. Business Context
2. Technology
3. Data Science
72.
Business analytics projectsstart with the business
context and ability of the organization to ask the
right questions.
Another good example of business context driving
analytics is the ‘did you forget feature’ used by the
Indian online grocery store bigbasket.com
(Abraham et al., 2016). Many customers have the
tendency to forget items they intended to buy. The
customers may buy the forgotten items from a
nearby store where they live, resulting in reduction
in basket size in the future for online grocery stores
such as bigbasket.com.
Alternatively, the customer may place another
order for forgotten items, but this time, the size of
the basket is likely to be small and results in
unnecessary logistics cost. Thus, the ability to
73.
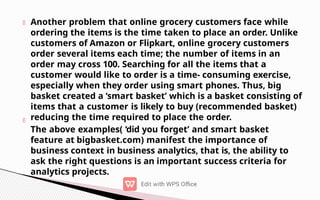
Another problem thatonline grocery customers face while
ordering the items is the time taken to place an order. Unlike
customers of Amazon or Flipkart, online grocery customers
order several items each time; the number of items in an
order may cross 100. Searching for all the items that a
customer would like to order is a time- consuming exercise,
especially when they order using smart phones. Thus, big
basket created a ‘smart basket’ which is a basket consisting of
items that a customer is likely to buy (recommended basket)
reducing the time required to place the order.
The above examples( ‘did you forget’ and smart basket
feature at bigbasket.com) manifest the importance of
business context in business analytics, that is, the ability to
ask the right questions is an important success criteria for
analytics projects.
74.
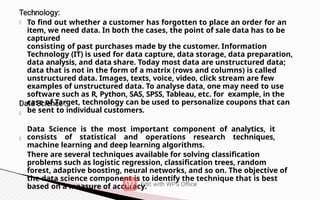
To find outwhether a customer has forgotten to place an order for an
item, we need data. In both the cases, the point of sale data has to be
captured
consisting of past purchases made by the customer. Information
Technology (IT) is used for data capture, data storage, data preparation,
data analysis, and data share. Today most data are unstructured data;
data that is not in the form of a matrix (rows and columns) is called
unstructured data. Images, texts, voice, video, click stream are few
examples of unstructured data. To analyse data, one may need to use
software such as R, Python, SAS, SPSS, Tableau, etc. for example, in the
case of Target, technology can be used to personalize coupons that can
be sent to individual customers.
Data Science is the most important component of analytics, it
consists of statistical and operations research techniques,
machine learning and deep learning algorithms.
There are several techniques available for solving classification
problems such as logistic regression, classification trees, random
forest, adaptive boosting, neural networks, and so on. The objective of
the data science component is to identify the technique that is best
based on a measure of accuracy.
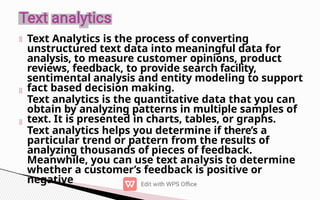
Text Analytics isthe process of converting
unstructured text data into meaningful data for
analysis, to measure customer opinions, product
reviews, feedback, to provide search facility,
sentimental analysis and entity modeling to support
fact based decision making.
Text analytics is the quantitative data that you can
obtain by analyzing patterns in multiple samples of
text. It is presented in charts, tables, or graphs.
Text analytics helps you determine if there’s a
particular trend or pattern from the results of
analyzing thousands of pieces of feedback.
Meanwhile, you can use text analysis to determine
whether a customer’s feedback is positive or
negative
79.
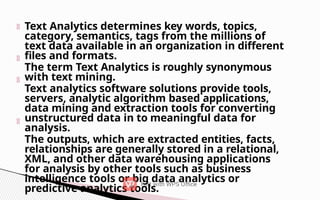
Text Analytics determineskey words, topics,
category, semantics, tags from the millions of
text data available in an organization in different
files and formats.
The term Text Analytics is roughly synonymous
with text mining.
Text analytics software solutions provide tools,
servers, analytic algorithm based applications,
data mining and extraction tools for converting
unstructured data in to meaningful data for
analysis.
The outputs, which are extracted entities, facts,
relationships are generally stored in a relational,
XML, and other data warehousing applications
for analysis by other tools such as business
intelligence tools or big data analytics or
predictive analytics tools.
81.
Every business strivesto provide the best to their
customers. To achieve this, they are depending on text
analytics to study and understand patterns, drifts in
behavior through the positive and negative feedback
provided, buying trends, opinions of consumers, blogs
etc.
And modify the approachability to satisfy needs
which can make a greater impact on business.
By implementing text-based analytics, a business can
bridge the gap to unlock the very needs and demands
of the customers.
Text analytics focuses on quantitative insights that
give the essence of ‘why’ a particular problem arises
and ‘what’ the reasons are and upon understanding,
‘how’ can a business overcome it in the most effective
way.
Various tools like HANA, Python, R, Microsoft excel etc
can
be used to achieve important tasks of Text
82.
It involves extractingthe relevant
information from large volumes of textual data. It centres on
extracting attributes and entities. This information can be
used for further analysis.
Information Retrieval (IR) alludes to
extricating relevant and related examples dependent on a
particular arrangement of words or expressions. In this content
mining strategy, IR frameworks utilize various calculations to
track and screen client practices and find applicable
information as needs are. Google and Yahoo web indexes are
the two most famous IR frameworks.
It looks to recognize characteristic constructions in
text based data and sort them into relevant subgroups or
'bunches' for additional examination. A critical test in the
grouping interaction is to frame significant groups from the
unlabelled text-based information without having any earlier
data on them.
83.
This content miningstrategy helps
to create a summary of a large volume of text in a
way that the meaning and intent of the original
document is preserved.
This technique is used to classify
text (review, paragraph, document) into a relevant
category. The text could be the reviews provided
by different users for a product and the reviews
could be classified as positive or negative.
Similarly, a mail can be classified into a spam or
non spam email.
84.
Text mining andtext analytics are often used
interchangeably. The term text mining is generally
used to derive qualitative insights from unstructured
text, while text analytics provides quantitative results.
For example, text mining can be used to identify if
customers are satisf ied with a product by analyzing
their reviews and surveys. Text analytics is used for
deeper insights, like identifying a pattern or trend
from the unstructured text. For example, text analytics
can be used to understand a negative spike in the
customer experience or popularity of a product.
The results of text analytics can then be used
with
for easier understanding and
prompt decision making.
85.
•
•
•
There are arange of ways that text analytics can help
businesses, organizations, and event social movements:
Help businesses to understand customer trends, product
performance, and service quality. This results in quick decision
making, enhancing
, increased productivity, and cost savings.
• Helps researchers to explore a great deal of pre-existing literature in
a short time, extracting what is relevant to their study. This helps in
quicker scientif ic breakthroughs.
Assists in understanding general trends and opinions in the
society, that enable governments and political bodies in decision
making.
• Text analytic techniques help search engines and information
retrieval systems to improve their performance, thereby
providing fast user experiences.
Ref ine user content recommendation systems by categorizing
related content.
86.
•
•
•
•
•
•
There are severaltechniques related to analyzing the
unstructured text. Each of these techniques is used for
different use case scenarios.
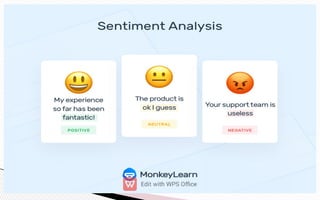
1.
Sentiment analysis is used to identify the emotions conveyed by the
unstructured text. The input text includes product reviews, customer
interactions, social media posts, forum discussions, or blogs. There are
different types of sentiment analysis. Polarity analysis is used to identify
if the text expresses positive or negative sentiment. The categorization
technique is used for a more f ine-grained analysis of emotions - confused,
disappointed, or angry.
Use cases of sentiment analysis:
Measure customer response to a product or a
service Understand audience trends towards a
brand Understand new trends in consumer
space
Prioritize customer service issues based on the
severity
Track how customer sentiment evolves over
Text analytics techniques and use
cases
87.
•
•
•
This technique isused to find the major themes or topics in a massive volume
of text or a set of documents. Topic modeling identif ies the keywords used in
text to identify the subject of the article.
Use cases of topic modeling:
• Large law f irms use topic modeling to examine hundreds of documents
during large litigations.
Online media uses topic modeling to pick up trending topics across the web.
Researchers use topic modeling for exploratory literature
review. Businesses can determine which of their products
are successful.
• Topic modeling helps anthropologists to determine the emergent issues and
trends in a society based on the content people share on the web.
88.
•
•
•
NER is atext analytics technique used for identifying named entities
like people, places, organizations, and events in unstructured text. NER
extracts nouns from the text and determines the values of these
nouns.
Use cases of named entity recognition:
NER is used to classify news content based on people,
places, and organizations featured in them.
Search and recommendation engines use NER for information
retrieval.
For large chain companies, NER is used to sort customer service
requests and assign them to a specific city, or outlet.
• Hospitals can use NER to automate the analysis of lab reports.
89.
•
This is atext analytics technique that is an advancement over the
named entity extraction. Event extraction recognizes events mentioned in
text content, for example, mergers, acquisitions, political moves, or important
meetings. Event extraction requires an advanced understanding of the
semantics of text content. Advanced algorithms strive to recognize not only
events but the venue, participants, date, and time wherever applicable. Event
extraction is a benef icial technique that has multiple uses across fields.
Use cases of event extraction:
Link analysis: This is a technique to understand “who met whom and when”
through event extraction from communication over social media. This
is used by law enforcement agencies to predict possible threats to national
security.
90.
• Geospatial analysis:When events are extracted along
with their locations, the insights can be used to overlay
them on a map. This is helpful in the geospatial analysis
of the events.
• Business risk monitoring: Large organizations deal with
multiple partner companies and suppliers. Event
extraction techniques allow businesses to monitor the
web to f ind out if any of their partners, like suppliers
or vendors, are dealing with adverse events like
lawsuits or bankruptcy.
91.
1.
2.
Text analytics isa sophisticated technique that involves several pre-steps to gather
and cleanse the unstructured text. There are different ways in which text analytics
can be performed. This is an example of a model workflow.
Text data is often scattered around the internal databases
of an
organization, including in customer chats, emails, product reviews, service tickets
and Net Promoter Score surveys. Users also generate external data in the form of
blog posts, news, reviews, social media posts and web forum discussions. While
the internal data is readily available for analytics, the external data needs to be
gathered.
Once the unstructured text data is available, it needs to go
through
several preparatory steps before machine learning algorithms can analyze it. In most
of the text analytics software, this step happens automatically. Text
preparation includes several techniques using natural language processing as
92.
a
.
In this step,the text analysis algorithms break the
continuous string
of text data into tokens or smaller units that make up entire words or
phrases.
For instance, character tokens could be each individual letter in this
word: F-I-S-H.
Or, you can break up by subword tokens: Fish-ing. Tokens represent the
basis of all natural language processing.
This step also discards all the unwanted contents of the text,
including white spaces.
b : In this step, each token in the data is
assigned a grammatical category like noun, verb, adjective, and adverb.
93.
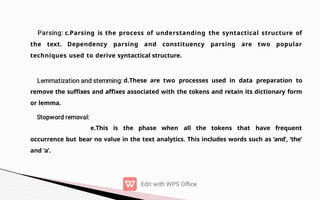
c.Parsing is theprocess of understanding the syntactical structure of
the text. Dependency parsing and constituency parsing are two popular
techniques used to derive syntactical structure.
d.These are two processes used in data preparation to
remove the suffixes and affixes associated with the tokens and retain its dictionary form
or lemma.
e.This is the phase when all the tokens that have frequent
occurrence but bear no value in the text analytics. This includes words such as ‘and’, ‘the’
and ‘a’.
94.
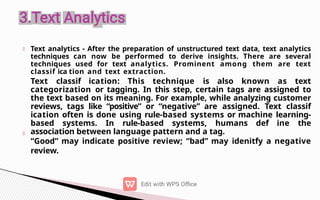
Text analytics -After the preparation of unstructured text data, text analytics
techniques can now be performed to derive insights. There are several
techniques used for text analytics. Prominent among them are text
classif ica tion and text extraction.
Text classif ication: This technique is also known as text
categorization or tagging. In this step, certain tags are assigned to
the text based on its meaning. For example, while analyzing customer
reviews, tags like “positive” or “negative” are assigned. Text classif
ication often is done using rule-based systems or machine learning-
based systems. In rule-based systems, humans def ine the
association between language pattern and a tag.
“Good” may indicate positive review; “bad” may idenitfy a negative
review.
95.
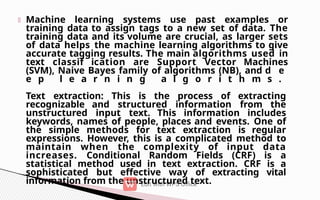
Machine learning systemsuse past examples or
training data to assign tags to a new set of data. The
training data and its volume are crucial, as larger sets
of data helps the machine learning algorithms to give
accurate tagging results. The main algorithms used in
text classif ication are Support Vector Machines
(SVM), Naive Bayes family of algorithms (NB), and d e
e p l e a r n i n g a l g o r i t h m s .
Text extraction: This is the process of extracting
recognizable and structured information from the
unstructured input text. This information includes
keywords, names of people, places and events. One of
the simple methods for text extraction is regular
expressions. However, this is a complicated method to
maintain when the complexity of input data
increases. Conditional Random Fields (CRF) is a
statistical method used in text extraction. CRF is a
sophisticated but effective way of extracting vital
information from the unstructured text.
96.
Once the textanalytics methods are used to process the
unstructured data, the output information can be fed to data
visualization systems. The results can then be visualized in the
form of charts, plots, tables, infographics, or dashboards. This
visual data enables businesses to quickly spot trends in the data
and make decisions.
97.
Web analytics isthe process of analyzing the behavior of visitors to a
website. This involves tracking, reviewing and reporting data to measure
web activity, including the use of a website and its components, such as
webpages, images and videos.
Data collected through web analytics may include traffic sources, referring
sites, page views, paths taken and conversion rates. The compiled data
often forms a part of customer relationship management analytics to
facilitate and streamline better business decisions.
Web analytics enables a business to retain customers, attract more
visitors and increase the dollar volume each customer spends.
98.
•
•
•
•
Determine the likelihoodthat a given customer will repurchase a product after purchasing it
in the past. Personalize the site to customers who visit it repeatedly.
• Monitor the amount of money individual customers or specific groups of customers spend.
Observe the geographic regions from which the most and the least customers visit the site
and purchase specific products.
Predict which products customers are most and least likely to buy in the future.
The objective of web analytics is to serve as a for promoting specif ic products
to the customers who are most likely to buy them and to determine which products a specif i
c
customer is most likely to purchase. This can help improve the ratio of revenue to marketing
costs.
In addition to these features, web analytics may track the clickthrough and drilldown
behavior of customers within a website, determine the sites from which customers
most often arrive, and communicate with browsers to track and analyze online behavior.
The results of web analytics are provided in the form of tables, charts and graphs.
100.
1.
2.
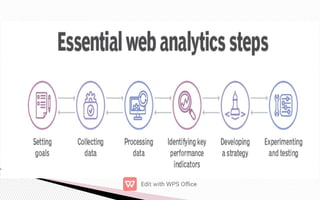
The web analyticsprocess involves the following
steps:
The f irst step in the web analytics process is for businesses to determine goals
and the end results they are trying to achieve. These goals can include increased sales,
customer satisfaction and brand awareness. Business goals can be both quantitative and
The second step in web analytics is the collection and storage of data.
Businesses can
collect data directly from a website or web analytics tool, such as The data
mainly comes from requests -- including data at the network and
application levels -- and can be combined with external data to interpret web usage. For
example, a user's
is typically associated with many factors, including geographic
location and clickthrough rates.
101.
The next stageof the web analytics funnel involves businesses
processing the collected data into actionable information.
4. In web analytics, a KPI is a quantif iable
measure to monitor and analyze user behavior on a website. Examples include bounce
rates, ,
and on-site search queries.
5. This stage involves implementing insights to formulate strategies
that align with an organization's goals. For example, search queries conducted on-site can
help an organization develop a content strategy based on what users are searching for on
its website.
Businesses need to experiment with different strategies in order
to f ind the one that yields the best results. For example, is a simple strategy to help
learn how an audience responds to different content. The process involves creating two or
more versions of content and then displaying it to different audience segments to reveal
which version of the content performs better
102.
The two maincategories of web analytics are off-site web analytics and
on-site web analytics.
The term off-site web analytics refers to the practice of monitoring
visitor
activity outside of an organization's website to measure potential
audience.
Off-site web analytics provides an industrywide analysis that gives
insight into how a business is performing in comparison to
competitors. It refers to the type of analytics that focuses on data
collected from across the web, such as
On-site web analytics refers to a narrower focus that uses analytics
to track the activity of visitors to a specific site to see how the site is
performing. The data gathered is usually more relevant to a site's
owner and can include details on site engagement, such as what
content is most popular. Two technological approaches to on-site
web analytics include analysis
and page tagging.
103.
Log f ileanalysis, also known as , is the process of
analyzing data gathered from log f iles to monitor, troubleshoot
and report on the performance of a website. Log f iles hold records
of virtually every action taken on a network server, such as a web
server, email server, database server or f ile server.
Page tagging is the process of adding snippets of code into a
website's HyperText Markup Language code using a to
track website visitors and their interactions across the website.
These snippets of code are called tags. When businesses add these
tags to a website, they can be used to track any number of metrics,
such as the number of pages viewed, the number of unique visitors
and the number of specific products viewed.
104.
•
Web analytics toolsreport important statistics on a website, such as
where visitors came from, how long they stayed, how they found
the site and their online activity while on the site. In addition to web
analytics, these tools are commonly used for
and
.
Some examples of web analytics tools include the
following:
Google Analytics is a web analytics platform that
monitors website traf fic, behaviors and conversions. The platform
tracks page views, unique visitors, bounce rates, referral Uniform
Resource Locators, average time on-site, page abandonment, new
vs. returning visitors and demographic data.
105.
•
•
•
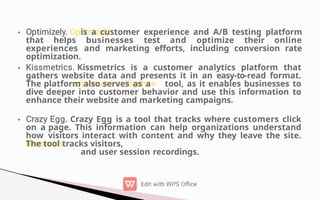
is a customerexperience and A/B testing platform
that helps businesses test and optimize their online
experiences and marketing efforts, including conversion rate
optimization.
Kissmetrics is a customer analytics platform that
gathers website data and presents it in an easy-to-read format.
The platform also serves as a tool, as it enables businesses to
dive deeper into customer behavior and use this information to
enhance their website and marketing campaigns.
Crazy Egg is a tool that tracks where customers click
on a page. This information can help organizations understand
how visitors interact with content and why they leave the site.
The tool tracks visitors,
and user session recordings.
107.
refers to theprocess of extracting
insights from data to make informed decisions
regarding a business question or challenge.
Here are five skills you can develop to improve your
understanding of business analytics.
One of the fundamental skills to build before diving into
business analytics is data literacy. At its most basic, data
literacy means you’re familiar with the language of data,
including different types, sources, and analytical tools and
techniques.
Being data literate also means you’re comfortable
working with data in various ways—from evaluating it
to manipulating it and gaining insights.
108.
The first stepin leveraging analytics to drive business
decisions is to collect a data sample from which
conclusions can be drawn.
In some cases, a dataset already exists, and it’s up to the
business analyst to pull relevant information. For example,
if you’re interested in discovering a retail store’s most
profitable products, you might start by pulling historical
sales data for transactions that took place over a specific
period.
Several statistical methods can be helpful when it
comes to analysis, including:
Hypothesis testing , which is a statistical means of
testing an assumption.
Linear regression analysis, which can be used to
evaluate the relationship between two variables.
109.
Multiple regression analysis,which is used to
evaluate the relationship between three or more
variables.
Through these forms of analysis, you can draw
insights and conclusions that answer your business
question.
While insights derived from reliable data are key to
making informed business decisions, it’s likely that
other stakeholders need to be involved in the decision-
making process. For this reason, effectively
communicating your findings is essential.
Without strong communication skills, the value of your
analyses can go unrealized.
Data visualization goes hand in hand with strong
communication, as it allows you to present findings in an
easily digestible format for those who may not be as data