Downloaded 28 times
![IJRET: International Journal of Research in Engineering and Technology ISSN: 2319-1163
__________________________________________________________________________________________
Volume: 02 Issue: 04 | Apr-2013, Available @ http://www.ijret.org 614
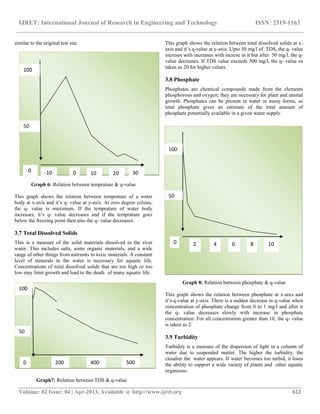
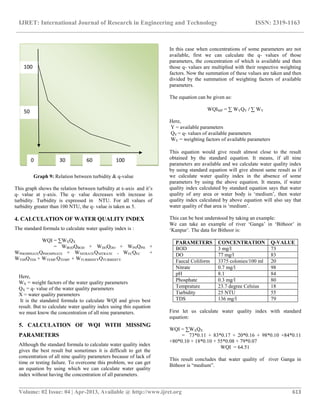
Now let us calculate water quality index by using second
equation with BOD as missing parameter:
WQIMP = ∑WYQY / ∑WY
= (20*0.16 + 98*0.10 + 84*0.11 + 80*0.10 +
18*0.10 + 55*0.08 + 79*0.07 + 83*0.17) / (0.16 + 0.10 + 0.11
+ 0.10 + 0.10 + 0.08 + 0.07 + 0.17)
WQIMP = 63.02
Although the result is different from the first result but the
difference is very less and can be avoided as we can see, in
both the cases the water quality of river Ganga in Bithoor is
„medium‟
CONCLUSIONS
Thus it can be concluded that the equation to calculate water
quality index with missing parameters is very useful when it is
difficult to find the concentration of all nine quality
parameters.
ACKNOWLEDGEMENTS
First and above all, I would like to thank God, the almighty for
providing me this opportunity.
I feel great pleasure in expressing my deep sense of gratitude,
obligation and heartiest respect to Pradeep Kumar,
Department of Civil Engg. for his kind support, meticulous
guidance and heart touching inspirations throughout this paper
work.
I gratefully acknowledge the blessings and valuable
suggestions from all faculty members of the department
especially Dr. D. L. Parmar, Dr. Deepesh Singh and Prof.
Sunil Kumar.
I am thankful to the authorities of Central Library, HBTI
Kanpur, for permitting me to consult the library.
I take this opportunity to express my thanks and gratitude to
my parents and my friends for their never ending affection and
encouragement.
REFERENCES:
[1]. National sanitation foundation
[2]. www.water-research.net
[3]. www.waterontheweb.org
BIOGRAPHIES:
Garima Srivastava, M. Tech.(Environmental
science & engg.), HBTI Kanpur, Uttar
Pradesh(India)
Pradeep Kumar, Associate Professor,
Department of Civil Engg., HBTI Kanpur,
Uttar Pradesh(India)](https://image.slidesharecdn.com/waterqualityindexwithmissingparameters-160801102916/85/Water-quality-index-with-missing-parameters-6-320.jpg)

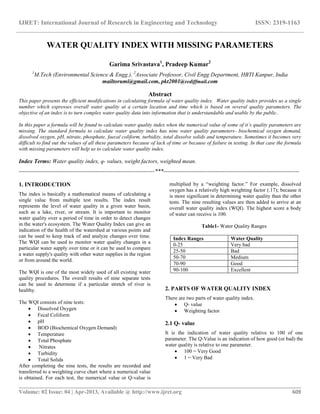
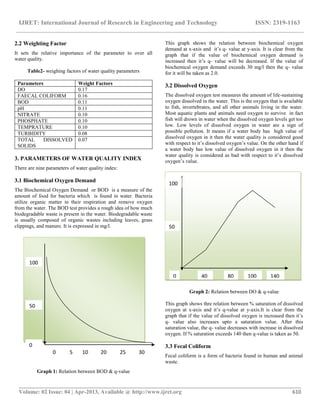
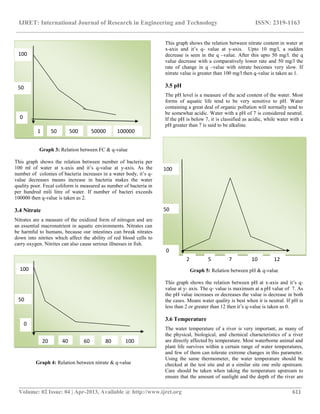
This document presents modifications to the formula for calculating the water quality index (WQI) that allow for missing parameters. It explains the importance of WQI in assessing water quality based on multiple parameters and offers a new equation for estimating WQI when some data is unavailable. The paper details the nine parameters used in the standard WQI calculation and provides examples, demonstrating that the modified equation yields results close to those from the standard calculation.


