SlideShare a Scribd company logo
1 of 21
Main Stages of Water Treatmnet Plant
Pulsator Mechanism
 Works like a gentle up-and-down
motion in the clarifier.
 This movement helps to shake up
the particles and encourage them
to settle down, making it easier to
remove impurities and clean the
water effectively.
Main Objectives
 Determine the most effective alum dose within a
specified range for optimal coagulation in the
water treatment process.
 Evaluate and understand the performance
variations among the four clarifier phases to
identify the most efficient phase for water
treatment.
Water Treatment Terminology and
Definitions
Turbidity : Cloudiness or haziness of water due to suspended particles like sediment, silt, and
organic matter. Measured in nephelometric turbidity units (NTU).
pH : Measure of the acidic or basic nature of the solution.
Alkalinity : Measurement of the water buffering capacity/ability to resist changes of pH with
addition of acid or base.
Alum : Aluminium sulphate, is a common coagulant used in water.
treatment processes.
Coagulant : Chemical substances added to water during treatment to remove suspended
particles and contaminants.
Raw water : Untreated water from its natural source, such as rivers, lakes, or groundwater.
Methodology
01. Data Pre-processing
Cleaning, transforming, and organizing raw data to make it suitable for
analysis.
02. Descriptive Statistics Summarize and describe the main features of a dataset.
03. Data Visualization
Graphical representations of data to help understand trends, patterns,
and relationships.
04. Check Normality and Homogeneity
of Variance
Before using ANOVA, check the data meets the assumptions of
normality and homogeneity of variance.
05. Mean Comparison
Determine the most effective clarifier and the optimal range of alum
dosage for water treatment.
06. Efficiency Calculation
Assessing the turbidity removal efficacy across different phases of
treatment
The dataset was analysed with R software and organized
with MS Excel, including efficiency calculations.
Results and
Discussion
Find the most appropriate Alum dose range
 Alum doses range 25mg/L and 30mg/L, have stable levels. But dose 10 shows spikes.
 pH values show inverse relationship with alum dose.
Correlation Analysis
 Alum and pH - Strong negative correlation
 Alum and turbidity - Moderate negative correlation
 Alum and alkalinity - Weak negative correlstion
Alum releases hydrogen ions (H⁺) when it dissolves.
Help to flocculation process.
 Acceptable levels of drinking water
quality range for,
• Turbidity - Below 2 NTU
• pH - Between 6.5 to 8.5
• Alkalinity - Below 200ppm
 Lowest turbidity value of 0.8803 NTU
was recorded at at 30 mg/L alum dose.
Mean Values of Turbidity pH and Alkalinity with Alum
Dose
Mean Values of Turbidity with Alum Dose
 Turbidity of the water generally
decreased due to the alum's
ability to clump together particles.
 At a certain point, adding more
alum caused turbidity to increase
because of the excess alum in the
water.
 We can suggest 20-40 mg/L (30 ±
10) range was the appropriate
dose range for Jar test.
Compare and find the best clarifier
 Sharp peak occurs around day 150, but clarified water turbidity consistently maintains low levels
across all phases.
 Raw water pH fluctuates between 7 and 8.5, and clarified water pH maintains stable levels within 7
to 8 range within 5 months in four phases.
Correlation Analysis
 Raw water turbidity and the turbidity of the four phases of clarified water are weakly
positive correlated.
 It indicating that the clarifier system can accommodate a wide range of turbidity levels
without significant fluctuation.
Normality and homogeneity of variance
Phase P value of turbidity P value of pH
Clarified Water 01 0.2793 0.2682
Clarified Water 02 0.4361 0.7632
Clarified Water 03 < 0.0001 0.8728
Clarified Water 04 0.0019 0.0026
 CW1_Turb, CW2_Turb, CW1_pH,
CW2_pH, and CW3_pH approximately
normally distributed.
 CW3_Turb, CW4_Turb and CW4_pH
indicate a deviation from normal
distribution.
 Levene's Test showed that the variances of turbidity levels across four phases of clarifiers are
not uniform and p-value of 0.3404 ( > 0.05) indicating equal variances of pHs.
3.1.4. Kruskal Wallis Test and Wilcoxon Rank Sum Test
 The Kruskal Wallis Test, with a small P-value (2.2 × 10⁻¹⁶
) revealed significant differences in
turbidity and pH levels across four clarifier phases.
Comparing Means P value of turbidity P value of pH
CW_1 and CW_2 < 0.0001 0.0023
CW_1 and CW_3 < 0.0001 0.0002
CW_1 and CW_4 < 0.0001 < 0.0001
CW_2 and CW_3 0.9785 < 0.0001
CW_2 and CW_4 < 0.0001 < 0.0001
CW_3 and CW_4 < 0.0001 0.0336
 No significant difference in turbidity
levels between CW2_Turb and
CW3_Turb.
 Other turbidity pairs indicate strong
evidence of significant differences
between these groups.
Boxplot and Mean graph
 CW3 and CW2 showed similar turbidity median, with CW3 having larger variance.
 CW4 had the lowest median and mean turbidity values, demonstrating its exceptional
performance in clarifying water.
Turbidity Removal Efficiency
Efficiency(%) =
𝑹𝒂𝒘 𝒘𝒂𝒕𝒆𝒓 𝒕𝒖𝒓𝒃𝒊𝒅𝒊𝒕𝒚 − 𝑪𝒍𝒂𝒓𝒊𝒇𝒊𝒆𝒅 𝒘𝒂𝒕𝒆𝒓 𝒕𝒖𝒓𝒃𝒊𝒅𝒊𝒕𝒚
𝑹𝒂𝒘 𝒘𝒂𝒕𝒆𝒓 𝒕𝒖𝒓𝒃𝒊𝒅𝒊𝒕𝒚
∗ 𝟏𝟎𝟎
Turbidity Removal Efficiency
 The efficiency graph illustrates significant fluctuations in April, July, and September across
the four phases of clarifiers.
 CW4 is the most efficient phase for turbidity removal in water treatment processes.
Conclusion
 According to the results, the best alum dosage range for jar testing is 20 – 40 mg/L
(30 ±10), which indicates the ideal dosage for efficient particle removal.
 After a detailed comparison of turbidity levels between the clarifier phases, phase 4
showed the best technique for removing turbidity.
 Based on these findings, we can leverage the clarified water phase 4 mechanism to
enhance the quality of drinking water and use it for other phases.
 Additionally, the optimal turbidity removal range identified in the jar test results
suggests an effective approach for achieving improved water clarity.
References
Issa, H. (2017). Evaluation of Water Quality and Performance for a Water Treatment Plant: Khanaqin City
as a Case Study. Journal of Garmian University, 3(Khanaqine Conference), 802–821.
https://doi.org/10.24271/garmian.64
Khudhair, Z. S., Zubaidi, S. L., Ortega-Martorell, S., Al-Ansari, N., Ethaib, S., & Hashim, K. (2022). A
Review of Hybrid Soft Computing and Data Pre-Processing Techniques to Forecast Freshwater Quality’s
Parameters: Current Trends and Future Directions. https://doi.org/10.3390/environments9070085
Kowalik, T., Bogdal, A., Borek, Ł., & Kogut, A. (2015). The effect of treated sewage outflow from a
modernized sewage treatment plant on water quality of the Breń river. Journal of Ecological
Engineering, 16(4), 96–102. https://doi.org/10.12911/22998993/59355
Marinović Ruždjak, A., & Ruždjak, D. (2015). Evaluation of river water quality variations using multivariate
statistical techniques: Sava River (Croatia): A case study. Environmental Monitoring and Assessment,
187(4), 1–14. https://doi.org/10.1007/s10661-015-4393-x
Nordmann, E., McAleer, P., Toivo, W., Paterson, H., & DeBruine, L. M. (2022). Data Visualization Using R
for Researchers Who Do Not Use R. Advances in Methods and Practices in Psychological Science, 5(2).
https://doi.org/10.1177/25152459221074654
CREDITS: This presentation template was created by Slidesgo, and includes
icons by Flaticon, and infographics & images by Freepik
Thank You
● Pulsator technology
The sludge formed during flocculation is made up of an expansion mass called “sludge bed”. Water,
that has coagulated beforehand, arrives from the bottom of the device and flows through this sludge
bed to emerge clarified at the top of the settling tank. The sludge bed is kept in expansion with the
help of a pulsating operation.
● vacuumizing
The air chamber is depressurised by pumping out the air that it contains resulting in a gradual rise in
level until a height of 0.6 to 1 m above the water level is reached. During this phase, the sludge bed
settles down with the effect of gravity.
● flushing – decompression
When the high level is reached in the air chamber, the vacuum-breaking valve opens; water then
flows at great speed through the manifolds creating a flushing effect. The sludge bed is
decompressed. The excess sludge (water impurities and reagents) flows into the concentrators
where it is extracted at regular intervals.
21

More Related Content

Similar to waste management water treatment FInal PP.pptx

VIMLESH Project REPORT
VIMLESH Project REPORTVIMLESH Project REPORT
VIMLESH Project REPORTVIMLESH VERMA
 
WATER TREATMENT PLANT final ppt for water treatment
WATER TREATMENT PLANT final ppt for water treatmentWATER TREATMENT PLANT final ppt for water treatment
WATER TREATMENT PLANT final ppt for water treatmentchinardipaknaiknaik
 
Water Analysis through High Performance Liquid Chromotography, Ion Exchange R...
Water Analysis through High Performance Liquid Chromotography, Ion Exchange R...Water Analysis through High Performance Liquid Chromotography, Ion Exchange R...
Water Analysis through High Performance Liquid Chromotography, Ion Exchange R...Jonathan Damora
 
total alkalinity in water and waste water
total alkalinity in water and waste watertotal alkalinity in water and waste water
total alkalinity in water and waste water21pwciv5761
 
THE EFFECT OF WATER TREATMENT ON SELENIUM AND VANADIUM LEVELS OF WATER IN KAR...
THE EFFECT OF WATER TREATMENT ON SELENIUM AND VANADIUM LEVELS OF WATER IN KAR...THE EFFECT OF WATER TREATMENT ON SELENIUM AND VANADIUM LEVELS OF WATER IN KAR...
THE EFFECT OF WATER TREATMENT ON SELENIUM AND VANADIUM LEVELS OF WATER IN KAR...EDITOR IJCRCPS
 
The comparative study of waste water and purified water present in sewage tre...
The comparative study of waste water and purified water present in sewage tre...The comparative study of waste water and purified water present in sewage tre...
The comparative study of waste water and purified water present in sewage tre...IRJET Journal
 
Interior services unit 1
Interior services unit 1Interior services unit 1
Interior services unit 1ctlachu
 
Quality and purification of domestic water supply
Quality and purification of domestic water supplyQuality and purification of domestic water supply
Quality and purification of domestic water supplyBrijesh Kumar
 
Paper id 312201524
Paper id 312201524Paper id 312201524
Paper id 312201524IJRAT
 
WATER QUALITY PARAMETERS
WATER QUALITY PARAMETERSWATER QUALITY PARAMETERS
WATER QUALITY PARAMETERSJenson Samraj
 
Laboratory manual of water supply and sewerage engineering
Laboratory manual of water supply and sewerage engineeringLaboratory manual of water supply and sewerage engineering
Laboratory manual of water supply and sewerage engineeringTaufique Hasan
 
Project water t&d
Project water t&dProject water t&d
Project water t&dDEEPAK0733
 

Similar to waste management water treatment FInal PP.pptx (20)

VIMLESH Project REPORT
VIMLESH Project REPORTVIMLESH Project REPORT
VIMLESH Project REPORT
 
WATER TREATMENT PLANT final ppt for water treatment
WATER TREATMENT PLANT final ppt for water treatmentWATER TREATMENT PLANT final ppt for water treatment
WATER TREATMENT PLANT final ppt for water treatment
 
Water Analysis through High Performance Liquid Chromotography, Ion Exchange R...
Water Analysis through High Performance Liquid Chromotography, Ion Exchange R...Water Analysis through High Performance Liquid Chromotography, Ion Exchange R...
Water Analysis through High Performance Liquid Chromotography, Ion Exchange R...
 
Water quality
Water qualityWater quality
Water quality
 
Water quality
Water qualityWater quality
Water quality
 
Turbidity lab 7
Turbidity  lab 7Turbidity  lab 7
Turbidity lab 7
 
total alkalinity in water and waste water
total alkalinity in water and waste watertotal alkalinity in water and waste water
total alkalinity in water and waste water
 
project
projectproject
project
 
Analytical Chem Presentation
Analytical Chem PresentationAnalytical Chem Presentation
Analytical Chem Presentation
 
THE EFFECT OF WATER TREATMENT ON SELENIUM AND VANADIUM LEVELS OF WATER IN KAR...
THE EFFECT OF WATER TREATMENT ON SELENIUM AND VANADIUM LEVELS OF WATER IN KAR...THE EFFECT OF WATER TREATMENT ON SELENIUM AND VANADIUM LEVELS OF WATER IN KAR...
THE EFFECT OF WATER TREATMENT ON SELENIUM AND VANADIUM LEVELS OF WATER IN KAR...
 
The comparative study of waste water and purified water present in sewage tre...
The comparative study of waste water and purified water present in sewage tre...The comparative study of waste water and purified water present in sewage tre...
The comparative study of waste water and purified water present in sewage tre...
 
Interior services unit 1
Interior services unit 1Interior services unit 1
Interior services unit 1
 
Quality and purification of domestic water supply
Quality and purification of domestic water supplyQuality and purification of domestic water supply
Quality and purification of domestic water supply
 
EPC - Lab Report One
EPC - Lab Report OneEPC - Lab Report One
EPC - Lab Report One
 
Paper id 312201524
Paper id 312201524Paper id 312201524
Paper id 312201524
 
WATER QUALITY PARAMETERS
WATER QUALITY PARAMETERSWATER QUALITY PARAMETERS
WATER QUALITY PARAMETERS
 
Laboratory manual of water supply and sewerage engineering
Laboratory manual of water supply and sewerage engineeringLaboratory manual of water supply and sewerage engineering
Laboratory manual of water supply and sewerage engineering
 
Detergents(1)
Detergents(1)Detergents(1)
Detergents(1)
 
C7_Reid_Nicole
C7_Reid_NicoleC7_Reid_Nicole
C7_Reid_Nicole
 
Project water t&d
Project water t&dProject water t&d
Project water t&d
 

Recently uploaded

How to Send Pro Forma Invoice to Your Customers in Odoo 17
How to Send Pro Forma Invoice to Your Customers in Odoo 17How to Send Pro Forma Invoice to Your Customers in Odoo 17
How to Send Pro Forma Invoice to Your Customers in Odoo 17Celine George
 
Basic Civil Engineering notes on Transportation Engineering & Modes of Transport
Basic Civil Engineering notes on Transportation Engineering & Modes of TransportBasic Civil Engineering notes on Transportation Engineering & Modes of Transport
Basic Civil Engineering notes on Transportation Engineering & Modes of TransportDenish Jangid
 
OSCM Unit 2_Operations Processes & Systems
OSCM Unit 2_Operations Processes & SystemsOSCM Unit 2_Operations Processes & Systems
OSCM Unit 2_Operations Processes & SystemsSandeep D Chaudhary
 
e-Sealing at EADTU by Kamakshi Rajagopal
e-Sealing at EADTU by Kamakshi Rajagopale-Sealing at EADTU by Kamakshi Rajagopal
e-Sealing at EADTU by Kamakshi RajagopalEADTU
 
Spring gala 2024 photo slideshow - Celebrating School-Community Partnerships
Spring gala 2024 photo slideshow - Celebrating School-Community PartnershipsSpring gala 2024 photo slideshow - Celebrating School-Community Partnerships
Spring gala 2024 photo slideshow - Celebrating School-Community Partnershipsexpandedwebsite
 
When Quality Assurance Meets Innovation in Higher Education - Report launch w...
When Quality Assurance Meets Innovation in Higher Education - Report launch w...When Quality Assurance Meets Innovation in Higher Education - Report launch w...
When Quality Assurance Meets Innovation in Higher Education - Report launch w...Gary Wood
 
Graduate Outcomes Presentation Slides - English (v3).pptx
Graduate Outcomes Presentation Slides - English (v3).pptxGraduate Outcomes Presentation Slides - English (v3).pptx
Graduate Outcomes Presentation Slides - English (v3).pptxneillewis46
 
Personalisation of Education by AI and Big Data - Lourdes Guàrdia
Personalisation of Education by AI and Big Data - Lourdes GuàrdiaPersonalisation of Education by AI and Big Data - Lourdes Guàrdia
Personalisation of Education by AI and Big Data - Lourdes GuàrdiaEADTU
 
Trauma-Informed Leadership - Five Practical Principles
Trauma-Informed Leadership - Five Practical PrinciplesTrauma-Informed Leadership - Five Practical Principles
Trauma-Informed Leadership - Five Practical PrinciplesPooky Knightsmith
 
SURVEY I created for uni project research
SURVEY I created for uni project researchSURVEY I created for uni project research
SURVEY I created for uni project researchCaitlinCummins3
 
SPLICE Working Group: Reusable Code Examples
SPLICE Working Group:Reusable Code ExamplesSPLICE Working Group:Reusable Code Examples
SPLICE Working Group: Reusable Code ExamplesPeter Brusilovsky
 
Stl Algorithms in C++ jjjjjjjjjjjjjjjjjj
Stl Algorithms in C++ jjjjjjjjjjjjjjjjjjStl Algorithms in C++ jjjjjjjjjjjjjjjjjj
Stl Algorithms in C++ jjjjjjjjjjjjjjjjjjMohammed Sikander
 
ĐỀ THAM KHẢO KÌ THI TUYỂN SINH VÀO LỚP 10 MÔN TIẾNG ANH FORM 50 CÂU TRẮC NGHI...
ĐỀ THAM KHẢO KÌ THI TUYỂN SINH VÀO LỚP 10 MÔN TIẾNG ANH FORM 50 CÂU TRẮC NGHI...ĐỀ THAM KHẢO KÌ THI TUYỂN SINH VÀO LỚP 10 MÔN TIẾNG ANH FORM 50 CÂU TRẮC NGHI...
ĐỀ THAM KHẢO KÌ THI TUYỂN SINH VÀO LỚP 10 MÔN TIẾNG ANH FORM 50 CÂU TRẮC NGHI...Nguyen Thanh Tu Collection
 
會考英文會考英文會考英文會考英文會考英文會考英文會考英文會考英文會考英文會考英文會考英文
會考英文會考英文會考英文會考英文會考英文會考英文會考英文會考英文會考英文會考英文會考英文會考英文會考英文會考英文會考英文會考英文會考英文會考英文會考英文會考英文會考英文會考英文
會考英文會考英文會考英文會考英文會考英文會考英文會考英文會考英文會考英文會考英文會考英文中 央社
 
Analyzing and resolving a communication crisis in Dhaka textiles LTD.pptx
Analyzing and resolving a communication crisis in Dhaka textiles LTD.pptxAnalyzing and resolving a communication crisis in Dhaka textiles LTD.pptx
Analyzing and resolving a communication crisis in Dhaka textiles LTD.pptxLimon Prince
 
Major project report on Tata Motors and its marketing strategies
Major project report on Tata Motors and its marketing strategiesMajor project report on Tata Motors and its marketing strategies
Major project report on Tata Motors and its marketing strategiesAmanpreetKaur157993
 
24 ĐỀ THAM KHẢO KÌ THI TUYỂN SINH VÀO LỚP 10 MÔN TIẾNG ANH SỞ GIÁO DỤC HẢI DƯ...
24 ĐỀ THAM KHẢO KÌ THI TUYỂN SINH VÀO LỚP 10 MÔN TIẾNG ANH SỞ GIÁO DỤC HẢI DƯ...24 ĐỀ THAM KHẢO KÌ THI TUYỂN SINH VÀO LỚP 10 MÔN TIẾNG ANH SỞ GIÁO DỤC HẢI DƯ...
24 ĐỀ THAM KHẢO KÌ THI TUYỂN SINH VÀO LỚP 10 MÔN TIẾNG ANH SỞ GIÁO DỤC HẢI DƯ...Nguyen Thanh Tu Collection
 
Improved Approval Flow in Odoo 17 Studio App
Improved Approval Flow in Odoo 17 Studio AppImproved Approval Flow in Odoo 17 Studio App
Improved Approval Flow in Odoo 17 Studio AppCeline George
 

Recently uploaded (20)

How to Send Pro Forma Invoice to Your Customers in Odoo 17
How to Send Pro Forma Invoice to Your Customers in Odoo 17How to Send Pro Forma Invoice to Your Customers in Odoo 17
How to Send Pro Forma Invoice to Your Customers in Odoo 17
 
Basic Civil Engineering notes on Transportation Engineering & Modes of Transport
Basic Civil Engineering notes on Transportation Engineering & Modes of TransportBasic Civil Engineering notes on Transportation Engineering & Modes of Transport
Basic Civil Engineering notes on Transportation Engineering & Modes of Transport
 
OSCM Unit 2_Operations Processes & Systems
OSCM Unit 2_Operations Processes & SystemsOSCM Unit 2_Operations Processes & Systems
OSCM Unit 2_Operations Processes & Systems
 
e-Sealing at EADTU by Kamakshi Rajagopal
e-Sealing at EADTU by Kamakshi Rajagopale-Sealing at EADTU by Kamakshi Rajagopal
e-Sealing at EADTU by Kamakshi Rajagopal
 
Spring gala 2024 photo slideshow - Celebrating School-Community Partnerships
Spring gala 2024 photo slideshow - Celebrating School-Community PartnershipsSpring gala 2024 photo slideshow - Celebrating School-Community Partnerships
Spring gala 2024 photo slideshow - Celebrating School-Community Partnerships
 
When Quality Assurance Meets Innovation in Higher Education - Report launch w...
When Quality Assurance Meets Innovation in Higher Education - Report launch w...When Quality Assurance Meets Innovation in Higher Education - Report launch w...
When Quality Assurance Meets Innovation in Higher Education - Report launch w...
 
Graduate Outcomes Presentation Slides - English (v3).pptx
Graduate Outcomes Presentation Slides - English (v3).pptxGraduate Outcomes Presentation Slides - English (v3).pptx
Graduate Outcomes Presentation Slides - English (v3).pptx
 
Personalisation of Education by AI and Big Data - Lourdes Guàrdia
Personalisation of Education by AI and Big Data - Lourdes GuàrdiaPersonalisation of Education by AI and Big Data - Lourdes Guàrdia
Personalisation of Education by AI and Big Data - Lourdes Guàrdia
 
Trauma-Informed Leadership - Five Practical Principles
Trauma-Informed Leadership - Five Practical PrinciplesTrauma-Informed Leadership - Five Practical Principles
Trauma-Informed Leadership - Five Practical Principles
 
SURVEY I created for uni project research
SURVEY I created for uni project researchSURVEY I created for uni project research
SURVEY I created for uni project research
 
SPLICE Working Group: Reusable Code Examples
SPLICE Working Group:Reusable Code ExamplesSPLICE Working Group:Reusable Code Examples
SPLICE Working Group: Reusable Code Examples
 
Stl Algorithms in C++ jjjjjjjjjjjjjjjjjj
Stl Algorithms in C++ jjjjjjjjjjjjjjjjjjStl Algorithms in C++ jjjjjjjjjjjjjjjjjj
Stl Algorithms in C++ jjjjjjjjjjjjjjjjjj
 
ĐỀ THAM KHẢO KÌ THI TUYỂN SINH VÀO LỚP 10 MÔN TIẾNG ANH FORM 50 CÂU TRẮC NGHI...
ĐỀ THAM KHẢO KÌ THI TUYỂN SINH VÀO LỚP 10 MÔN TIẾNG ANH FORM 50 CÂU TRẮC NGHI...ĐỀ THAM KHẢO KÌ THI TUYỂN SINH VÀO LỚP 10 MÔN TIẾNG ANH FORM 50 CÂU TRẮC NGHI...
ĐỀ THAM KHẢO KÌ THI TUYỂN SINH VÀO LỚP 10 MÔN TIẾNG ANH FORM 50 CÂU TRẮC NGHI...
 
會考英文會考英文會考英文會考英文會考英文會考英文會考英文會考英文會考英文會考英文會考英文
會考英文會考英文會考英文會考英文會考英文會考英文會考英文會考英文會考英文會考英文會考英文會考英文會考英文會考英文會考英文會考英文會考英文會考英文會考英文會考英文會考英文會考英文
會考英文會考英文會考英文會考英文會考英文會考英文會考英文會考英文會考英文會考英文會考英文
 
Analyzing and resolving a communication crisis in Dhaka textiles LTD.pptx
Analyzing and resolving a communication crisis in Dhaka textiles LTD.pptxAnalyzing and resolving a communication crisis in Dhaka textiles LTD.pptx
Analyzing and resolving a communication crisis in Dhaka textiles LTD.pptx
 
Mattingly "AI and Prompt Design: LLMs with NER"
Mattingly "AI and Prompt Design: LLMs with NER"Mattingly "AI and Prompt Design: LLMs with NER"
Mattingly "AI and Prompt Design: LLMs with NER"
 
Major project report on Tata Motors and its marketing strategies
Major project report on Tata Motors and its marketing strategiesMajor project report on Tata Motors and its marketing strategies
Major project report on Tata Motors and its marketing strategies
 
24 ĐỀ THAM KHẢO KÌ THI TUYỂN SINH VÀO LỚP 10 MÔN TIẾNG ANH SỞ GIÁO DỤC HẢI DƯ...
24 ĐỀ THAM KHẢO KÌ THI TUYỂN SINH VÀO LỚP 10 MÔN TIẾNG ANH SỞ GIÁO DỤC HẢI DƯ...24 ĐỀ THAM KHẢO KÌ THI TUYỂN SINH VÀO LỚP 10 MÔN TIẾNG ANH SỞ GIÁO DỤC HẢI DƯ...
24 ĐỀ THAM KHẢO KÌ THI TUYỂN SINH VÀO LỚP 10 MÔN TIẾNG ANH SỞ GIÁO DỤC HẢI DƯ...
 
VAMOS CUIDAR DO NOSSO PLANETA! .
VAMOS CUIDAR DO NOSSO PLANETA!                    .VAMOS CUIDAR DO NOSSO PLANETA!                    .
VAMOS CUIDAR DO NOSSO PLANETA! .
 
Improved Approval Flow in Odoo 17 Studio App
Improved Approval Flow in Odoo 17 Studio AppImproved Approval Flow in Odoo 17 Studio App
Improved Approval Flow in Odoo 17 Studio App
 

waste management water treatment FInal PP.pptx

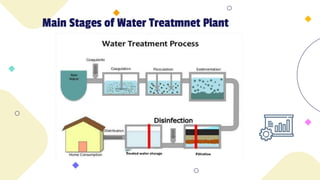
  • 1. Main Stages of Water Treatmnet Plant
  • 2. Pulsator Mechanism  Works like a gentle up-and-down motion in the clarifier.  This movement helps to shake up the particles and encourage them to settle down, making it easier to remove impurities and clean the water effectively.
  • 3. Main Objectives  Determine the most effective alum dose within a specified range for optimal coagulation in the water treatment process.  Evaluate and understand the performance variations among the four clarifier phases to identify the most efficient phase for water treatment.
  • 4. Water Treatment Terminology and Definitions Turbidity : Cloudiness or haziness of water due to suspended particles like sediment, silt, and organic matter. Measured in nephelometric turbidity units (NTU). pH : Measure of the acidic or basic nature of the solution. Alkalinity : Measurement of the water buffering capacity/ability to resist changes of pH with addition of acid or base. Alum : Aluminium sulphate, is a common coagulant used in water. treatment processes. Coagulant : Chemical substances added to water during treatment to remove suspended particles and contaminants. Raw water : Untreated water from its natural source, such as rivers, lakes, or groundwater.
  • 5. Methodology 01. Data Pre-processing Cleaning, transforming, and organizing raw data to make it suitable for analysis. 02. Descriptive Statistics Summarize and describe the main features of a dataset. 03. Data Visualization Graphical representations of data to help understand trends, patterns, and relationships. 04. Check Normality and Homogeneity of Variance Before using ANOVA, check the data meets the assumptions of normality and homogeneity of variance. 05. Mean Comparison Determine the most effective clarifier and the optimal range of alum dosage for water treatment. 06. Efficiency Calculation Assessing the turbidity removal efficacy across different phases of treatment The dataset was analysed with R software and organized with MS Excel, including efficiency calculations.
  • 7. Find the most appropriate Alum dose range  Alum doses range 25mg/L and 30mg/L, have stable levels. But dose 10 shows spikes.  pH values show inverse relationship with alum dose.
  • 8. Correlation Analysis  Alum and pH - Strong negative correlation  Alum and turbidity - Moderate negative correlation  Alum and alkalinity - Weak negative correlstion Alum releases hydrogen ions (H⁺) when it dissolves. Help to flocculation process.
  • 9.  Acceptable levels of drinking water quality range for, • Turbidity - Below 2 NTU • pH - Between 6.5 to 8.5 • Alkalinity - Below 200ppm  Lowest turbidity value of 0.8803 NTU was recorded at at 30 mg/L alum dose. Mean Values of Turbidity pH and Alkalinity with Alum Dose
  • 10. Mean Values of Turbidity with Alum Dose  Turbidity of the water generally decreased due to the alum's ability to clump together particles.  At a certain point, adding more alum caused turbidity to increase because of the excess alum in the water.  We can suggest 20-40 mg/L (30 ± 10) range was the appropriate dose range for Jar test.
  • 11. Compare and find the best clarifier  Sharp peak occurs around day 150, but clarified water turbidity consistently maintains low levels across all phases.  Raw water pH fluctuates between 7 and 8.5, and clarified water pH maintains stable levels within 7 to 8 range within 5 months in four phases.
  • 12. Correlation Analysis  Raw water turbidity and the turbidity of the four phases of clarified water are weakly positive correlated.  It indicating that the clarifier system can accommodate a wide range of turbidity levels without significant fluctuation.
  • 13. Normality and homogeneity of variance Phase P value of turbidity P value of pH Clarified Water 01 0.2793 0.2682 Clarified Water 02 0.4361 0.7632 Clarified Water 03 < 0.0001 0.8728 Clarified Water 04 0.0019 0.0026  CW1_Turb, CW2_Turb, CW1_pH, CW2_pH, and CW3_pH approximately normally distributed.  CW3_Turb, CW4_Turb and CW4_pH indicate a deviation from normal distribution.  Levene's Test showed that the variances of turbidity levels across four phases of clarifiers are not uniform and p-value of 0.3404 ( > 0.05) indicating equal variances of pHs.
  • 14. 3.1.4. Kruskal Wallis Test and Wilcoxon Rank Sum Test  The Kruskal Wallis Test, with a small P-value (2.2 × 10⁻¹⁶ ) revealed significant differences in turbidity and pH levels across four clarifier phases. Comparing Means P value of turbidity P value of pH CW_1 and CW_2 < 0.0001 0.0023 CW_1 and CW_3 < 0.0001 0.0002 CW_1 and CW_4 < 0.0001 < 0.0001 CW_2 and CW_3 0.9785 < 0.0001 CW_2 and CW_4 < 0.0001 < 0.0001 CW_3 and CW_4 < 0.0001 0.0336  No significant difference in turbidity levels between CW2_Turb and CW3_Turb.  Other turbidity pairs indicate strong evidence of significant differences between these groups.
  • 15. Boxplot and Mean graph  CW3 and CW2 showed similar turbidity median, with CW3 having larger variance.  CW4 had the lowest median and mean turbidity values, demonstrating its exceptional performance in clarifying water.
  • 16. Turbidity Removal Efficiency Efficiency(%) = 𝑹𝒂𝒘 𝒘𝒂𝒕𝒆𝒓 𝒕𝒖𝒓𝒃𝒊𝒅𝒊𝒕𝒚 − 𝑪𝒍𝒂𝒓𝒊𝒇𝒊𝒆𝒅 𝒘𝒂𝒕𝒆𝒓 𝒕𝒖𝒓𝒃𝒊𝒅𝒊𝒕𝒚 𝑹𝒂𝒘 𝒘𝒂𝒕𝒆𝒓 𝒕𝒖𝒓𝒃𝒊𝒅𝒊𝒕𝒚 ∗ 𝟏𝟎𝟎
  • 17. Turbidity Removal Efficiency  The efficiency graph illustrates significant fluctuations in April, July, and September across the four phases of clarifiers.  CW4 is the most efficient phase for turbidity removal in water treatment processes.
  • 18. Conclusion  According to the results, the best alum dosage range for jar testing is 20 – 40 mg/L (30 ±10), which indicates the ideal dosage for efficient particle removal.  After a detailed comparison of turbidity levels between the clarifier phases, phase 4 showed the best technique for removing turbidity.  Based on these findings, we can leverage the clarified water phase 4 mechanism to enhance the quality of drinking water and use it for other phases.  Additionally, the optimal turbidity removal range identified in the jar test results suggests an effective approach for achieving improved water clarity.
  • 19. References Issa, H. (2017). Evaluation of Water Quality and Performance for a Water Treatment Plant: Khanaqin City as a Case Study. Journal of Garmian University, 3(Khanaqine Conference), 802–821. https://doi.org/10.24271/garmian.64 Khudhair, Z. S., Zubaidi, S. L., Ortega-Martorell, S., Al-Ansari, N., Ethaib, S., & Hashim, K. (2022). A Review of Hybrid Soft Computing and Data Pre-Processing Techniques to Forecast Freshwater Quality’s Parameters: Current Trends and Future Directions. https://doi.org/10.3390/environments9070085 Kowalik, T., Bogdal, A., Borek, Ł., & Kogut, A. (2015). The effect of treated sewage outflow from a modernized sewage treatment plant on water quality of the Breń river. Journal of Ecological Engineering, 16(4), 96–102. https://doi.org/10.12911/22998993/59355 Marinović Ruždjak, A., & Ruždjak, D. (2015). Evaluation of river water quality variations using multivariate statistical techniques: Sava River (Croatia): A case study. Environmental Monitoring and Assessment, 187(4), 1–14. https://doi.org/10.1007/s10661-015-4393-x Nordmann, E., McAleer, P., Toivo, W., Paterson, H., & DeBruine, L. M. (2022). Data Visualization Using R for Researchers Who Do Not Use R. Advances in Methods and Practices in Psychological Science, 5(2). https://doi.org/10.1177/25152459221074654
  • 20. CREDITS: This presentation template was created by Slidesgo, and includes icons by Flaticon, and infographics & images by Freepik Thank You
  • 21. ● Pulsator technology The sludge formed during flocculation is made up of an expansion mass called “sludge bed”. Water, that has coagulated beforehand, arrives from the bottom of the device and flows through this sludge bed to emerge clarified at the top of the settling tank. The sludge bed is kept in expansion with the help of a pulsating operation. ● vacuumizing The air chamber is depressurised by pumping out the air that it contains resulting in a gradual rise in level until a height of 0.6 to 1 m above the water level is reached. During this phase, the sludge bed settles down with the effect of gravity. ● flushing – decompression When the high level is reached in the air chamber, the vacuum-breaking valve opens; water then flows at great speed through the manifolds creating a flushing effect. The sludge bed is decompressed. The excess sludge (water impurities and reagents) flows into the concentrators where it is extracted at regular intervals. 21