This document describes a hydrological framework developed in the form of a Hydrologic Information System (HIS) to meet the information needs of various government departments related to water management in a state. The HIS consists of a hydrological database coupled with tools for collecting and analyzing spatial and non-spatial water resources data. It also incorporates a hydrological model to indirectly assess water balance components over space and time. A web-based GIS portal was created to allow users to access and visualize the hydrological data, as well as outputs from the SWAT hydrological model. The framework is intended to facilitate integrated water resources planning and management across different administrative levels.
The Presentation gives the overview of the process necessary for accomplishing the task for the preparation of Ground water movements and identification carried out by Rajiv gandhi national drinking water mission project.
Application of GIS in Mine Contamination and Associated Environmental ImpactsArsalan Syed, PMP
• The purpose of this project was to apply GIS and remote sensing methods to determine the spatial extent and level of pollution at mining sites in order to develop or implement the best approach and technique in prevention and reclamation.
• Two case studies were analyzed to understand the importance of remediation and the human, ecological, and socio-cultural impacts of acid mine drainage.
identification of ground water potential zones using gis and remote sensingtp jayamohan
the identification of ground water potential zones using gis and remote sensing.The study is conducted in the Muvattupuzha block.The various parameters used are geology,geomorphology,rainfall,soil type,etc.
Mumbai University, T.Y.B.Sc.(I.T.), Semester VI, Principles of Geographic Information System, USIT604, Discipline Specific Elective Unit 1: Introduction to GIS
Watershed delineation and LULC mappingKapil Thakur
Watershed Delineation - a watershed as an enormous bowl. As water falls onto the bowl’s rim, it either flows down the inside of the bowl or down the outside of the bowl. The rim of the bowl or the watershed boundary is sometimes referred to as the ridgeline or watershed divide. This ridge line separates one watershed from
another.
Topographic maps created by the United States Geological Survey can help you to determine a watershed’s boundaries.
Land use and land cover map (LULC Mapping) -
Land cover indicates the physical land type such as forest or open water whereas land use documents how people are using the land. … Land cover maps provide information to help managers best understand the current landscape. To see change over time, land cover maps for several different years are needed.
Objectives:
Develop a replicable integrated model (methodology) for evaluating the extent and development potential of renewable (non-renewable) groundwater resources in arid lands, with the Eastern Desert of Egypt as a pilot site.
The model will be replicable for similar arid areas; North of Sudan, Tibesty, Yemen, and Saudi Arabia.
Building national capacities.
As an industry we need to do a better job of making sense of our dynamically changing world by combining sensors, with software focused on providing solutions that work together to solve the challenges we meet today.
Fpga implementation of image segmentation by using edge detection based on so...eSAT Journals
Abstract In this paper, we present the method of “FPGA implementation of image segmentation by using edge detection based on the sobel edge operator” .due to advancement in computer vision it can be implemented in fpga based architecture. image segmentation separates an image into component regions and object. Segmentation needs to segment the object from the background to read image properly and identify the image carefully. Edge detection is fundamental tool for image segmentation. Sobel edge operator, which is very popular edge detection algorithms, is considered in this work. Sobel method uses the derivative approximation to find edge and perform 2-D spatial gradient measurement for images uses horizontal and vertical gradient matrices .The fpga device providing good performance of integrated circuit platform for research and development. The compact structure of image segmentation into edge detection can be implemented in MAT LAB using VHDL code and the waveform is shown in the model sim.. Keywords: VLSI, FPGA, image segmentation, sobel edge operators, edge detection pixel, mat lab.
I have presented the power point presentation on Basics of the optical character recognition. Here i have focused to discuss about hoe OCR is used in scanning process and can it be used for document scanning and its uses.
Information and communication technology:a class presentationSelim Reza Bappy
its a powerpoint presentation of the student of hon's 2nd year (2012-13)of the department of Information Science and Library Management of the University of dhaka. It will be helpfull for the junior.
Water Resource Management Using Artificial Intelligence Enabled RS & GIS (1).pdfSamirsinh Parmar
RS
GIS
AI
ANI
AGI
ASI
IoT
DSS
ESRI
Artificail Intelligence
Remote sensing with AI
AI enhanced GIS
AI enhanced RS
AI Application for RS & GIS
Scope of AI in RS & GIS
Geospatial Artificial Intelligence
Integration of gis technology for fuzzy deterministic modeling conditions of ...eSAT Journals
Abstract
Offers scientific and methodological basics for application of fuzzy-deterministic simulation geofiltration processes in single layers on the basis of the application of GIS technology in terms of dominance fuzzy initial information. GIS model of Kegeyli withdrawal of groundwater (KWGV) is carried out on the basis of software including ArcGIS (ArcCatalog, ArcMap). The problems of a situational analysis of the results clearly-deterministic simulation. The proposed information model and information model KWGV filtration process to ensure that the relationship between the object model and the geofiltration, represented as a system of fuzzy-deterministic two-dimensional (quasi three-dimensional) nonlinear differential equations filtering and organizing computational experiments (CE). In this context, discusses aspects of geoinformation approach in the process of fuzzy-deterministic simulation of operating conditions Kegeyli abstraction of groundwater. It is proposed software system that focuses on the study of hydro geological objects, both local and regional scale using data from heterogeneous. Formalization of fuzzy algorithms parameters of underground hydrosphere, the relationship abstraction of groundwater and its model. The algorithms select the solution in the formation and exploitation of groundwater resources, the principles of the information model of the region of the filtering process. The results of solving the problem of formalization of parameters and forecast the state of groundwater Kegeyli withdrawals of groundwater.
Keywords: groundwater intakes, fuzzy-deterministic approach, the computational process, information model, geofiltration, information models, symbolic model GIS.
IoT Based Smart Water Monitoring and Distribution System For An ApartmentsYogeshIJTSRD
As we know water is so precious for human being as well as for the complete nature without which it will not be possible to survive. Even though lot many efforts have been taken by government through various schemes and it is becoming difficult day by day to save water for future and make efficient utilization of it. In this proposed work, an IoT design for water monitoring and control approach which supports internet based data collection on real time bases. This proposed system shall implement in highly populated residential buildings like hotels, lodge, hostels, dormitory, apartments, shopping malls etc. And also, this system can provide a complete survey and the usage of water by every individual room. This system addresses that the flow rate measuring and scheming the supply of water in order to limit the water wastage and approach the water conservation and also this system can measure the quality and quantity of water distributed to every household by using ph and flow rate sensors. The system has been designed in such a way that it will monitor the available water level continuously. System has been implemented by using embedded system and communication will takes. Dr. R. Mohana Priya | M. Sathyamoorthy | S. Surya | V. Vishnu Gopal "IoT Based Smart Water Monitoring & Distribution System For An Apartments" Published in International Journal of Trend in Scientific Research and Development (ijtsrd), ISSN: 2456-6470, Volume-5 | Issue-3 , April 2021, URL: https://www.ijtsrd.com/papers/ijtsrd41133.pdf Paper URL: https://www.ijtsrd.com/engineering/electronics-and-communication-engineering/41133/iot-based-smart-water-monitoring-and-distribution-system-for-an-apartments/dr-r-mohana-priya
IJRET : International Journal of Research in Engineering and Technology is an international peer reviewed, online journal published by eSAT Publishing House for the enhancement of research in various disciplines of Engineering and Technology. The aim and scope of the journal is to provide an academic medium and an important reference for the advancement and dissemination of research results that support high-level learning, teaching and research in the fields of Engineering and Technology. We bring together Scientists, Academician, Field Engineers, Scholars and Students of related fields of Engineering and Technology
Monitoring and gis mapping of groundwater level variations in gulbarga cityeSAT Journals
Abstract
Gulbarga is a fast developing city in Karnataka, India. Groundwater is a major source of water supply for the city which is reflected
by regular extraction of groundwater through ever increasing number of municipal, industrial and private bore wells. Monitoring
groundwater levels and quality is useful to understand impact of uncontrolled drilling of bore wells, point and non point sources of
pollutants. Such studies provide early indicators of changes in groundwater resource and help to understand how to protect it. A total
of 55 bore wells were selected for the study with one bore well per municipal ward of the city. Spatial coordinates were registered on
site for each bore well with a GPS instrument and water depth below the ground level is measured during pre monsoon season using
manual method. The results indicate wide fluctuations in groundwater depth across the municipal wards and the groundwater flow is
found to follow surface relief in the study area. GIS map showing groundwater depth and level are developed and compared with
surface relief map. These maps are very useful for urban planning and sustainable groundwater usage.
Keywords: Groundwater, GIS mapping, Surface relief map, spatial distribution map
Seven most coveted job openings for hydroinformatics engineering.pptxMrinmoy Majumder
Topics related to informatics (AI,ML,IoT,ICT) and its applications in water resources development are referred to as Hydroinformatics Engineering. In recent years, the demand for educated manpower in this field has increased manifold. As a result, job opportunities related to this field have increased proportionally. This post is about the seven most desired job opportunities that are available only for hydro informatics engineers.
This research paper undertakes the development of water pumping system that was capable of automatically managing water budgets from a reservoir through a microcontroller (Arduino Uno Microcontroller) subsystem. A user-friendly and efficient water management system that has the capability to irrigate farms based on automated algorithm, logic and electronic circuitry was developed. The Object Oriented System Analysis and Design (OOSAD) methodology was used for the analysis and development of the system under consideration. The software application communicates directly with a microcontroller unit and uses manual over-ride approach in some cases to manage water budgets. The water-level sensor and the soil-moisture-content sensor check the level of water storage and soil moisture content in a reservoir and reports to an electronic controller respectively. The water pumping software for irrigation system was developed using C# for Windows application development, establishing routines and relationships, Embedded C was used in defining status and processes in the Arduino Uno microcontroller, PHPMyAdmin as a database management system and MYSQL relational database server version 5.5 as the backend for storing user inputs from the frontend. The water-pumping software for irrigation system provides the user interface providing irrigation in gardens or farms. The system was able to pump water from reservoir which can be used to irrigate farms or gardens
Mechanical properties of hybrid fiber reinforced concrete for pavementseSAT Journals
Abstract
The effect of addition of mono fibers and hybrid fibers on the mechanical properties of concrete mixture is studied in the present
investigation. Steel fibers of 1% and polypropylene fibers 0.036% were added individually to the concrete mixture as mono fibers and
then they were added together to form a hybrid fiber reinforced concrete. Mechanical properties such as compressive, split tensile and
flexural strength were determined. The results show that hybrid fibers improve the compressive strength marginally as compared to
mono fibers. Whereas, hybridization improves split tensile strength and flexural strength noticeably.
Keywords:-Hybridization, mono fibers, steel fiber, polypropylene fiber, Improvement in mechanical properties.
Material management in construction – a case studyeSAT Journals
Abstract
The objective of the present study is to understand about all the problems occurring in the company because of improper application
of material management. In construction project operation, often there is a project cost variance in terms of the material, equipments,
manpower, subcontractor, overhead cost, and general condition. Material is the main component in construction projects. Therefore,
if the material management is not properly managed it will create a project cost variance. Project cost can be controlled by taking
corrective actions towards the cost variance. Therefore a methodology is used to diagnose and evaluate the procurement process
involved in material management and launch a continuous improvement was developed and applied. A thorough study was carried
out along with study of cases, surveys and interviews to professionals involved in this area. As a result, a methodology for diagnosis
and improvement was proposed and tested in selected projects. The results obtained show that the main problem of procurement is
related to schedule delays and lack of specified quality for the project. To prevent this situation it is often necessary to dedicate
important resources like money, personnel, time, etc. To monitor and control the process. A great potential for improvement was
detected if state of the art technologies such as, electronic mail, electronic data interchange (EDI), and analysis were applied to the
procurement process. These helped to eliminate the root causes for many types of problems that were detected.
Managing drought short term strategies in semi arid regions a case studyeSAT Journals
Abstract
Drought management needs multidisciplinary action. Interdisciplinary efforts among the experts in various fields of the droughts
prone areas are helpful to achieve tangible and permanent solution for this recurring problem. The Gulbarga district having the total
area around 16, 240 sq.km, and accounts 8.45 per cent of the Karnataka state area. The district has been situated with latitude 17º 19'
60" North and longitude of 76 º 49' 60" east. The district is situated entirely on the Deccan plateau positioned at a height of 300 to
750 m above MSL. Sub-tropical, semi-arid type is one among the drought prone districts of Karnataka State. The drought
management is very important for a district like Gulbarga. In this paper various short term strategies are discussed to mitigate the
drought condition in the district.
Keywords: Drought, South-West monsoon, Semi-Arid, Rainfall, Strategies etc.
Life cycle cost analysis of overlay for an urban road in bangaloreeSAT Journals
Abstract
Pavements are subjected to severe condition of stresses and weathering effects from the day they are constructed and opened to traffic
mainly due to its fatigue behavior and environmental effects. Therefore, pavement rehabilitation is one of the most important
components of entire road systems. This paper highlights the design of concrete pavement with added mono fibers like polypropylene,
steel and hybrid fibres for a widened portion of existing concrete pavement and various overlay alternatives for an existing
bituminous pavement in an urban road in Bangalore. Along with this, Life cycle cost analyses at these sections are done by Net
Present Value (NPV) method to identify the most feasible option. The results show that though the initial cost of construction of
concrete overlay is high, over a period of time it prove to be better than the bituminous overlay considering the whole life cycle cost.
The economic analysis also indicates that, out of the three fibre options, hybrid reinforced concrete would be economical without
compromising the performance of the pavement.
Keywords: - Fatigue, Life cycle cost analysis, Net Present Value method, Overlay, Rehabilitation
Laboratory studies of dense bituminous mixes ii with reclaimed asphalt materialseSAT Journals
Abstract
The issue of growing demand on our nation’s roadways over that past couple of decades, decreasing budgetary funds, and the need to
provide a safe, efficient, and cost effective roadway system has led to a dramatic increase in the need to rehabilitate our existing
pavements and the issue of building sustainable road infrastructure in India. With these emergency of the mentioned needs and this
are today’s burning issue and has become the purpose of the study.
In the present study, the samples of existing bituminous layer materials were collected from NH-48(Devahalli to Hassan) site.The
mixtures were designed by Marshall Method as per Asphalt institute (MS-II) at 20% and 30% Reclaimed Asphalt Pavement (RAP).
RAP material was blended with virgin aggregate such that all specimens tested for the, Dense Bituminous Macadam-II (DBM-II)
gradation as per Ministry of Roads, Transport, and Highways (MoRT&H) and cost analysis were carried out to know the economics.
Laboratory results and analysis showed the use of recycled materials showed significant variability in Marshall Stability, and the
variability increased with the increase in RAP content. The saving can be realized from utilization of recycled materials as per the
methodology, the reduction in the total cost is 19%, 30%, comparing with the virgin mixes.
Keywords: Reclaimed Asphalt Pavement, Marshall Stability, MS-II, Dense Bituminous Macadam-II
Laboratory investigation of expansive soil stabilized with natural inorganic ...eSAT Journals
Abstract
Soil stabilization has proven to be one of the oldest techniques to improve the soil properties. Literature review conducted revealed
that uses of natural inorganic stabilizers are found to be one of the best options for soil stabilization. In this regard an attempt has
been made to evaluate the influence of RBI-81 stabilizer on properties of black cotton soil through laboratory investigations. Black
cotton soil with varying percentages of RBI-81 viz., 0, 0.5, 1, 1.5, 2, and 2.5 percent were studied for moisture density relationships
and strength behaviour of soils. Also the effect of curing period was evaluated as literature review clearly emphasized the strength
gain of soils stabilized with RBI-81 over a period of time. The results obtained shows that the unconfined compressive strength of
specimens treated with RBI-81 increased approximately by 250% for a curing period of 28 days as compared to virgin soil. Further
the CBR value improved approximately by 400%. The studies indicated an increasing trend for soil strength behaviour with
increasing percentage of RBI-81 suggesting its potential applications in soil stabilization.
Influence of reinforcement on the behavior of hollow concrete block masonry p...eSAT Journals
Abstract
Reinforced masonry was developed to exploit the strength potential of masonry and to solve its lack of tensile strength. Experimental
and analytical studies have been carried out to investigate the effect of reinforcement on the behavior of hollow concrete block
masonry prisms under compression and to predict ultimate failure compressive strength. In the numerical program, three dimensional
non-linear finite elements (FE) model based on the micro-modeling approach is developed for both unreinforced and reinforced
masonry prisms using ANSYS (14.5). The proposed FE model uses multi-linear stress-strain relationships to model the non-linear
behavior of hollow concrete block, mortar, and grout. Willam-Warnke’s five parameter failure theory has been adopted to model the
failure of masonry materials. The comparison of the numerical and experimental results indicates that the FE models can successfully
capture the highly nonlinear behavior of the physical specimens and accurately predict their strength and failure mechanisms.
Keywords: Structural masonry, Hollow concrete block prism, grout, Compression failure, Finite element method,
Numerical modeling.
Influence of compaction energy on soil stabilized with chemical stabilizereSAT Journals
Abstract
Increase in traffic along with heavier magnitude of wheel loads cause rapid deterioration in pavements. There is a need to improve
density, strength of soil subgrade and other pavement layers. In this study an attempt is made to improve the properties of locally
available loamy soil using twin approaches viz., i) increasing the compaction of soil and ii) treating the soil with chemical stabilizer.
Laboratory studies are carried out on both untreated and treated soil samples compacted by different compaction efforts. Studies
show that increase in compaction effort results in increase in density of soil. However in soil treated with chemical stabilizer, rate of
increase in density is not significant. The soil treated with chemical stabilizer exhibits improvement in both strength and performance
properties.
Keywords: compaction, density, subgradestabilization, resilient modulus
Forest type mapping of bidar forest division, karnataka using geoinformatics ...eSAT Journals
Abstract
The study demonstrate the potentiality of satellite remote sensing technique for the generation of baseline information on forest types
including tree plantation details in Bidar forest division, Karnataka covering an area of 5814.60Sq.Kms. The Total Area of Bidar
forest division is 5814Sq.Kms analysis of the satellite data in the study area reveals that about 84% of the total area is Covered by
crop land, 1.778% of the area is covered by dry deciduous forest, 1.38 % of mixed plantation, which is very threatening to the
environmental stability of the forest, future plantation site has been mapped. With the use of latest Geo-informatics technology proper
and exact condition of the trees can be observed and necessary precautions can be taken for future plantation works in an appropriate
manner
Keywords:-RS, GIS, GPS, Forest Type, Tree Plantation
Factors influencing compressive strength of geopolymer concreteeSAT Journals
Abstract
To study effects of several factors on the properties of fly ash based geopolymer concrete on the compressive strength and also the
cost comparison with the normal concrete. The test variables were molarities of sodium hydroxide(NaOH) 8M,14M and 16M, ratio of
NaOH to sodium silicate (Na2SiO3) 1, 1.5, 2 and 2.5, alkaline liquid to fly ash ratio 0.35 and 0.40 and replacement of water in
Na2SiO3 solution by 10%, 20% and 30% were used in the present study. The test results indicated that the highest compressive
strength 54 MPa was observed for 16M of NaOH, ratio of NaOH to Na2SiO3 2.5 and alkaline liquid to fly ash ratio of 0.35. Lowest
compressive strength of 27 MPa was observed for 8M of NaOH, ratio of NaOH to Na2SiO3 is 1 and alkaline liquid to fly ash ratio of
0.40. Alkaline liquid to fly ash ratio of 0.35, water replacement of 10% and 30% for 8 and 16 molarity of NaOH and has resulted in
compressive strength of 36 MPa and 20 MPa respectively. Superplasticiser dosage of 2 % by weight of fly ash has given higher
strength in all cases.
Keywords: compressive strength, alkaline liquid, fly ash
Experimental investigation on circular hollow steel columns in filled with li...eSAT Journals
Abstract
Composite Circular hollow Steel tubes with and without GFRP infill for three different grades of Light weight concrete are tested for
ultimate load capacity and axial shortening , under Cyclic loading. Steel tubes are compared for different lengths, cross sections and
thickness. Specimens were tested separately after adopting Taguchi’s L9 (Latin Squares) Orthogonal array in order to save the initial
experimental cost on number of specimens and experimental duration. Analysis was carried out using ANN (Artificial Neural
Network) technique with the assistance of Mini Tab- a statistical soft tool. Comparison for predicted, experimental & ANN output is
obtained from linear regression plots. From this research study, it can be concluded that *Cross sectional area of steel tube has most
significant effect on ultimate load carrying capacity, *as length of steel tube increased- load carrying capacity decreased & *ANN
modeling predicted acceptable results. Thus ANN tool can be utilized for predicting ultimate load carrying capacity for composite
columns.
Keywords: Light weight concrete, GFRP, Artificial Neural Network, Linear Regression, Back propagation, orthogonal
Array, Latin Squares
Experimental behavior of circular hsscfrc filled steel tubular columns under ...eSAT Journals
Abstract
This paper presents an outlook on experimental behavior and a comparison with predicted formula on the behaviour of circular
concentrically loaded self-consolidating fibre reinforced concrete filled steel tube columns (HSSCFRC). Forty-five specimens were
tested. The main parameters varied in the tests are: (1) percentage of fiber (2) tube diameter or width to wall thickness ratio (D/t
from 15 to 25) (3) L/d ratio from 2.97 to 7.04 the results from these predictions were compared with the experimental data. The
experimental results) were also validated in this study.
Keywords: Self-compacting concrete; Concrete-filled steel tube; axial load behavior; Ultimate capacity.
Evaluation of punching shear in flat slabseSAT Journals
Abstract
Flat-slab construction has been widely used in construction today because of many advantages that it offers. The basic philosophy in
the design of flat slab is to consider only gravity forces; this method ignores the effect of punching shear due to unbalanced moments
at the slab column junction which is critical. An attempt has been made to generate generalized design sheets which accounts both
punching shear due to gravity loads and unbalanced moments for cases (a) interior column; (b) edge column (bending perpendicular
to shorter edge); (c) edge column (bending parallel to shorter edge); (d) corner column. These design sheets are prepared as per
codal provisions of IS 456-2000. These design sheets will be helpful in calculating the shear reinforcement to be provided at the
critical section which is ignored in many design offices. Apart from its usefulness in evaluating punching shear and the necessary
shear reinforcement, the design sheets developed will enable the designer to fix the depth of flat slab during the initial phase of the
design.
Keywords: Flat slabs, punching shear, unbalanced moment.
Evaluation of performance of intake tower dam for recent earthquake in indiaeSAT Journals
Abstract
Intake towers are typically tall, hollow, reinforced concrete structures and form entrance to reservoir outlet works. A parametric
study on dynamic behavior of circular cylindrical towers can be carried out to study the effect of depth of submergence, wall thickness
and slenderness ratio, and also effect on tower considering dynamic analysis for time history function of different soil condition and
by Goyal and Chopra accounting interaction effects of added hydrodynamic mass of surrounding and inside water in intake tower of
dam
Key words: Hydrodynamic mass, Depth of submergence, Reservoir, Time history analysis,
Evaluation of operational efficiency of urban road network using travel time ...eSAT Journals
Abstract
Efficiency of the road network system is analyzed by travel time reliability measures. The study overlooks on an important measure of
travel time reliability and prioritizing Tiruchirappalli road network. Traffic volume and travel time were collected using license plate
matching method. Travel time measures were estimated from average travel time and 95th travel time. Effect of non-motorized vehicle
on efficiency of road system was evaluated. Relation between buffer time index and traffic volume was created. Travel time model has
been developed and travel time measure was validated. Then service quality of road sections in network were graded based on
travel time reliability measures.
Keywords: Buffer Time Index (BTI); Average Travel Time (ATT); Travel Time Reliability (TTR); Buffer Time (BT).
Estimation of surface runoff in nallur amanikere watershed using scs cn methodeSAT Journals
Abstract
The development of watershed aims at productive utilization of all the available natural resources in the entire area extending from
ridge line to stream outlet. The per capita availability of land for cultivation has been decreasing over the years. Therefore, water and
the related land resources must be developed, utilized and managed in an integrated and comprehensive manner. Remote sensing and
GIS techniques are being increasingly used for planning, management and development of natural resources. The study area, Nallur
Amanikere watershed geographically lies between 110 38’ and 110 52’ N latitude and 760 30’ and 760 50’ E longitude with an area of
415.68 Sq. km. The thematic layers such as land use/land cover and soil maps were derived from remotely sensed data and overlayed
through ArcGIS software to assign the curve number on polygon wise. The daily rainfall data of six rain gauge stations in and around
the watershed (2001-2011) was used to estimate the daily runoff from the watershed using Soil Conservation Service - Curve Number
(SCS-CN) method. The runoff estimated from the SCS-CN model was then used to know the variation of runoff potential with different
land use/land cover and with different soil conditions.
Keywords: Watershed, Nallur watershed, Surface runoff, Rainfall-Runoff, SCS-CN, Remote Sensing, GIS.
Estimation of morphometric parameters and runoff using rs & gis techniqueseSAT Journals
Abstract
Land and water are the two vital natural resources, the optimal management of these resources with minimum adverse environmental
impact are essential not only for sustainable development but also for human survival. Satellite remote sensing with geographic
information system has a pragmatic approach to map and generate spatial input layers of predicting response behavior and yield of
watershed. Hence, in the present study an attempt has been made to understand the hydrological process of the catchment at the
watershed level by drawing the inferences from moprhometric analysis and runoff. The study area chosen for the present study is
Yagachi catchment situated in Chickamaglur and Hassan district lies geographically at a longitude 75⁰52’08.77”E and
13⁰10’50.77”N latitude. It covers an area of 559.493 Sq.km. Morphometric analysis is carried out to estimate morphometric
parameters at Micro-watershed to understand the hydrological response of the catchment at the Micro-watershed level. Daily runoff
is estimated using USDA SCS curve number model for a period of 10 years from 2001 to 2010. The rainfall runoff relationship of the
study shows there is a positive correlation.
Keywords: morphometric analysis, runoff, remote sensing and GIS, SCS - method
-
Effect of variation of plastic hinge length on the results of non linear anal...eSAT Journals
Abstract The nonlinear Static procedure also well known as pushover analysis is method where in monotonically increasing loads are applied to the structure till the structure is unable to resist any further load. It is a popular tool for seismic performance evaluation of existing and new structures. In literature lot of research has been carried out on conventional pushover analysis and after knowing deficiency efforts have been made to improve it. But actual test results to verify the analytically obtained pushover results are rarely available. It has been found that some amount of variation is always expected to exist in seismic demand prediction of pushover analysis. Initial study is carried out by considering user defined hinge properties and default hinge length. Attempt is being made to assess the variation of pushover analysis results by considering user defined hinge properties and various hinge length formulations available in literature and results compared with experimentally obtained results based on test carried out on a G+2 storied RCC framed structure. For the present study two geometric models viz bare frame and rigid frame model is considered and it is found that the results of pushover analysis are very sensitive to geometric model and hinge length adopted. Keywords: Pushover analysis, Base shear, Displacement, hinge length, moment curvature analysis
Effect of use of recycled materials on indirect tensile strength of asphalt c...eSAT Journals
Abstract
Depletion of natural resources and aggregate quarries for the road construction is a serious problem to procure materials. Hence
recycling or reuse of material is beneficial. On emphasizing development in sustainable construction in the present era, recycling of
asphalt pavements is one of the effective and proven rehabilitation processes. For the laboratory investigations reclaimed asphalt
pavement (RAP) from NH-4 and crumb rubber modified binder (CRMB-55) was used. Foundry waste was used as a replacement to
conventional filler. Laboratory tests were conducted on asphalt concrete mixes with 30, 40, 50, and 60 percent replacement with RAP.
These test results were compared with conventional mixes and asphalt concrete mixes with complete binder extracted RAP
aggregates. Mix design was carried out by Marshall Method. The Marshall Tests indicated highest stability values for asphalt
concrete (AC) mixes with 60% RAP. The optimum binder content (OBC) decreased with increased in RAP in AC mixes. The Indirect
Tensile Strength (ITS) for AC mixes with RAP also was found to be higher when compared to conventional AC mixes at 300C.
Keywords: Reclaimed asphalt pavement, Foundry waste, Recycling, Marshall Stability, Indirect tensile strength.
Effect of skew angle on static behaviour of reinforced concrete slab bridge d...eSAT Journals
Abstract
The effect of a skew angle on single-span reinforced concrete bridges is analyzed using the finite-element method and the results are
presented in this paper. Investigations are carried out on RC slab bridge decks with and without edge beams to study the influence of
aspect ratio, skew angle and type of load. The finite-element analysis results for skewed bridges are compared to the reference
straight bridges for dead load, IRC Class A loading and IRC 70R loading for with and without edge beam. A total of 90 bridge models
are analyzed. The variation of maximum deflection, maximum longitudinal sagging bending moment, maximum torsional moment, and
maximum support reaction with skew angle is studied for all 90 bridge deck models. The FEA results of Dead load and Live load
bending moments and deflections decreases with increase in skew angle, where as maximum support reactions increases with increase
in skew angle and the maximum torsional moment increases with skew angle up to 45 degrees and there after decreases. The benefit
of providing edge beam is reflected in significant decrease in deflection, longitudinal bending moment and torsional moment.
Keywords: Bridges, skew angle; Concrete slabs; Finite element method; span length; dead load; IRC Class A loading
and IRC Class 70R loading.
Student information management system project report ii.pdfKamal Acharya
Our project explains about the student management. This project mainly explains the various actions related to student details. This project shows some ease in adding, editing and deleting the student details. It also provides a less time consuming process for viewing, adding, editing and deleting the marks of the students.
Event Management System Vb Net Project Report.pdfKamal Acharya
In present era, the scopes of information technology growing with a very fast .We do not see any are untouched from this industry. The scope of information technology has become wider includes: Business and industry. Household Business, Communication, Education, Entertainment, Science, Medicine, Engineering, Distance Learning, Weather Forecasting. Carrier Searching and so on.
My project named “Event Management System” is software that store and maintained all events coordinated in college. It also helpful to print related reports. My project will help to record the events coordinated by faculties with their Name, Event subject, date & details in an efficient & effective ways.
In my system we have to make a system by which a user can record all events coordinated by a particular faculty. In our proposed system some more featured are added which differs it from the existing system such as security.
Industrial Training at Shahjalal Fertilizer Company Limited (SFCL)MdTanvirMahtab2
This presentation is about the working procedure of Shahjalal Fertilizer Company Limited (SFCL). A Govt. owned Company of Bangladesh Chemical Industries Corporation under Ministry of Industries.
Water scarcity is the lack of fresh water resources to meet the standard water demand. There are two type of water scarcity. One is physical. The other is economic water scarcity.
Saudi Arabia stands as a titan in the global energy landscape, renowned for its abundant oil and gas resources. It's the largest exporter of petroleum and holds some of the world's most significant reserves. Let's delve into the top 10 oil and gas projects shaping Saudi Arabia's energy future in 2024.
Courier management system project report.pdfKamal Acharya
It is now-a-days very important for the people to send or receive articles like imported furniture, electronic items, gifts, business goods and the like. People depend vastly on different transport systems which mostly use the manual way of receiving and delivering the articles. There is no way to track the articles till they are received and there is no way to let the customer know what happened in transit, once he booked some articles. In such a situation, we need a system which completely computerizes the cargo activities including time to time tracking of the articles sent. This need is fulfilled by Courier Management System software which is online software for the cargo management people that enables them to receive the goods from a source and send them to a required destination and track their status from time to time.
Automobile Management System Project Report.pdfKamal Acharya
The proposed project is developed to manage the automobile in the automobile dealer company. The main module in this project is login, automobile management, customer management, sales, complaints and reports. The first module is the login. The automobile showroom owner should login to the project for usage. The username and password are verified and if it is correct, next form opens. If the username and password are not correct, it shows the error message.
When a customer search for a automobile, if the automobile is available, they will be taken to a page that shows the details of the automobile including automobile name, automobile ID, quantity, price etc. “Automobile Management System” is useful for maintaining automobiles, customers effectively and hence helps for establishing good relation between customer and automobile organization. It contains various customized modules for effectively maintaining automobiles and stock information accurately and safely.
When the automobile is sold to the customer, stock will be reduced automatically. When a new purchase is made, stock will be increased automatically. While selecting automobiles for sale, the proposed software will automatically check for total number of available stock of that particular item, if the total stock of that particular item is less than 5, software will notify the user to purchase the particular item.
Also when the user tries to sale items which are not in stock, the system will prompt the user that the stock is not enough. Customers of this system can search for a automobile; can purchase a automobile easily by selecting fast. On the other hand the stock of automobiles can be maintained perfectly by the automobile shop manager overcoming the drawbacks of existing system.
COLLEGE BUS MANAGEMENT SYSTEM PROJECT REPORT.pdfKamal Acharya
The College Bus Management system is completely developed by Visual Basic .NET Version. The application is connect with most secured database language MS SQL Server. The application is develop by using best combination of front-end and back-end languages. The application is totally design like flat user interface. This flat user interface is more attractive user interface in 2017. The application is gives more important to the system functionality. The application is to manage the student’s details, driver’s details, bus details, bus route details, bus fees details and more. The application has only one unit for admin. The admin can manage the entire application. The admin can login into the application by using username and password of the admin. The application is develop for big and small colleges. It is more user friendly for non-computer person. Even they can easily learn how to manage the application within hours. The application is more secure by the admin. The system will give an effective output for the VB.Net and SQL Server given as input to the system. The compiled java program given as input to the system, after scanning the program will generate different reports. The application generates the report for users. The admin can view and download the report of the data. The application deliver the excel format reports. Because, excel formatted reports is very easy to understand the income and expense of the college bus. This application is mainly develop for windows operating system users. In 2017, 73% of people enterprises are using windows operating system. So the application will easily install for all the windows operating system users. The application-developed size is very low. The application consumes very low space in disk. Therefore, the user can allocate very minimum local disk space for this application.
Immunizing Image Classifiers Against Localized Adversary Attacksgerogepatton
This paper addresses the vulnerability of deep learning models, particularly convolutional neural networks
(CNN)s, to adversarial attacks and presents a proactive training technique designed to counter them. We
introduce a novel volumization algorithm, which transforms 2D images into 3D volumetric representations.
When combined with 3D convolution and deep curriculum learning optimization (CLO), itsignificantly improves
the immunity of models against localized universal attacks by up to 40%. We evaluate our proposed approach
using contemporary CNN architectures and the modified Canadian Institute for Advanced Research (CIFAR-10
and CIFAR-100) and ImageNet Large Scale Visual Recognition Challenge (ILSVRC12) datasets, showcasing
accuracy improvements over previous techniques. The results indicate that the combination of the volumetric
input and curriculum learning holds significant promise for mitigating adversarial attacks without necessitating
adversary training.
Immunizing Image Classifiers Against Localized Adversary Attacks
Geographical information system (gis) for water resources management
1. IJRET: International Journal of Research in Engineering and Technology eISSN: 2319-1163 | pISSN: 2321-7308
__________________________________________________________________________________________
IC-RICE Conference Issue | Nov-2013, Available @ http://www.ijret.org 417
GEOGRAPHICAL INFORMATION SYSTEM (GIS) FOR WATER
RESOURCES MANAGEMENT
Nagraj S. Patil1
, A. K. Gosain2
1
Associate Professor, Civil Engineering Department, SDM College of Engg, & Tech. Dharwad
2
Professor, Civil Engineering Department, IIT Delhi, New Delhi
nagrajspatil@yahoo.com
Abstract
Water resources projects are inherited with overlapping and at times conflicting objectives. These projects are often of varied sizes
ranging from major projects with command areas of millions of hectares to very small projects implemented at the local level. Thus,
in all these projects there is seldom proper coordination which is essential for ensuring collective sustainability.
Integrated watershed development and management is the accepted answer but in turn requires a comprehensive framework that can
enable planning process involving all the stakeholders at different levels and scales is compulsory. Such a unified hydrological
framework is essential to evaluate the cause and effect of all the proposed actions within the drainage basins.
The present paper describes a hydrological framework developed in the form of a Hydrologic Information System (HIS) which is
intended to meet the specific information needs of the various line departments of a typical State connected with water related aspects.
The HIS consist of a hydrologic information database coupled with tools for collating primary and secondary data and tools for
analyzing and visualizing the data and information. The HIS also incorporates hydrological model base for indirect assessment of
various entities of water balance in space and time. The framework would be maintained and updated to reflect fully the most
accurate ground truth data and the infrastructure requirements for planning and management.
Keywords: Hydrological Information System (HIS); WebGIS; Data Model; Web Mapping Services
-----------------------------------------------------------------------***-------------------------------------------------------------------
1. INTRODUCTION
Integrated water resource management planning is a
comprehensive planning process, involving all stakeholders
within the drainage system, who together as a group,
cooperatively work towards identifying the water resource
issues and concerns, as well as developing and implementing
plans with solutions that are environmentally, socially and
economically sustainable at various levels of connectivity of
the drainage system.
It is important to understand that integrated water resource
management should not merely imply the maintenance of an
inventory of different activities to be undertaken within a
hydrological unit. It also requires the collation of relevant
information needed to evaluate the cause and effect of all the
proposed actions within the drainage basin. The watershed is
the smallest unit where the evaluation of man induced impacts
upon natural resources becomes possible.
Since a watershed is considered as the smallest unit of a
drainage basin, a hydrological framework that can keep track
of the inter-connection of these units is essential. The impact
resulting from action taken at the watershed level will be
experienced at a higher level within the drainage basin, and
the assessment of these impacts will require the availability of
the framework. Such a framework will require regular
maintenance and updating to reflect fully the most accurate
ground truth data and the infrastructure requirements for
planning and management of the relevant planning
departments. Such a framework, once available, could be used
by all the line departments and updated by the relevant
departments which have designated jurisdiction over the data
entry.
The development of Hydrologic Information System
component is logical response to meet the specific information
technology needs of the various line departments. A
hydrologic information system consists of a hydrologic
information database coupled with tools for acquiring data to
fill the database and tools for analyzing, visualizing and
modeling the data contained within it.
This GIS portal (http://gisserver.civil.iitd.ac.in), for the
general user, exposes Web Mapping Application for accessing
Hydrological Information and Web based Interface
applications based on the SWAT Modeling.
2. IJRET: International Journal of Research in Engineering and Technology eISSN: 2319-1163 | pISSN: 2321-7308
__________________________________________________________________________________________
IC-RICE Conference Issue | Nov-2013, Available @ http://www.ijret.org 418
2. MAJOR ELEMENTS OF THE FRAMEWORK
The steps taken in the development of framework for water
resource information system include: 1.Geodatabase Design
and Implementation 2. Generationof indirect information
through simulation3. Dissemination of information through
GIS server
The common framework for water resources planning and
management requires creation of base layers at different scales
so as to cater to the relevant problems at the respective scales.
However, it is imperative that all these scales should merge
through the GIS environment for aggregation and integration
to be possible. It is intended to provide this framework at the
State level and with implementation at various departments
connected with water resources. The major elements of the
framework include as show in the figure 1
Fig.1 Framework of Hydro Geodatabase
Arc Hydro data model could only meet the basic
information[6][7]. The Geodatabase was extended to capture
the information related to administrative area, Landuse, soil
feature class and non spatial data related to socio-economic.
Hydrography Dataset was also further extended to capture
some of the feature class like Dam, Canal, Water
Body,Borewell, Hydro Projects, Irrigation Scheme, Water
Supply Scheme, Sewage Treatment Plant, Industry,Rain gauge
and Monitoring Point.Dam feature class is related with non-
spatial data like Area Capacity, Water utilization, Sesimacity
of Area, Reservoir (static data), Reservoir Water level, Power
Projects. Canal feature class is related with non-spatial data
like Canal Dimension and Discharge. Borewell feature class is
related with non-spatial data like Discharge, Groundwater
Table and Water Quality Parameter. Sewage treatment plant
feature class is related with non-spatial data like
sewagetreatment plant discharge. Water treatment plant
feature class is related Water Quality Parameters and Pump
Station.
Drainage Line and Area Dataset consist of Basin,Catchment,
Sub-Catchment, Watershed and drainage line. Administrative
Dataset consist of feature class like State, District, Tehsil, and
Village. Landuse and Soil dataset contains Landuse and Soil
feature class.
Other non-spatial data like Demography, Livestock data are
collected from village and aggregated up to district level.
Irrigated Area, Agriculture Area, Crop, Fertilizer, and
Pesticide data are collected at the district level.
3. GIS SERVER
In different line departments it is a real challenge to minimize
redundancy while ensuring that the right data is accessible in a
timely and efficient manner. With hundreds of remote offices
and thousands of internal and external GIS users at different
levels of expertise and needs, it is important to overcome
multiple barriers while designing enterprise GIS [9].
One solution is to implement a server-based GIS that could
cope with all the above desired attributes[10]. The aggregation
of information should be done at central place by placing a
GIS server and database server for the purpose. Server-based
GIS can be defined as centrally hosted GIS computing.
Internal GIS capabilities are shared with users in the
department network while a Web-based platform is also
maintained for external users.[11] GIS users are connected to
the central GIS servers using desktop GIS software, Web
browsers, and custom applications as depicted in Figure 2.
4. WEB INTERFACE FOR WATER RESOUCES
APPLICATIONS
In the present study the Hydro Geodatabase has been
implemented on Himachal Pradesh state as a case. The
principal departments that are responsible for water resources
development in Himachal Pradesh for various purposes are the
Irrigation and Public Health Department (IPH), Agriculture
Department, Rural Development Department (RD), Forest
Department (FD).
A wide range of applications relevant for the planning and
management of water resources is demonstrated using this
framework built at the macro level as well as some patches
developed at the larger scales. This web portal can be accessed
by the request of the URL http://gisserver.civil.iitd.ac.in
4.1 IPH Department
As part of the demonstration, information from the IPH
department pertaining to their activities was incorporated in
the Web based GIS portal. The figure 3 shows Web based
Mapping Application on the irrigation schemes being operated
by IPH department in respective village. It shows the
Watershed boundary, drainage line, Irrigation scheme location
3. IJRET: International Journal of Research in Engineering and Technology eISSN: 2319-1163 | pISSN: 2321-7308
__________________________________________________________________________________________
IC-RICE Conference Issue | Nov-2013, Available @ http://www.ijret.org 419
feature class are overlaid over village boundary. By using
identify button on the Irrigation scheme location, along with
the attribute data of this feature class, it possible to obtain the
attribute data of all the feature class below it. This helps the
user to get the detail information about the irrigation scheme,
on which watershed the scheme is operating and the
beneficiary village with population. Similarly many such
applications can be demonstrated using this frame work
.
Fig.2 Enterprise Wide Application Configuration
Fig. 3 Information of the Irrigation Schemes operated in the state by IPH
5. MODEL BASE TO HYDRO GEODATABASE
Arc Hydro data model structure could not support the SWAT
model output which was essential for the present study. The
Arc Hydro data model was further extended to support SWAT
model output. The details of this development are out of scope
of this paper.
5.1 SWAT Model
The Soil and Water Assessment tool (SWAT) [2] is a
continuous-time, spatially distributed simulator of water,
sediment, nutrients and pesticides transport at a catchment
scale. It runs on a daily time step. In SWAT, a basin is divided
into a number of watersheds. Within each watershed, Soil and
Landuse maps are overlaid to create a number of unique
4. IJRET: International Journal of Research in Engineering and Technology eISSN: 2319-1163 | pISSN: 2321-7308
__________________________________________________________________________________________
IC-RICE Conference Issue | Nov-2013, Available @ http://www.ijret.org 420
hydrologic response units(HRUs). SWAT simulates surface
and subsurface processes, accounting for snow fall and snow
melt, vadose zone processes (i.e., infiltration, evaporation,
plant uptake, lateral flows and percolation into aquifer).
Runoff volume is calculated using the Curve Number method.
Sediment yield from each sub-basin is generated using the
Modified Universal Soil Loss Equation (MUSLE) [13]. The
model updates the C factor of the MUSLE on a daily basis
using information from the crop growth module. The routing
phase controls the movement of water using the variable
storage method or the Muskingum method[3],[4].
6. CASE STUDY
Indus River in north India is selected for the present study.
The model set-up and runs were performed using SWAT
hydrological model. The GIS interface of this model
ArcSWAT provides an excellent platform for data
management and result analysis. In the present study, two
futuristic climate scenarios A2 and B2, and one baseline
scenario BL has been used to address the uncertainty issues.
Regional scale datasets used for model set-up were: land-use
from global land cover fraction, soil from FAO and terrain
model from SRTM.Primarily the water yield and
evapotranspiration component of water balance were modeled
for each of the sub-catchment. The modeled flow at the sub-
catchment outlets were also evaluated for the various
scenarios. To induce a level of confidence in the generated
results, the basin was modeled using Indian Meteorological
Department (IMD) gridded precipitation and temperature
datasets. A good comparison was found between the baseline
scenario (BL) results and observed dataset (IMD) results. This
investigation would provide a good basis for selecting
appropriate adaptation strategies to cater to the climate change
impacts.
SWAT model version 2.1.3 is run on the desktop system,
using the ArcGIS interface and the model results of Subbasin;
Reach for monthly and daily time step was imported to
Hydrological Information System (HIS) Geodatabase.
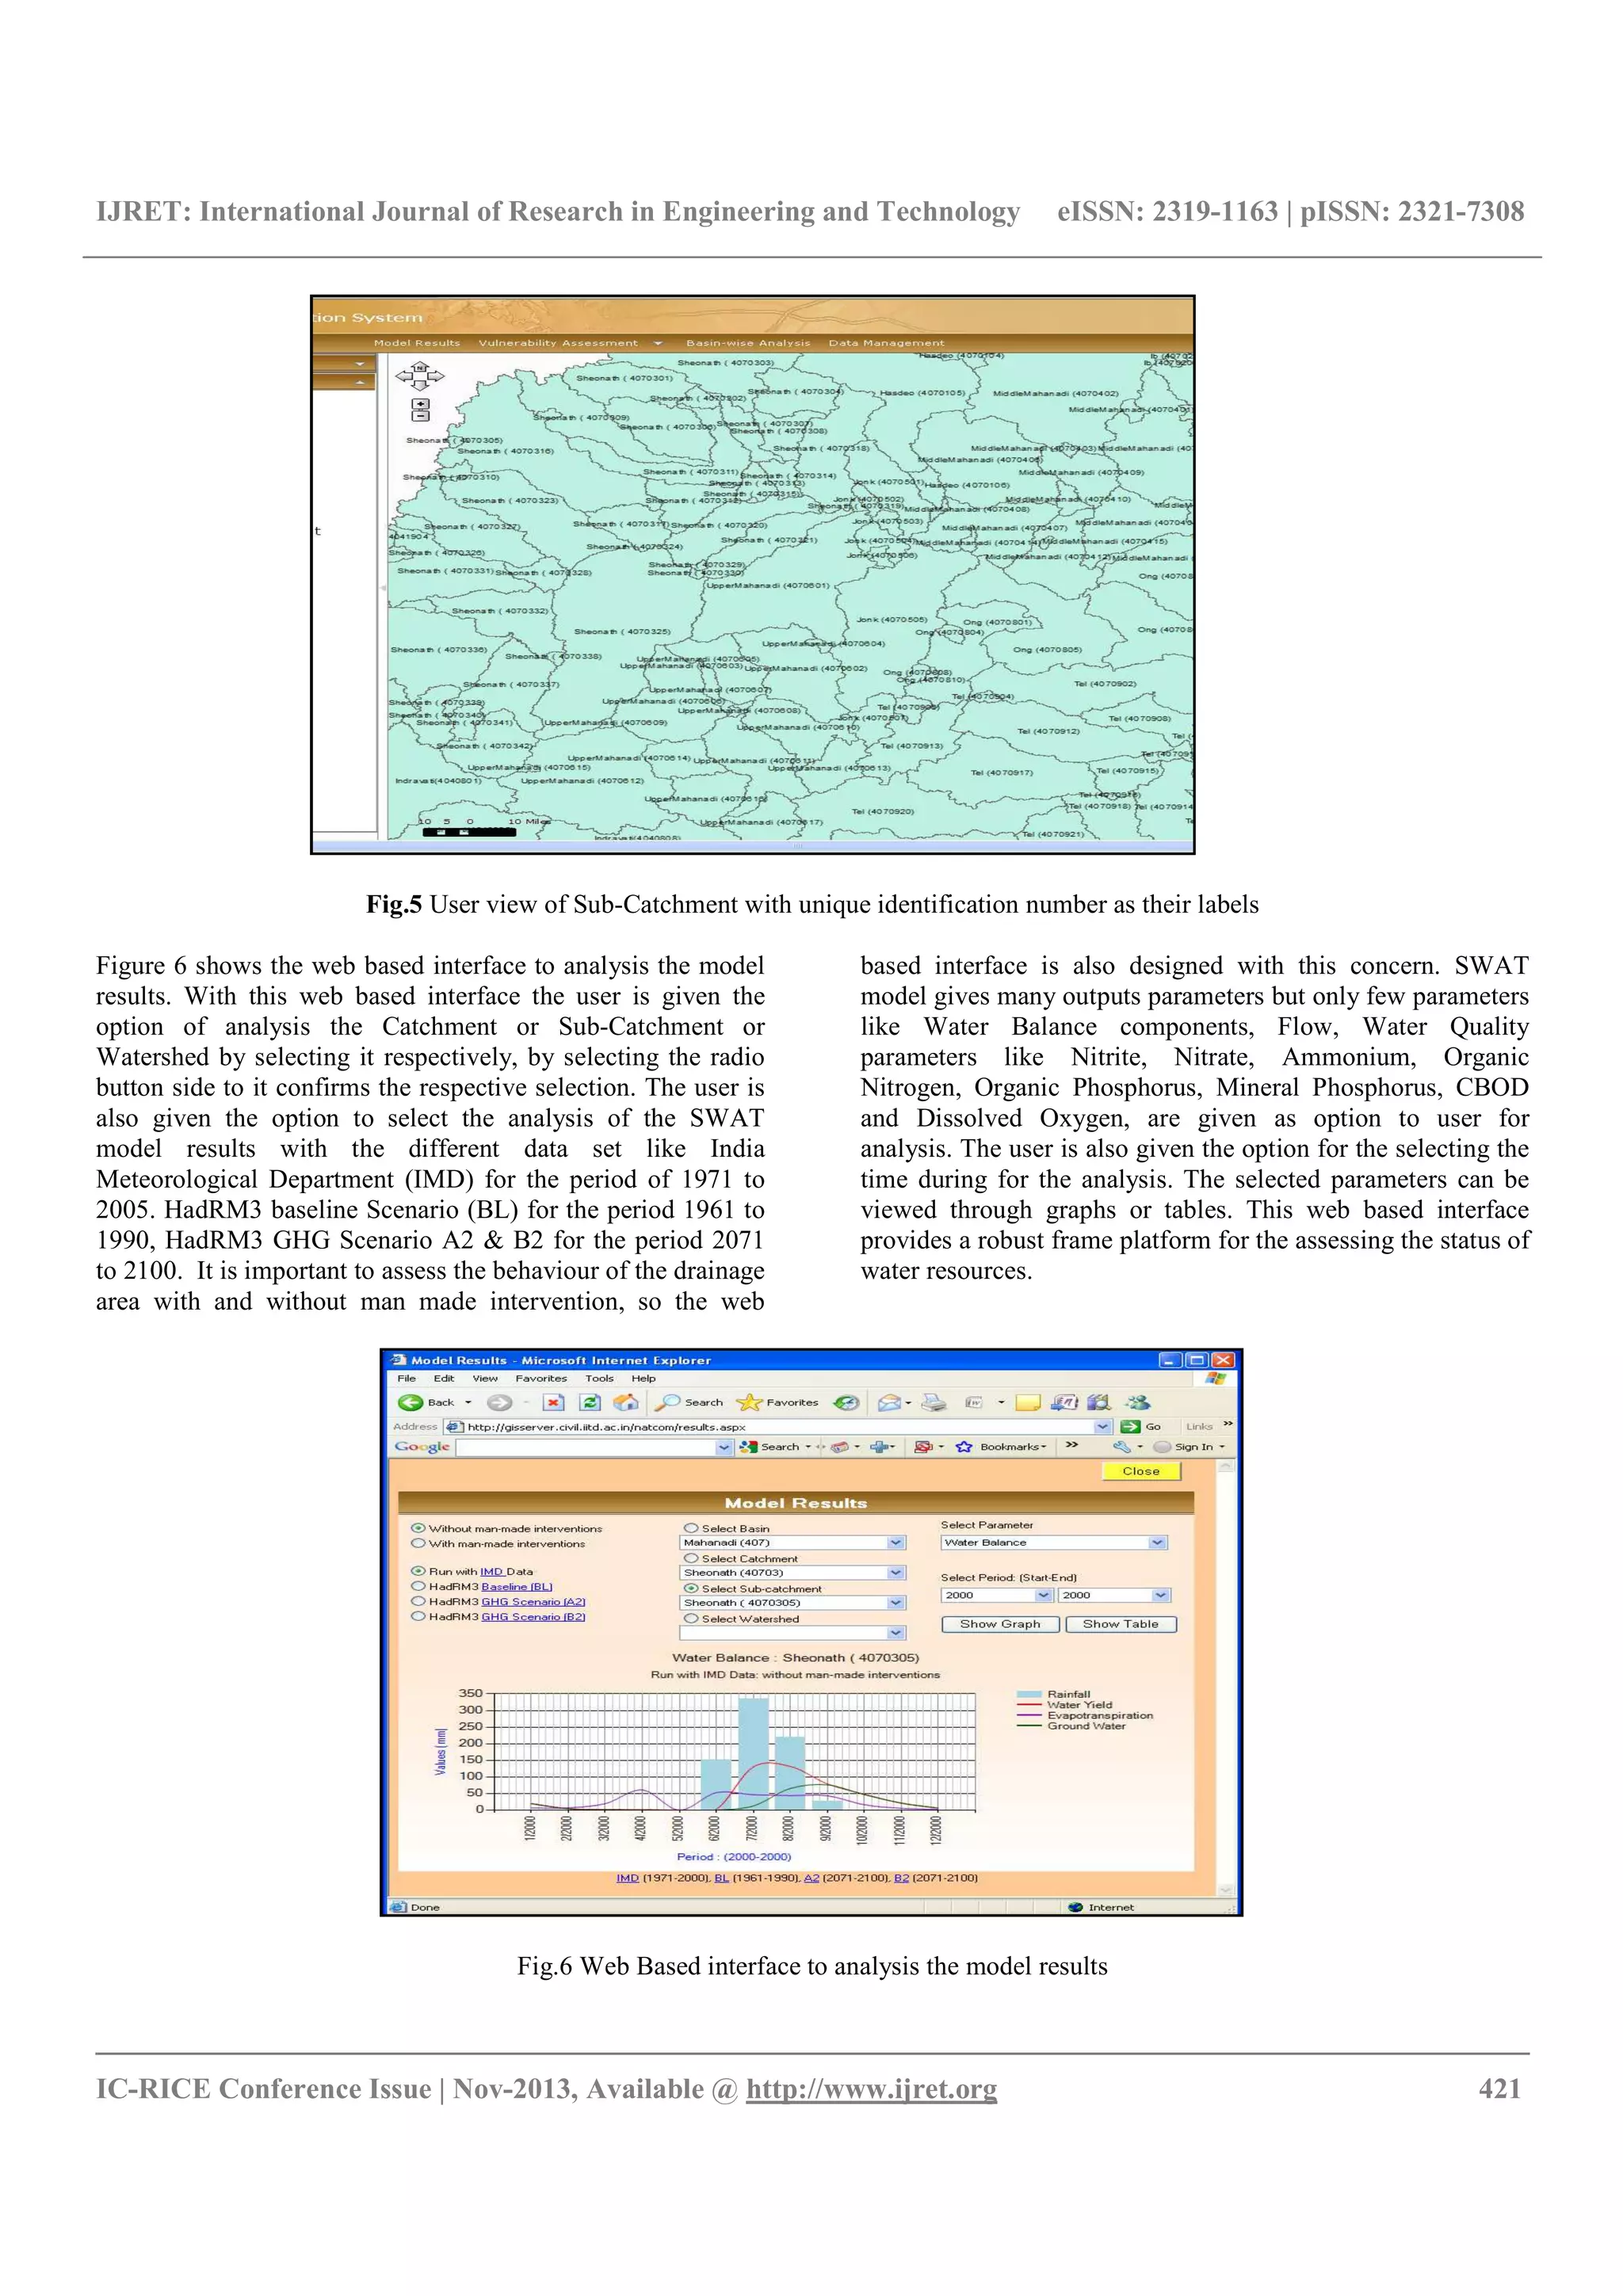
7. WEB BASE GIS INTERFACE FOR ANALYSIS
OF MODEL RESULTS
The web based Interface starts by the request of the URL
http://gisserver.civil.iitd.ac.in/natcom. This interface was
developed for viewing the model results of the respective Sub-
Catchment. Figure 4 shows the user view of Indus basin. The
user can zoom in further to view the catchment, sub-catchment
and to the watershed level. The standardization of this
drainage area was done by giving the unique identification
number at different levels. These unique identification number
along with sub-catchment name where used as reference for
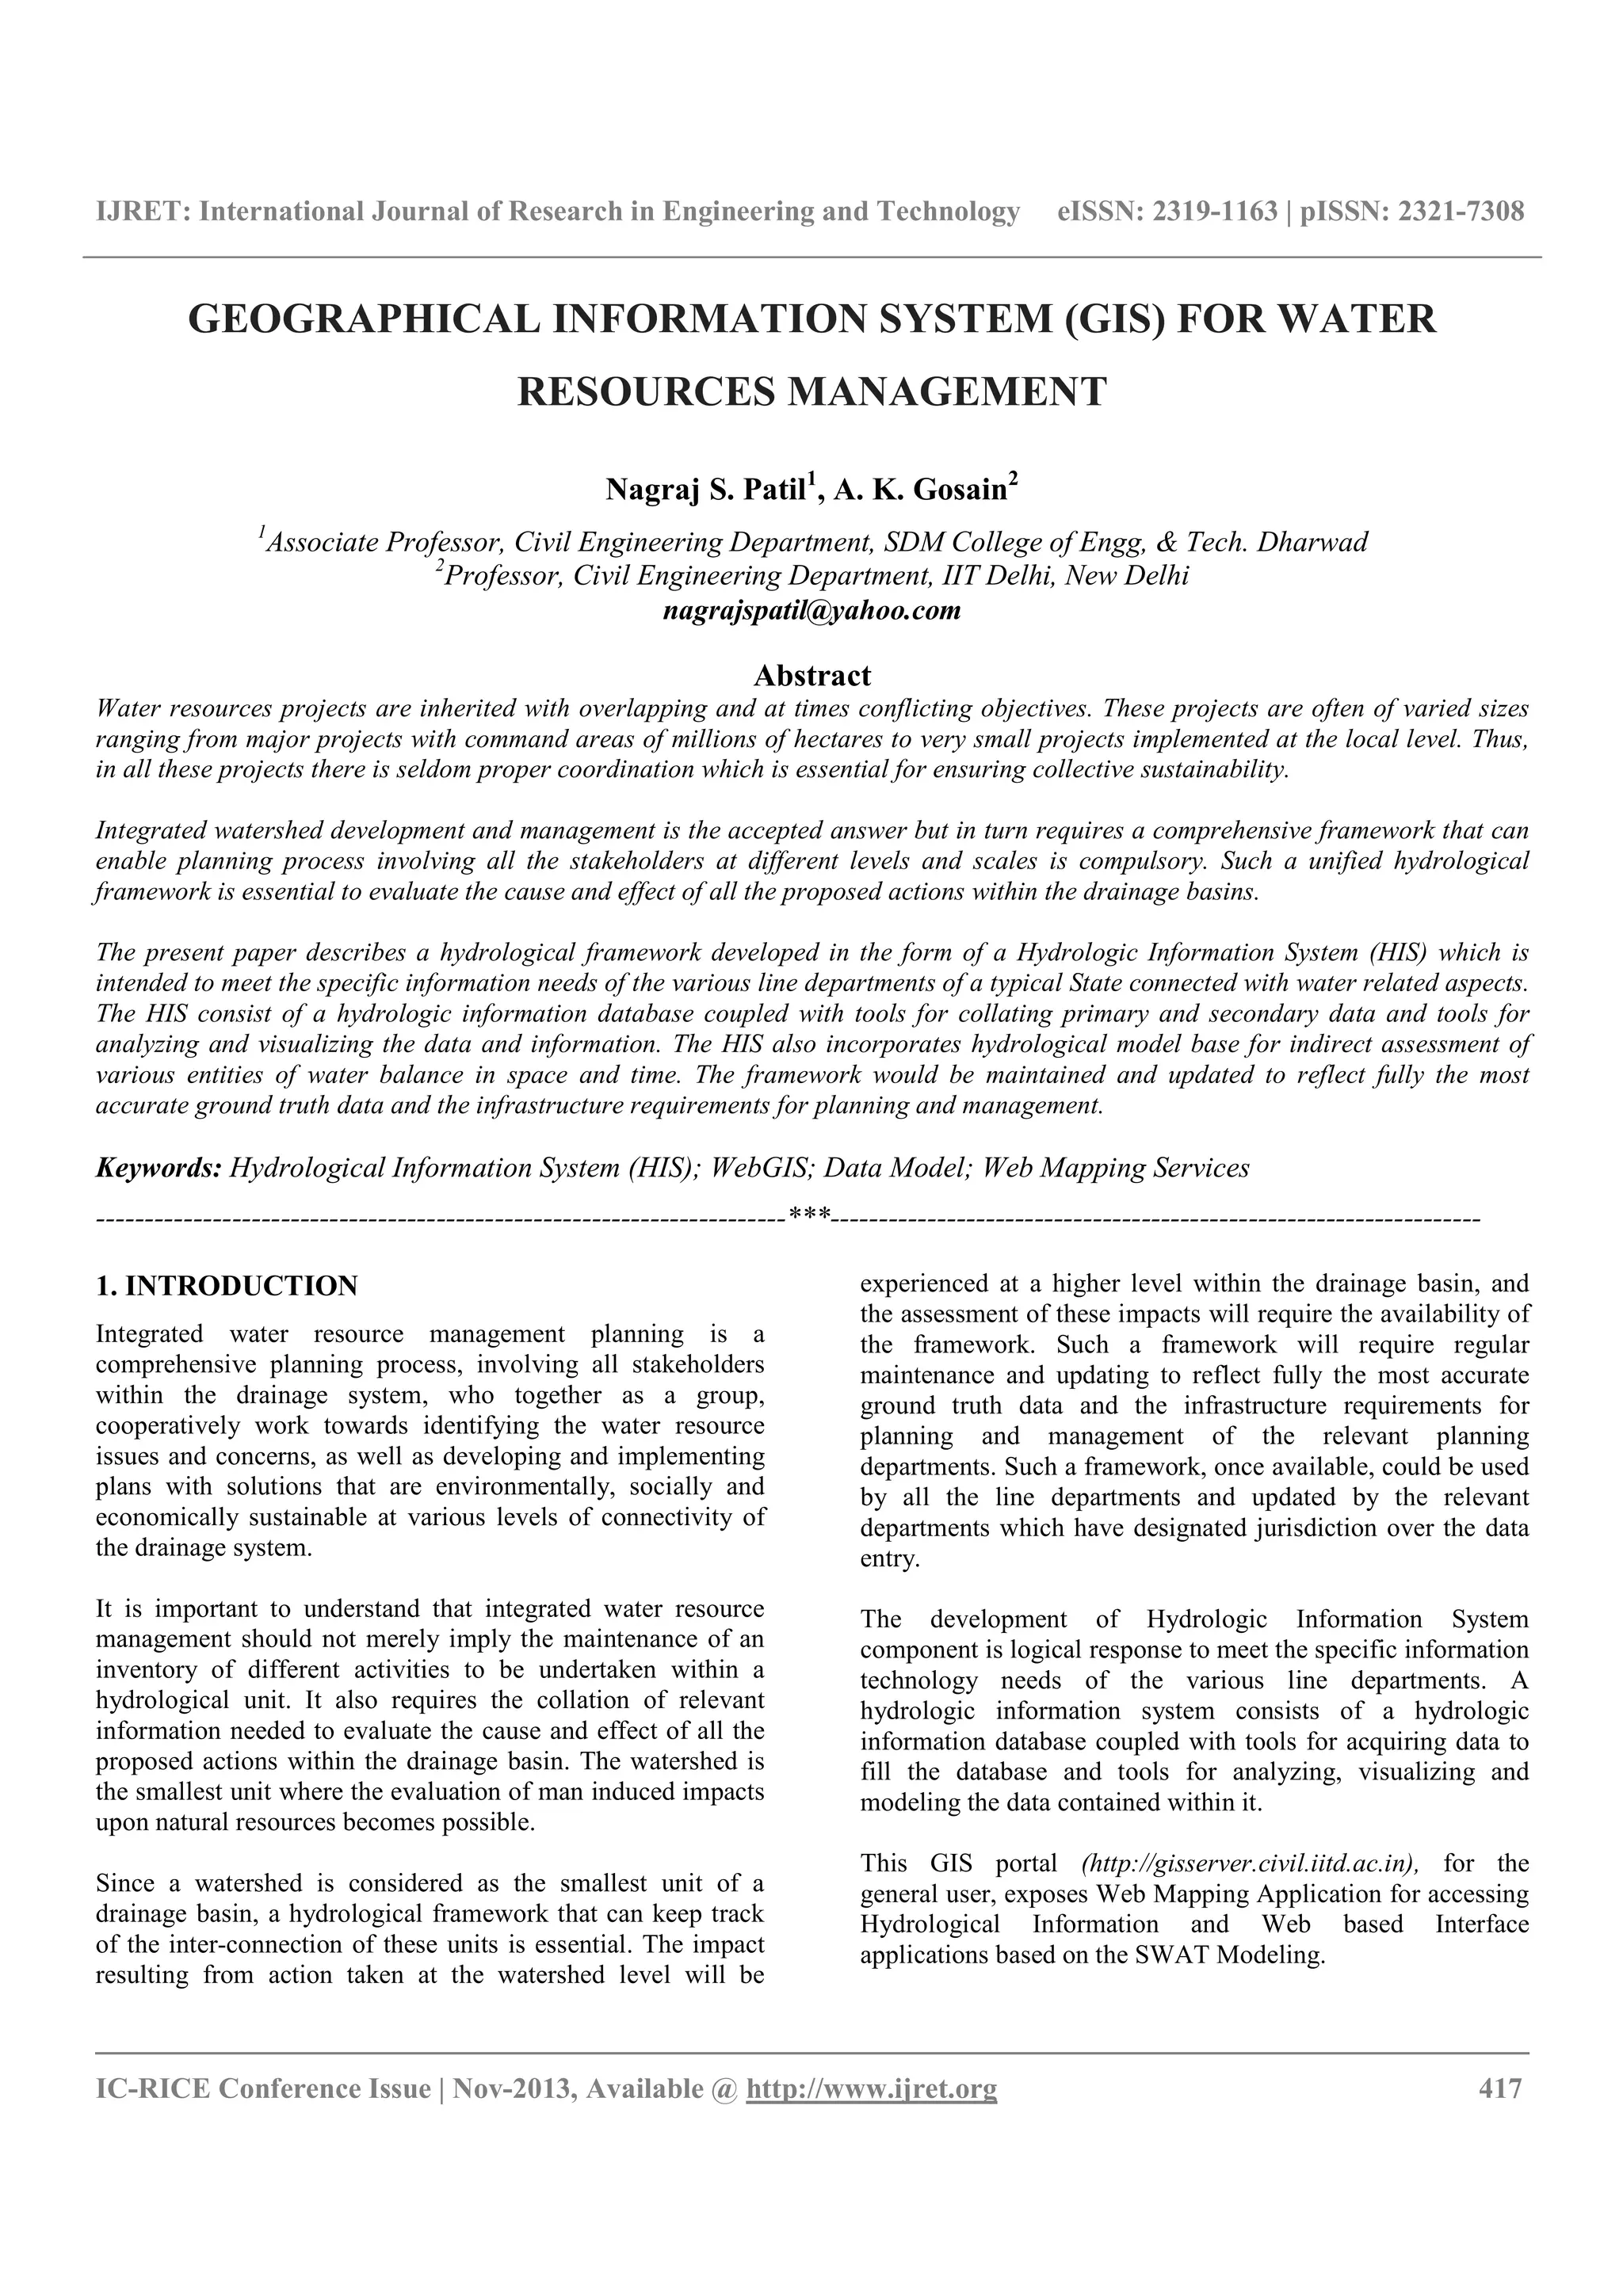
further analysis. Figure 5 shows the Web Mapping services of
sub-catchment with unique identification number as their
labels.
Fig. 4 User view of Indus basin
5. IJRET: International Journal of Research in Engineering and Technology eISSN: 2319-1163 | pISSN: 2321-7308
__________________________________________________________________________________________
IC-RICE Conference Issue | Nov-2013, Available @ http://www.ijret.org 421
Fig.5 User view of Sub-Catchment with unique identification number as their labels
Figure 6 shows the web based interface to analysis the model
results. With this web based interface the user is given the
option of analysis the Catchment or Sub-Catchment or
Watershed by selecting it respectively, by selecting the radio
button side to it confirms the respective selection. The user is
also given the option to select the analysis of the SWAT
model results with the different data set like India
Meteorological Department (IMD) for the period of 1971 to
2005. HadRM3 baseline Scenario (BL) for the period 1961 to
1990, HadRM3 GHG Scenario A2 & B2 for the period 2071
to 2100. It is important to assess the behaviour of the drainage
area with and without man made intervention, so the web
based interface is also designed with this concern. SWAT
model gives many outputs parameters but only few parameters
like Water Balance components, Flow, Water Quality
parameters like Nitrite, Nitrate, Ammonium, Organic
Nitrogen, Organic Phosphorus, Mineral Phosphorus, CBOD
and Dissolved Oxygen, are given as option to user for
analysis. The user is also given the option for the selecting the
time during for the analysis. The selected parameters can be
viewed through graphs or tables. This web based interface
provides a robust frame platform for the assessing the status of
water resources.
Fig.6 Web Based interface to analysis the model results
6. IJRET: International Journal of Research in Engineering and Technology eISSN: 2319-1163 | pISSN: 2321-7308
__________________________________________________________________________________________
IC-RICE Conference Issue | Nov-2013, Available @ http://www.ijret.org 422
CONCLUSIONS
The development of a Geospatial Web Portal is proposed as
the best solution to Hydrological Information and Data
Management. The Web Portal built around a hydrological data
model synthesizes data from diverse sources describing the
water resource, provides visualization tools and link to
externally modeled results. This Geospatial Web Portal would
provide a robust platform for the planning, execution and
monitoring of status of water resources.
REFERENCES
[1]. M.B. Abbott andA.W.Minns (1998), “Computational
hydraulics” (2nd
Ed.), AshgatePress,Aldershot, 557p.
[2]. J.G.Arnold R.Srinivasan, R.S.Muttiah, J.R.Williams 1998.
Large area hydrologic modeling and assessment- Part 1:
Model development. Journal of the American Water
Resources Association 34(1),73-89.
[3]. V.T. Chow,D.R. Maidment,L.W.Mays (1988). Applied
Hydrology. McGraw-Hill, New Delhi4. J.A.York
Cunge(1969). On the subject of a flood propagation method
(Muskingum Method). Journal of Hydraulics Research 7(2),
205-230.
[4]. J.A.Cunge(1969). On the subject of a flood propagation
method (Muskingum Method).Journal of Hydraulics Research
7(2), 205-230.
[5]. W.G.Gray, ,A.Leijnse, R.L.Kollar. C.A. Blain (1993),
“Mathematical tools for changing spatial scales in the analysis
of physical system.” CRC Press, Boca Raton, FL,232p.
[6]. D.R. Maidment(2002) Arc Hydro: GIS for Water
Resources, ESRI Press, Redlands, Calif 203 pp.[7]. Mehdi
Mashud Khan, Angela Kneece, IshwariSivagnanam, Jared
John Shoultz(2009).
http://www.esri.com/news/arcuser/0507/dhec.html (accessed
January 17, 2013)
[8]. R.J. Naiman and R.E. Bilby (1998), (ed.) “River Ecology
and Ma nagement”, Springer, New York, 705p.
[9]. G.F.Pinder(2002), “Groundwater Modeling using
geographical information systems”, Wiley, New York, 231pp.
[10[. Spotsylvania County Government (2008). “Spotsylvania
County Enterprise-Wide Applications”
https://www.spotsylvania.va.us/emplibrary/Enterprise-
ide_Solutions.pdf (accessed May 22,2013)
[11]. D.A.Quattrochi and M.F. Goodchild (1997), “Scale and
remote sensing in GIS”, Lewis Publishers, Boca Raton, FI.
[12]. J.P.WilsonandJ.C.Gallant (2000), “Terrain analysis,
principles and applications” Wiley, New York, 479p.
[13]. J.R.Williams(1995). The EPIC model. In: Singh,
V.P.(Ed.), Computer Models of watershed Hydrology. Water
Resources Publication, Colorado, USA, pp.909-1000