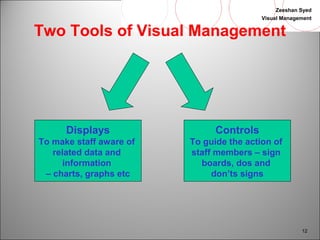
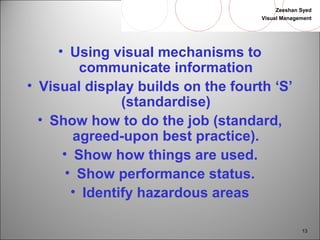
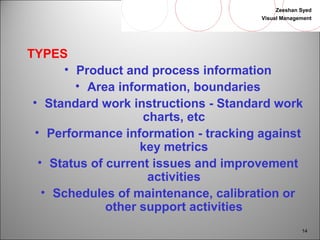
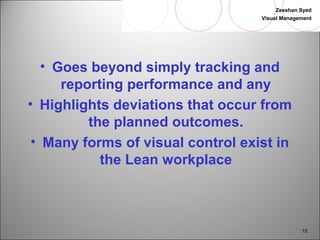
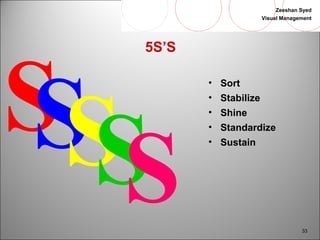
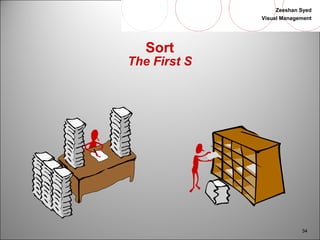
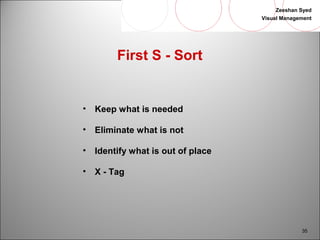
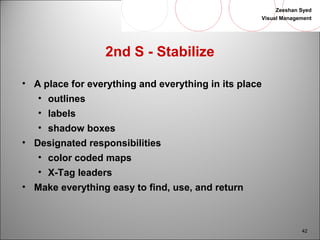
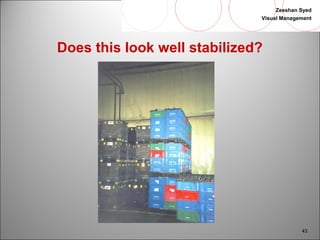
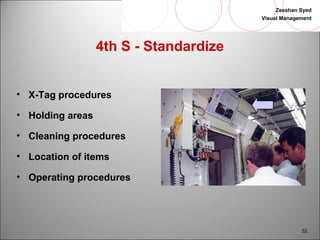
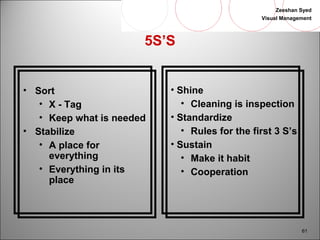
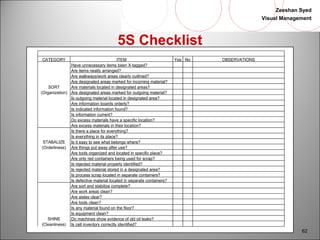
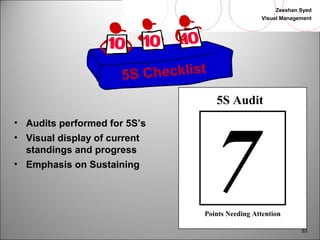
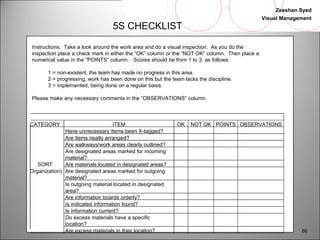
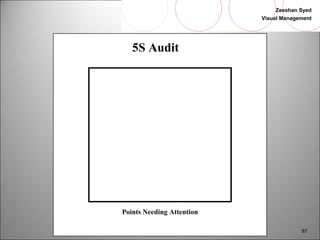
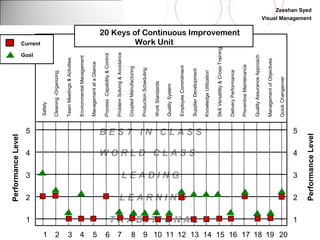
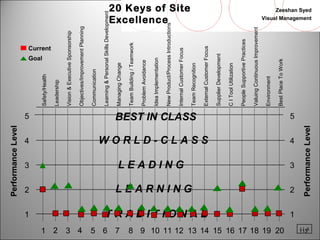
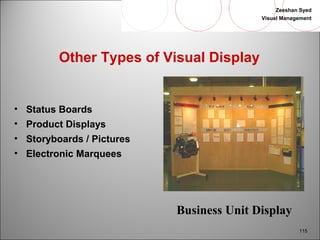
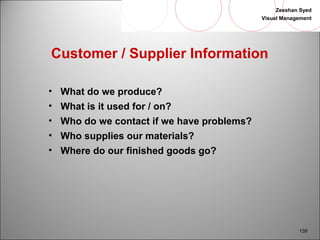
This document appears to be a presentation on visual management. It discusses the concepts of visual management and the 5S methodology for organizing the workplace. The 5S methodology involves sorting, stabilizing, shining, standardizing, and sustaining the work environment. Tools of visual management like displays and controls are highlighted to guide staff actions. Benefits of visual management include improved information sharing, worker autonomy, and continuous improvement. Checklists are provided to audit conformance to 5S principles and identify areas needing attention.
Understand the ideas, goals of Lean Visual Management & 5S. The 4 Phases to Visual Management explained by Nilesh Arora, a founder of AddValue Consulting Inc.
Visual elements in a workplace have a tremendous impact on education, morale, and productivity.
A visually dynamic workplace energizes employees, builds pride and ownership, and conveys the strength and currency of the organization.
Visual control are means, devices, or mechanisms that were designed to manage or control our operations (processes) so as to meet the following purposes:
Make the problems, abnormalities, or deviation from standards visible to everyone and thus corrective action can be taken immediately (Identification).
Display the operating or progress status in a easy to see format (Informative).
Provide instruction (Instructional).
Helps formulate and proliferate plans (Planning).
It is about the visual management in an organization. This presentation contains introduction part, Importance, Benefits, Process, Different phases, tools and techniques of a visual management system.
Visual Management: Leading with what you can seeRenee Troughton
Produced and presented by Craig Smith and Renee Troughton at the Agile Australia 2013 20 June.
Using task boards or story walls is a key Agile practice, but are you making the most of it? Visual Management is more than just putting cards on a wall, it is a growing style of management that focuses on managing work only by what you can see rather than reports or paper being shuffled around. Visual Management allows you to understand the constraints in the system, mitigate risks before they become issues, report on progress from the micro to the macro. Visual Management can also be used to demonstrate to customers and clients where the work they care about is at. This presentation is all about taking the management of your work to the next stage of transparency.
Discover:
How to identify when your story wall isn't telling you everything and how to adjust it
* What the three different types of story walls are and which one is more suitable to certain circumstances
* Different ways to visualise your product backlog
Why queue columns and limiting work in progress is so important regardless of whether you are using Scrum or Kanban
* How symbols and tokens can be used to give more information
* What else can you use other than story walls to visualise information
* How to ingrain Visual Management into both the team and management structures of your organisation
* Visualising Your Quality, Testing and Team
* What is systemic flow mapping and why is it important
Visual management is an integral part of a Lean management system. Visual management uses displays, metrics and controls to help establish and maintain continuous flow, and giving everyone a view of the work along the value stream. It includes a set of techniques that make operation standards visible so that people can follow them more easily. These techniques expose waste so that it can be prevented and eliminated.
LEARNING OBJECTIVES:
1. Understand that visual management is an integral part of Lean transformation
2. Familiarize with the common visual tools such as red tagging, activity boards, A3 storyboards, mistake-proofing, one-point lessons, standard work, kanban, etc.
3. Gain knowledge on how to apply visual tools to add structure and stability to operations, reducing variation and increasing efficiency
CONTENTS:
Introduction
5S - The foundation for a visual workplace
Types of visual management
Visual displays
Visual metrics
Visual controls
Mistake-proofing
Andons
Warning sensors
Common visual tools
Red tagging
Activity board
A3 storyboard
One-point lesson
Standard work chart
Takt time versus actual
Kanban
To download this complete presentation, please visit: http://www.oeconsulting.com.sg
Visual Factory is a concept focused on the visual perception.
Purpose = replace texts by communicating via “visual signals”:
- in work instructions and checklists (pictures of the equipment with control points)
- with local signage: tags, labels (what to measure, range, …), pictures
Benefits:
- quick and easy instructions
- reductions in injuries and strain
- increased efficiency and reactivity
- reduction of the variability and the non-conformity rate
- decreased training time…
Lean Standard or Standardized Work Training ModuleFrank-G. Adler
The Lean Standard Work Training Module v3.0 includes:
1. MS PowerPoint Presentation including 66 slides covering the History of Lean Manufacturing, Five Lean Principles, The Seven Lean Wastes, Introduction to Lean Standard Work (Introduction, Objectives, Benefits), Basic Requirements of Lean Standard Work, Step-by-Step Process using the Four Lean Standard Work Worksheets & Examples, Takt & Cycle Time, Work Balancing, Quick Changeovers, and Kanban Solutions.
2. MS Excel Process Study Worksheet Template
3. MS Excel Process Capacity Worksheet Template & Example
4. MS Excel Work Chart Template & Example
5. MS Excel Work Combination Table Template & Examples
To become a Lean enterprise, office activities must fully support shop-floor manufacturing operations to eliminate waste. The adoption of 5S throughout all office functions is the first step to increase efficiency.
This presentation provides a blueprint for building a Lean foundation for your office. You will learn how to mobilize and align your management team to launch or improve 5S in your office. The presentation covers 5S and Visual Management key concepts, best practices, step-by-step implementation guidance, and how to kick-start 5S in your organization to achieve sustainable world-class excellence.
LEARNING OBJECTIVES:
1. Understand the benefits of working in a clean and neat environment
2. Identify waste in the office
3. Define the 5S principles, and identify visual tools
4. Explain how to apply the 5S principles and visual tools to enhance office organization
5. Learn how to kick start a 5S initiative
6. Define the critical success factors for 5S implementation
CONTENTS:
Introduction & Overview
5S Lays the Foundation for a Lean Enterprise
5S Helps to Eliminate Waste
What is 5S?
Benefits of 5S
5S Principles - Step by Step
How to Conduct a Red Tagging Exercise
Creating a Visual Office
5S Applications
5S Implementation
Starting & Launching a 5S Initiative
5S Audit System & Maturity Levels
5S & Kaizen
Supporting Lean Tools for 5S
Critical Success Factors
To download this complete presentation, please go to: http://www.oeconsulting.com.sg
5S Implementation - The first step to continuous improvementAdrian Oprea
Implementing 5S results in obvious improvements within the application area, plus, or even more importantly, in the change of people’s attitude towards their work and towards what they are doing.
5S implementation is the first steps to increase the efficiency in your company and the base for the future improvements.
5S basic training ppt
http://smartmanagement.info/download-category/5s-forms/
5S represents 5 disciplines for maintaining a visual workplace (visual controls and information systems).
These are foundational to Kaizen (continuous improvement) and a manufacturing strategy based "Lean Manufacturing" (waste removing) concepts.
5S is one of the activities that will help ensure our company’s survival.
Training slides for 5S Awareness & Implementation. (NOT for Practical 5S: Uplift Company Image by Increasing Quality & Productivity Training).
This is one day training. Normally conducted on Saturday. To join the training, please send email to training@myanuar.com
Hand in hand with 5S implementation is creating Visual Factory. Use of signage, demarcation lines, quality inspection points, easy to ready guages and dials
Issues with communication are commonly stressed as one of pain points in project teams. We often react trying to formalize communication setting a lot of rules and expecting it would solve the problem. Unfortunately it doesn't really work.
It because the real reason isn't lack of will to share information among a project team but burden attached to it. If we were able to make communication easy and nonintrusive for both those who share and those who receive information it would be a great tool to improve information flow and, as a result, organization as well.
And this is where visual management comes to the rescue. A set of simple tools: whiteboard, markers and a set of sticky notes can help to solve many of communication issues we face. What more flexibility and cost of such simple means is no match for any software, which makes them a perfect investment. Are you ready to pass on such a powerful tool?
The presentation will show a set of different real-life problems pointing how visual management can help in solving them. The session will also describe why and when the method works successfully.
5S is one of the basic tools in lean, six sigma, continuous improvement and operational excellence. It works everywhere and applies to all kinds of industries. This presentation is one of many presentations that we are working on. These will be helpful for any organization looking to leverage its resources and taking the journey of operational excellence.
5S - A step-by-step approach to implement 5S at your workplaceAnanth Palaniappan
This document "A step-by-step approach to implement 5S at your workplace" is a part of the training material we provide to our clients. This is specifically about the implementation of 5S at your workplace.
A presentation on The Kaizen Pholosophy, a well known workplace management philosophy originated in Japan.
The application of this philosophy has led to the success of several companies like Toyota and Canon.
The 5S workplace organization system applies a set of basic management principles that many companies widely adopt to maximize productivity and organization. As a cornerstone of Lean management, 5S improves workplace morale, safety and efficiency.
In this training presentation, you will learn how to mobilize and align your management team to launch or improve a 5S and Visual Management implementation in your organization. The presentation covers 5S and Visual Management best practices, step-by-step implementation guidance, and the best ways to integrate lean 5S into the organization's culture to achieve sustainable world-class excellence.
LEARNING OBJECTIVES
1. Understand the benefits of working in a clean and neat environment
2. Define the 5S principles, and identify visual tools
3. Explain how to apply the 5S principles and visual tools to enhance workplace organization
4. Learn how to kick start and launch a 5S initiative
5. Define the critical success factors for 5S implementation
CONTENTS
Introduction & Overview
5S Lays the Foundation for a Lean Enterprise
5S Establishes a Baseline for Kaizen Activities
5S as a Cornerstone of Employee Engagement
5S Helps to Eliminate Waste
What is 5S?
What is the Purpose of 5S?
Benefits of 5S
5S Principles - Step by Step
How to Conduct a Red Tagging Exercise
5S Visual Management
5S Applications
5S Implementation
Starting & Launching 5S
5S Audit System & Maturity Levels
Supporting Lean Tools for 5S
Critical Success Factors
To download this complete presentation, please go to: http://www.oeconsulting.com.sg
By the end of the module, one can:
1.) Define and understand the importance of the 5s method
2.) Identify and overcome the barriers to productivity
3.) Improve QUALITY of work
4.) Practice efficiency at all times
Harnessing The Power of 5S and Visual Management with GoLeanSixSigma.comGoLeanSixSigma.com
Watch this free 1-hour webinar, and you’ll learn how to use powerful visual management tools to promote positive change in your organization.
You can find the rest of the webinar materials and questions from the webinar here: https://goleansixsigma.com/webinar-harness-power-5s-visual-management/
Continual Process improvement is a challenge in any model or framework namely COBIT5, ITIL or even in ISO standards. Kaize being a Lean/ Six Sigma tool can play very vital role for any organization.
Scaling Dimensions - Scaling is more than adding people to a product teamChristoph Mathis
Scaling Agile is surprisingly hard. There are good reasons why agile implementations remained dedicated to small co-located teams.
The presentation outlines some of these reaseons and derives cautonary rules when considerung using agile in the large.
Fixing the Foundations of Your Lean House in an Uncertain EconomySafetyChain Software
Learn the foundational Lean pillars manufacturers commonly miss and why, where to find waste in current processes, and how to improve without straining resources.
Presented by: Michael Parent, a Six Sigma Master Black Belt
Watch the webinar replay here: https://info.safetychain.com/fix-lean-foundation
Innovation in veterinary practice is vital for future success. All veterinary practices must seek new technologies to empower customers. Learn successful techniques to implement innovation in your veterinary practice. Your veterinary practice must develop a culture of innovation!
Similar to "Visual management & 5S " in Lean T.P.S (Workshop slides) (20)
Basics of Lean manufacturing by Zeeshan SyedZeeshan Syed
Basic awareness of Lean Manufacturing or Toyota Production System.
Most profitable companies use this Business system to sustain effective economic performance such as Toyota & GE.
Author is a Certified Lean Professional.
What Exactly Is The Common Rail Direct Injection System & How Does It WorkMotor Cars International
Learn about Common Rail Direct Injection (CRDi) - the revolutionary technology that has made diesel engines more efficient. Explore its workings, advantages like enhanced fuel efficiency and increased power output, along with drawbacks such as complexity and higher initial cost. Compare CRDi with traditional diesel engines and discover why it's the preferred choice for modern engines.
Why Is Your BMW X3 Hood Not Responding To Release CommandsDart Auto
Experiencing difficulty opening your BMW X3's hood? This guide explores potential issues like mechanical obstruction, hood release mechanism failure, electrical problems, and emergency release malfunctions. Troubleshooting tips include basic checks, clearing obstructions, applying pressure, and using the emergency release.
What Does the Active Steering Malfunction Warning Mean for Your BMWTanner Motors
Discover the reasons why your BMW’s Active Steering malfunction warning might come on. From electrical glitches to mechanical failures and software anomalies, addressing these promptly with professional inspection and maintenance ensures continued safety and performance on the road, maintaining the integrity of your driving experience.
What Does the PARKTRONIC Inoperative, See Owner's Manual Message Mean for You...Autohaus Service and Sales
Learn what "PARKTRONIC Inoperative, See Owner's Manual" means for your Mercedes-Benz. This message indicates a malfunction in the parking assistance system, potentially due to sensor issues or electrical faults. Prompt attention is crucial to ensure safety and functionality. Follow steps outlined for diagnosis and repair in the owner's manual.
𝘼𝙣𝙩𝙞𝙦𝙪𝙚 𝙋𝙡𝙖𝙨𝙩𝙞𝙘 𝙏𝙧𝙖𝙙𝙚𝙧𝙨 𝙞𝙨 𝙫𝙚𝙧𝙮 𝙛𝙖𝙢𝙤𝙪𝙨 𝙛𝙤𝙧 𝙢𝙖𝙣𝙪𝙛𝙖𝙘𝙩𝙪𝙧𝙞𝙣𝙜 𝙩𝙝𝙚𝙞𝙧 𝙥𝙧𝙤𝙙𝙪𝙘𝙩𝙨. 𝙒𝙚 𝙝𝙖𝙫𝙚 𝙖𝙡𝙡 𝙩𝙝𝙚 𝙥𝙡𝙖𝙨𝙩𝙞𝙘 𝙜𝙧𝙖𝙣𝙪𝙡𝙚𝙨 𝙪𝙨𝙚𝙙 𝙞𝙣 𝙖𝙪𝙩𝙤𝙢𝙤𝙩𝙞𝙫𝙚 𝙖𝙣𝙙 𝙖𝙪𝙩𝙤 𝙥𝙖𝙧𝙩𝙨 𝙖𝙣𝙙 𝙖𝙡𝙡 𝙩𝙝𝙚 𝙛𝙖𝙢𝙤𝙪𝙨 𝙘𝙤𝙢𝙥𝙖𝙣𝙞𝙚𝙨 𝙗𝙪𝙮 𝙩𝙝𝙚 𝙜𝙧𝙖𝙣𝙪𝙡𝙚𝙨 𝙛𝙧𝙤𝙢 𝙪𝙨.
Over the 10 years, we have gained a strong foothold in the market due to our range's high quality, competitive prices, and time-lined delivery schedules.
Symptoms like intermittent starting and key recognition errors signal potential problems with your Mercedes’ EIS. Use diagnostic steps like error code checks and spare key tests. Professional diagnosis and solutions like EIS replacement ensure safe driving. Consult a qualified technician for accurate diagnosis and repair.
Core technology of Hyundai Motor Group's EV platform 'E-GMP'Hyundai Motor Group
What’s the force behind Hyundai Motor Group's EV performance and quality?
Maximized driving performance and quick charging time through high-density battery pack and fast charging technology and applicable to various vehicle types!
Discover more about Hyundai Motor Group’s EV platform ‘E-GMP’!
Comprehensive program for Agricultural Finance, the Automotive Sector, and Empowerment . We will define the full scope and provide a detailed two-week plan for identifying strategic partners in each area within Limpopo, including target areas.:
1. Agricultural : Supporting Primary and Secondary Agriculture
• Scope: Provide support solutions to enhance agricultural productivity and sustainability.
• Target Areas: Polokwane, Tzaneen, Thohoyandou, Makhado, and Giyani.
2. Automotive Sector: Partnerships with Mechanics and Panel Beater Shops
• Scope: Develop collaborations with automotive service providers to improve service quality and business operations.
• Target Areas: Polokwane, Lephalale, Mokopane, Phalaborwa, and Bela-Bela.
3. Empowerment : Focusing on Women Empowerment
• Scope: Provide business support support and training to women-owned businesses, promoting economic inclusion.
• Target Areas: Polokwane, Thohoyandou, Musina, Burgersfort, and Louis Trichardt.
We will also prioritize Industrial Economic Zone areas and their priorities.
Sign up on https://profilesmes.online/welcome/
To be eligible:
1. You must have a registered business and operate in Limpopo
2. Generate revenue
3. Sectors : Agriculture ( primary and secondary) and Automative
Women and Youth are encouraged to apply even if you don't fall in those sectors.
Things to remember while upgrading the brakes of your carjennifermiller8137
Upgrading the brakes of your car? Keep these things in mind before doing so. Additionally, start using an OBD 2 GPS tracker so that you never miss a vehicle maintenance appointment. On top of this, a car GPS tracker will also let you master good driving habits that will let you increase the operational life of your car’s brakes.
"Trans Failsafe Prog" on your BMW X5 indicates potential transmission issues requiring immediate action. This safety feature activates in response to abnormalities like low fluid levels, leaks, faulty sensors, electrical or mechanical failures, and overheating.
In this presentation, we have discussed a very important feature of BMW X5 cars… the Comfort Access. Things that can significantly limit its functionality. And things that you can try to restore the functionality of such a convenient feature of your vehicle.
5 Warning Signs Your BMW's Intelligent Battery Sensor Needs AttentionBertini's German Motors
IBS monitors and manages your BMW’s battery performance. If it malfunctions, you will have to deal with an array of electrical issues in your vehicle. Recognize warning signs like dimming headlights, frequent battery replacements, and electrical malfunctions to address potential IBS issues promptly.
3. Zeeshan Syed
Visual Management
3
Visual Management Charter
Visual Management is promout as a workplace where
all associates understand and manage their own work
in a safe, clean, organized environment that fosters
open communication, pride, and continuous
improvement
4. Zeeshan Syed
Visual Management
4
Visual Management Goals
• Make everyone’s job easier
• Give all associates a high degree of ownership in their
work, and pride in their workplace
• Increase communication by making information easier
to understand
• Improve company overall success
5. Zeeshan Syed
Visual Management
5
Workshop Objectives
• Understand the 4 Phases leading up to Visual Management
of the Workplace
• Apply the concepts and techniques for each phase through
team exercises on the floor
• Understand how to use Visual Management and the
benefits it offers
6. Zeeshan Syed
Visual Management
6
Desired Outcome
• Create a sense of “Who we are” and “What we do”
• Employ company standards to make key processes
universally understood
• Make work decisions based on what we see
• Communicate all ways
• Make customer satisfaction visible
7. Zeeshan Syed
Visual Management
7
Brainstorming Exercise
Let’s think about things
as they are today. ..
Do we work in a visual
workplace ?
8. Zeeshan Syed
Visual Management
8
What is our current situation ?
How would you describe
your current workplace
situation?
Consider:
• Personal Safety
• Physical environment
• The processes
• Information access
Safety
W P O Process
People Data Machines
9. Zeeshan Syed
Visual Management
9
Visual Workplace Vision
Describe your
vision of what
the ideal
workplace is like
10. Zeeshan Syed
Visual Management
10
• Visual Management is a set of
techniques for creating a workplace
embracing visual communication and
control throughout the work
environment.
• The visual management philosophy is
underpinned by the view that ‘what
gets measured & displayed gets done’
• It makes it easy to understand the
processes which have been put into
place
11. Zeeshan Syed
Visual Management
11
VISION•
The work environment should be
immaculate, safe and self-cleaning
• Standards are easy to recognise and
abnormal conditions are quickly identified,
enabling speedy analysis & resolution.
• Performance and progress are readily
apparent to employees.
• Plans are in place to significantly reduce or
remove waste and defects in the process.
12. Zeeshan Syed
Visual Management
12
Two Tools of Visual Management
Displays
To make staff aware of
related data and
information
– charts, graphs etc
Controls
To guide the action of
staff members – sign
boards, dos and
don’ts signs
13. Zeeshan Syed
Visual Management
13
• Using visual mechanisms to
communicate information
• Visual display builds on the fourth ‘S’
(standardise)
• Show how to do the job (standard,
agreed-upon best practice).
• Show how things are used.
• Show performance status.
• Identify hazardous areas
14. Zeeshan Syed
Visual Management
14
TYPES
• Product and process information
• Area information, boundaries
• Standard work instructions - Standard work
charts, etc
• Performance information - tracking against
key metrics
• Status of current issues and improvement
activities
• Schedules of maintenance, calibration or
other support activities
15. Zeeshan Syed
Visual Management
15
• Goes beyond simply tracking and
reporting performance and any
• Highlights deviations that occur from
the planned outcomes.
• Many forms of visual control exist in
the Lean workplace
16. Zeeshan Syed
Visual Management
16
Basic types
• Shadow boards
• Indicators on various items e.g. gauges
• Heijunka boards – showing the status
of daily schedules
• Design pull systems (Kanban)
19. Zeeshan Syed
Visual Management
19
3 BASIC STEPS REQUIRED
• There are three basic steps:
1) Organise the workplace using 6S
2) Ensure that all required work
standards, instruction and related
information are clearly displayed in
workplace
3) Control workplace processes by
exposing and stopping errors and by
preventing future occurrences
20. Zeeshan Syed
Visual Management
20
The Visual Workplace ...
• is safe
• is clean and organized
• is easily understood
• is managed through involvement by all
• creates high quality products
• communicates progress
• generates pride
21. Zeeshan Syed
Visual Management
21
The Visual Management
Assessment Test
In the visual workplace, anyone will easily know the:
who, what, when, where, why, and how of an area
within 5 minutes
22. Zeeshan Syed
Visual Management
22
The 4 Phases to Visual Management
Visual
Management
Visual Measures
Visual Display
Workplace Organization
23. Zeeshan Syed
Visual Management
23
Workplace Standards
• Definition
Objects or practices considered to be the example or
model. Standards should be established by general
team consensus.
24. Zeeshan Syed
Visual Management
24
Why use standards ?
Workplace standards offer
these benefits:
• Universally understood
• Assure quality and consistency
• Eliminate variation
• Make abnormalities apparent
ALTO
25. Zeeshan Syed
Visual Management
25
How many of these standards are
standard in your plant ?
STANDARD
CHANGEOVER
CLOCK
26. Zeeshan Syed
Visual Management
26
How many of these standards are
standard in your plant ?
RED BOX SCRAP
27. Zeeshan Syed
Visual Management
27
How many of these standards are
standard in your plant ?
T P M
BOARD
28. Zeeshan Syed
Visual Management
28
How many of these standards are
standard in your plant ?
DOWNTIME / PRODUCTION DISPLAY
29. Zeeshan Syed
Visual Management
29
How many of these standards are
standard in your plant ?
B O S CHART
37. Zeeshan Syed
Visual Management
37
Sort
Here Is A Good Example
How can it be improved?
38. Zeeshan Syed
Visual Management
38
X-Tag
• Select a X-Tag leader
• Identify what is not needed
• Attach X-Tag
• Move to holding area
• Determine time to hold
• Move to facility holding area
• Tag all Safety problems
X-Tag
39. Zeeshan Syed
Visual Management
39
X-Tag Rule of Thumb
How often is it used? What to do with it.
• Never used
• Once or twice a year
• Once a month
• Once a week
• Once a day or more
• Give, sell, or throw away
• Store in a distant place
• Store in the facility
• Store in the area
• Keep at the workplace or carry
40. Zeeshan Syed
Visual Management
40
X-Tag
Name:
Date: Removal Date
Location:
Reason for X-Tag:
42. Zeeshan Syed
Visual Management
42
2nd S - Stabilize
• A place for everything and everything in its place
• outlines
• labels
• shadow boxes
• Designated responsibilities
• color coded maps
• X-Tag leaders
• Make everything easy to find, use, and return
57. Zeeshan Syed
Visual Management
57
5th S - Sustain
• Make it a habit
• It takes doing something 21 times before it becomes
a habit
• Proper training and communication
• Inform all employees (especially new ones)
• Support and cooperation from everyone
60. Zeeshan Syed
Visual Management
60
Sustain
Everyone needs to do their part to keep things where
and how they belong
61. Zeeshan Syed
Visual Management
61
5S’S
• Sort
• X - Tag
• Keep what is needed
• Stabilize
• A place for
everything
• Everything in its
place
• Shine
• Cleaning is inspection
• Standardize
• Rules for the first 3 S’s
• Sustain
• Make it habit
• Cooperation
62. Zeeshan Syed
Visual Management
62
5S Checklist
CATEGORY ITEM Yes No OBSERVATIONS
Have unnecessary items been X-tagged?
Are items neatly arranged?
Are walkways/work areas clearly outlined?
Are designated areas marked for incoming material?
SORT Are materials located in designated areas?
(Organization) Are designated areas marked for outgoing material?
Is outgoing material located in designated area?
Are information boards orderly?
Is indicated information found?
Is information current?
Do excess materials have a specific location?
Are excess materials in their location?
Is there a place for everything?
Is everything in its place?
STABALIZE Is it easy to see what belongs where?
(Orderliness) Are things put away after use?
Are tools organized and located in specific place?
Are only red containers being used for scrap?
Is rejected material properly identified?
Is rejected material stored in a designated area?
Is process scrap located in separate containers?
Is defective material located in separate containers?
Are sort and stabilize complete?
Are work areas clean?
Are aisles clear?
Are tools clean?
Is any material found on the floor?
Is equipment clean?
SHINE Do machines show evidence of old oil leaks?
(Cleanliness) Is cell inventory correctly identified?
63. Zeeshan Syed
Visual Management
63
5S Checklist
• Audits performed for 5S’s
• Visual display of current
standings and progress
• Emphasis on Sustaining
5S Audit
Points Needing Attention 7
64. Zeeshan Syed
Visual Management
64
5S Supportive Strategies
• Color coding
• Point of use
• Safety
65. Zeeshan Syed
Visual Management
65
Color coding things is a fast, easy way to separate different
items and to visually determine if something is misplaced
70. Zeeshan Syed
Visual Management
70
Part Color Coding
Different color for each part number
Colors correspond to colors of:
work units
tooling
gages
fixtures
settings
72. Zeeshan Syed
Visual Management
72
Point of Use
• Tools
• Parts disposal
• Operating procedures
• Lock-out instructions
• Materials/Finished goods
• Information
Looking For Tools
83. Zeeshan Syed
Visual Management
83
WPO Exercise
• 5S and WPO checklist
• X - Tag
84. Zeeshan Syed
Visual Management
84
X-Tag
Name:
Date: Removal Date
Location:
Reason for X-Tag:
85. Zeeshan Syed
Visual Management
85
X-TAG REPORT OUT
AREA STUDIED: TEAM:
DATE: PAGE: of
Name Item Quantity Reason for X-Tag Removal
Date
Cost
86. Zeeshan Syed
Visual Management
86
5S CHECKLIST
Instructions: Take a look around the work area and do a visual inspection. As you do the
inspection place a check mark in either the “OK” column or the “NOT OK” column. Then place a
numerical value in the “POINTS” column. Scores should be from 1 to 3, as follows:
1 = non-existent, the team has made no progress in this area.
2 = progressing, work has been done on this but the team lacks the discipline.
3 = implemented, being done on a regular basis.
Please make any necessary comments in the “OBSERVATIONS” column.
CATEGORY ITEM OK NOT OK POINTS OBSERVATIONS
Have unnecessary items been X-tagged?
Are items neatly arranged?
Are walkways/work areas clearly outlined?
Are designated areas marked for incoming
material?
SORT Are materials located in designated areas?
(Organization) Are designated areas marked for outgoing
material?
Is outgoing material located in designated
area?
Are information boards orderly?
Is indicated information found?
Is information current?
Do excess materials have a specific
location?
Are excess materials in their location?
90. Zeeshan Syed
Visual Management
90
How do we create Visual Management?
One phase at a time...
The 2nd Phase is Visual Display
The 1st Phase is Workplace Organization
91. Zeeshan Syed
Visual Management
91
Are we ready for Visual Display ?
Before Visual
Display...
Implement
5 S
92. Zeeshan Syed
Visual Management
92
Phase 2: Visual Display
Definition:
A method to visually
communicate
important information
in the workplace
Information regarding:
• Safety
• Quality
• Operations
• Equipment
• Work Environment
• Progress / Achievements
93. Zeeshan Syed
Visual Management
93
Benefits of Visual Display
• Makes work safer and easier
• Communicates information about performance
• Makes standards visible
• Makes problems recognizable
• Creates a shared knowledge base
94. Zeeshan Syed
Visual Management
94
Visual Display tells others…
what is important to our company.
95. Zeeshan Syed
Visual Management
95
Types of Visual Display
Begin implementing Visual Display with:
• Designated Locations
• Indicate danger; Set limits; Make work easier
• Information Boards
• Work Instructions
• Checklists
96. Zeeshan Syed
Visual Management
96
Start with Designated Locations
Designated Locations:
• Indicate danger
• Set limits
• Tell us what, where, and how
many
Designated Locations are the first type of Visual
Display to be implemented
97. Zeeshan Syed
Visual Management
97
Designated Location Example
This location is
exclusively for
fire safety
98. Zeeshan Syed
Visual Management
98
Designated Location Example
Components Kanban: What, Where, and How many
103. Zeeshan Syed
Visual Management
103
Designated Location Guidelines
• Determine appropriate location for all needed items
• Designate locations for type and correct number
(quantity) of needed items
• Post visual indicators
• Create ways to recognize at-a-glance when items are
out of place
104. Zeeshan Syed
Visual Management
Mobile cart provides designated location
104
and point of use flexibility
Could this idea
make work
easier for anyone
in your plant ?
106. Zeeshan Syed
Visual Management
106
Other types of Visual Display
Work Instructions
Information Board
T P M Checklist
107. Zeeshan Syed
Visual Management
107
Visual Work Instructions
What do size and placement of work instructions tell us ?
108. Zeeshan Syed
Visual Management
108
Product Boundary Sample Display
• Increases quality awareness
• Reduces variation
• Useful training aid
• Creates pride in products made
Need a new example of
Boundary Sample!!!!
109. Zeeshan Syed
Visual Management
109
Raw Material Boundary Samples
• Set quality standards
• Operators make quality
decisions
• Create shared product
knowledge
Use photos when actual samples are not practical
111. Zeeshan Syed
Visual Management
111
Information Boards
• What is the focus
of this
information
board ?
112. Zeeshan Syed
Visual Management
112
Safety
Cleaning -Organizing
Team Meetings & Activities
Environmental Management
Management at a Glance
Process Capability & Control
Problem Solving & Avoidance
Coupled Manufacturing
Production Scheduling
Work Standards
Quality System
Employee Commitment
Supplier Development
Knowledge Utilization
Skill Versatility & Cross-Training
Delivery Performance
Preventive Maintenance
Quality Assurance Approach
Management of Objectives
Quick Changeover
Current
5
Level
4
Performance 3
2
1 B E S T I N C L A S S
W O R L D C L A S S
L E A D I N G
L E A R N I N G
Performance Level
T R A D I T I O N A L
5
4
3
2
1
20 Keys of Continuous Improvement
Work Unit
1 3 4 5 6 7 8 9 10 2 11 12 13 14 15 16 17 18 19 20
Goal
113. Zeeshan Syed
Visual Management
113
Safety/Health
Leadership
Vision & Executive Sponsorship
Objectives/Improvement Planning
Communication
Learning & Personal Skills Development
Managing Change
Team Building / Teamwork
Problem Avoidance
Idea Implementation
New Product/Process Introductions
Internal Customer Focus
Team Recognition
External Customer Focus
Supplier Development
C I Tool Utilization
People Supportive Practices
Valuing Continuous Improvement
Environment
Best Place To Work
Current
Goal
5
4
3
2
1
Performance Level
BEST IN CLASS
W O R L D - C L A S S
L E A D I N G
L E A R N I N G
Performance Level
T R A D I T I O N A L
5
4
3
2
1
20 Keys of Site
Excellence
1 3 4 5 2 6 7 8 9 10 11 12 13 14 15 16 17 18 19 20
11-8
114. Zeeshan Syed
Visual Management
114
Information Board Guidelines
• Work Unit determines what will be displayed
• Make information easy to read and understand
• Always post information in same location
• Keep the focus clear; don’t overload info
• Keep information current
115. Zeeshan Syed
Visual Management
115
Other Types of Visual Display
• Status Boards
• Product Displays
• Storyboards / Pictures
• Electronic Marquees
Business Unit Display
116. Zeeshan Syed
Visual Management
116
The best visual displays are easy to
understand
Symbols
• are easily understood
• give immediate status
• engage viewer’s attention
117. Zeeshan Syed
Visual Management
117
Symbols make status visible and
easy to understand
What other information might be useful here ?
118. Zeeshan Syed
Visual Management
118
What do these symbols tell us?
P1 Device
CAPABILITY
Machine Number
Machine Type
Restudy Date
Person Responsible
Characteristic
Potential
Study
Long Term
Study Cp Cpk Study Date
Capable
119. Zeeshan Syed
Visual Management
119
Pictures Display Before and After
Improvements are easily documented with pictures
123. Zeeshan Syed
Visual Management
123
Using Visual Display to show operating
supplies cost
124. Zeeshan Syed
Visual Management
Sample
assemblies
are added
to display
every 2 hours
124
Product Display Example
Display used as a problem-solving tool
125. Zeeshan Syed
Visual Management
125
Team decision-making tools
How do balance
boards and cross
training charts
become team
decision making
tools ?
126. Zeeshan Syed
Visual Management
126
25%
Able to process
w/ direction
Cross Training Chart
50%
Able to process
w/out direction
100%
Able to train entire process
Plant Material Inventory
Inter-Plant Transfers (On-Line)
Radio Frequency (RF)
Trakker Scanner (IRL)
Hazardous Mat’l Inventory
Plant Batch Reporting
Skills Assessment
Employee Name
Kanban/Single Scan
Division Item
Inventory Bar Code
Inventory Receiving
James
Jerry
Dawn
75%
Able to process
and problem solve
127. Zeeshan Syed
Visual Management
127
Everyone knows,
“Safety is our Top Priority”
128. Zeeshan Syed
Visual Management
128
Lost Time Accidents
• Goal is
“Zero Accidents”
• Always keep displays up
to date
• Changing the display daily
focuses our attention on
safety -daily
129. Zeeshan Syed
Visual Management
129
Lighted displays capture attention
What audio warnings exist for safety concerns?
130. Zeeshan Syed
Visual Management
These standard lighted displays provide …
130
• Consistency
• Easy visibility
• Status at a glance
• Problem recognition
• Team encouragement
131. Zeeshan Syed
Visual Management
131
Marquee Information Display
What are other good uses for marquee displays ?
132. Zeeshan Syed
Visual Management
132
Visual Displays as
As Voice to our Visitors
• Share success stories
• Recognize team
achievements
• Communicate pride in our
work
133. Zeeshan Syed
Visual Management
133
Team Territory
This area is the team’s domain, but it is seen by all
134. Zeeshan Syed
Visual Management
134
Team Territory is a place to ...
• hold shift startup meetings
• identify the team
• exhibit products made
• be managed by the team
• communicate team goals
• display team accomplishments
135. Zeeshan Syed
Visual Management
135
Shift Start-Up Meetings
• sessio A daily working sessionn aatt tthhee ssttaarrtt--uupp ooff tthhee sshhiifftt tthhaatt’’ss::
• SShhoorrtt,, eevveerryy ddaayy,, eeaacchh sshhiifftt aanndd iinn eeaacchh wwoorrkk uunniitt
• AA ccoonnssiisstteenntt mmeetthhoodd ttoo ccoommmmuunniiccaattee eesssseennttiiaall iinnffoorrmmaattiioonn
• AA wwaayy ttoo aacccceelleerraattee tthhee ddiisssseemmiinnaattiioonn ooff eesssseennttiiaall iinnffoorrmmaattiioonn
• AA ddaaiillyy ddiisscciipplliinnee tthhaatt hheellppss iimmpprroovvee tteeaamm ppeerrffoorrmmaannccee ddaaiillyy
• AAnn ooppppoorrttuunniittyy ttoo rreeffeerr ttoo aanndd uuppddaattee tthhee PPrriimmaarryy VViissuuaall DDiissppllaayy
• AA eesssseennttiiaall ttooooll ttoo hheellpp ccrreeaattee && mmaaiinnttaaiinn tteeaamm iinnvvoollvveemmeenntt
Daily shift start-up meetings are the place to communicate and
share news and information.
137. Zeeshan Syed
Visual Management
Provide teams the territory they need to succeed
137
Common Territory
Shared Territory
138. Zeeshan Syed
Visual Management
138
Extra ! Extra ! Extra !
PRODUCTION PRESS
ARVIN EXHAUST - FRANKLIN PLANT October 17, 1997
FLOWER - Cosmos BIRTHSTONE - Opal
Happy Birthday
10/ 17 Audrey Lucas
10/ 18 Lula Vandeventer
Siberto Gonzales
David Koons
James Patton
10/ 19 Judy Hicks
10/ 21 Larry Burton
Catherine McTarsney
Angie Freeman
Douglas Hutcherson
David Thomas
Travis Burton
10/ 22 Phillis Burris
Timothy Sneed
Lori Smither
Tonya Jones
Warren Beeler
Randy Fisher
10/ 23 Debbie Ward
QUOTES OF THE
WEEK:
· “If you feel dog tired,
maybe it is because you have
growled all day”
· “A little kindness may mold a
fine character.”
UNITED WAY
WINNER - TV
On October 10th, the workers involved
in the United Way - Pacesetter
Campaign at the Franklin Plant, were
present for discussion of this year's
United Way drive. Those present
discussed ideas for future activities in
the United Way program at this Plant,
and we all wish to Thank those that
signed up or increased the contribution
to the United Way Drive.
The highlight of the lunch meeting was
the drawing for the Color TV set that
was awarded to a "Contributor", to this
years program. The lucky winner was:
Keith R. Park - from FPO Second Shift
(pictured above, right, with Facility Manager, Bob
Elliott)
Congratulations Keith !!!!!
Plant newspapers
provide excellent
opportunities
for recognition of
employees !
139. Zeeshan Syed
Visual Management
139
Customer / Supplier Information
• What do we produce?
• What is it used for / on?
• Who do we contact if we have problems?
• Who supplies our materials?
• Where do our finished goods go?
140. Zeeshan Syed
Visual Management
140
Customer / Supplier Display
What is being produced here?
Where is the product used?
142. Zeeshan Syed
Visual Management
142
How to implement
Visual Display
• Identify subject to focus on
• Identify problems or success associated with the subject
• Identify the audience for visual display
• Choose the best location for the display
• Develop and test the display
• Improve, finalize, and implement the display
143. Zeeshan Syed
Visual Management
143
Review:
Does your visual display offer these
benefits?
• Communicate information about performance
• Make standards visible
• Makes problems recognizable
• Make work safer and easier
• Recognize an achievement
• Creates a shared knowledge base
144. Zeeshan Syed
Visual Management
144
Remember...
Your Visual Displays tell others...
what is important to ourcompany!
147. Zeeshan Syed
Visual Management
147
How do we create Visual Management?
One phase at a time...
The 3rd Phase is Visual Measures
The 2nd Phase is Visual Display
The 1st Phase is Workplace Organization
148. Zeeshan Syed
Visual Management
148
Visual Measures
In this module we will discuss:
• Using the data we collect
• Seeing is believing
• Measurement tools
• Effective data display
• BOS Charting
• How to develop meaningful measures
149. Zeeshan Syed
Visual Management
149
Why do we use measurement data?
• To make more informed
decisions about our
operations
• To keep management
and shop floor
associates informed of
progress
• To drive and fine-tune our
improvement activities
• To educate the plant
community
If you are not going to
use data, don’t collect it!
150. Zeeshan Syed
Visual Management
150
Seeing is believing !
• Effective analysis requires
effective reporting
• How we report and display
data will affect how we think
about it
I should have
implemented
this idea sooner!
151. Zeeshan Syed
Visual Management
151
Lasting Impressions
To increase the impact of information:
• Make it sensory; use pictures, charts, sample products, and
audio sounds that involve the audience
• Use examples and comparisons
• Make data speak; keep it visually appealing
• Don’t forget, “Keep it simple”
152. Zeeshan Syed
Visual Management
152
To make data displays effective...
• Involve users in the measurement
• Provide the results to people who can act on them
• Present results in the most appropriate form for the
audience
• Link results with improvement activities
• Report data immediately; date it; keep it current
153. Zeeshan Syed
Visual Management
153
What do we measure ?
Cross
Training
P P M Process
Uptime /
Downtime
Capability
Supplier
Quality
Lost
Time
Accidents
Floor Space
Manufacturing
Scrap
Changeover
Time
154. Zeeshan Syed
Visual Management
154
The Standards
Company recommends these standard measurement
tools be used to:
• Indicate status
• Collect data
• Solve problems
• Measure performance
155. Zeeshan Syed
Visual Management
155
Company Standard Measurement Tools
and Indicators
• Changeover Clock
• Production Counters
• Error Proof Symbols
• P.I. Indicator
• Lost Time Accidents
• 5 S Audit
• Downtime Clock
• Process Capability Logo
• Bottleneck Symbols
• Current Part Running
• Limbo Bars
• BOS Charts
156. Zeeshan Syed
Visual Management
156
To increase information value . . .
• Insure data accuracy
• Put information in graphic
form
• Place it where the work gets
done
• Use it often to track
improvements
• Keep it current
157. Zeeshan Syed
Visual Management
157
Visual Production Counters
Visual production counters
help us:
• Keep accurate counts
• Make goals visible
• Detect production
abnormalities
• Satisfy customers
Goal / Actual / + or -
159. Zeeshan Syed
Visual Management
159
5S CHECKLIST
5 S Audit Tools
Instructions: Take a look around the work area and do a visual inspection. As you do the inspection
place a check mark in either the “OK” column or the “NOT OK” column. Then place a numerical
value in the “POINTS” column. Scores should be from 1 to 3, as follows:
1 = non-existent, the team has made no progress in this area.
2 = progressing, work has been done on this but the team lacks the discipline.
3 = implemented, being done on a regular basis.
Please make any necessary comments in the “OBSERVATIONS” column.
CATEGORY ITEM OK NOT OK POINTS OBSERVATIONS
Have unnecessary items been X-tagged?
Are items neatly arranged?
Are walkways/work areas clearly outlined?
Are designated areas marked for incoming
material?
SORT Are materials located in designated areas?
(Organization) Are designated areas marked for outgoing
material?
Is outgoing material located in designated
area?
Are information boards orderly?
Is indicated information found?
Is information current?
Do excess materials have a specific
location?
Are excess materials in their location?
160. Zeeshan Syed
Visual Management
160
Is there a visual measure of our
Customer Satisfaction ?
• Collect customer
satisfaction data
• Display it where everyone
sees it
• Keep track of progress
• Highlight special
achievements / awards
161. Zeeshan Syed
Visual Management
161
Safety First ! Always.
• Make safety records visible
• Perform regular safety audits
• Display lost time injuries /
accidents
• Keep track of where, when,
why, and how accidents occur
162. Zeeshan Syed
Visual Management
162
The Versatile BOS Chart
The BOS Chart can wear
many hats:
• Visual display
• Problem solving tool
• Progress indicator
• Assign responsibilities
163. Zeeshan Syed
Visual Management
163
Follow these steps to use BOS for
Visual Measures
The best reason to include BOS Charting with measure
displays is because BOS requires action !
Key Measurable
Data Analysis
Improvement
Activities
Improvement
Tracking
165. Zeeshan Syed
Visual Management
165
Step 1
Involve users in the measurement
Team members collect data; track numbers:
• Total product produced
• per hour, per shift, per day, per week, etc.
• Average time to produce one unit
• PPM - number of defects
• Scrap - percentage of total produced
• Changeover time
• Downtime / Uptime
166. Zeeshan Syed
Visual Management
166
Step 2
Team determines what to BOS Chart
• Something needing
improvement
• Team has control
• Important to customer
• Important to our company
167. Zeeshan Syed
Visual Management
167
Step 3
Team members update BOS
• Use team meeting to study data
• Team plans improvement
activities
• Everyone participates
• Computers not required
168. Zeeshan Syed
Visual Management
168
Step 4
Make BOS results visible at the Work Unit
169. Zeeshan Syed
Visual Management
169
To develop Visual Measures
decide . . .
• What needs to be measured ?
• Who is the user / audience ?
• How often do we take the data ?
• Who will do the tracking ?
• How will we display data so that it speaks ?
• Where do we best locate the display ?
170. Zeeshan Syed
Visual Management
170
Reality Check for Measures
Answer these four questions about the measures you use:
• Are they simple and easy to use?
• Do they change over time?
• Do they provide rapid feedback?
• Do they foster continuous improvement?
171. Zeeshan Syed
Visual Management
171
VISUAL DISPLAY & MEASURES AUDIT
1. For each item listed fill in an observation to indicated whether or not the work group is currently working on this.
2. If there are any changes desired please indicate those in the “Desired Changes” column.
3. In the column labeled “Priority” indicate if the change can be implemented in:
1) 36 Hours
2) 5 Days
3) 2 Weeks
4. Fill in any additional items that are observed in the work area and fill in all categories.
ITEM OBSERVATION DESIRED CHANGES PRIORITY
Changeover Clock Dedicated Line-clock is not
needed
Redistribute the clock to a needy cell 1
P.I. Indicator
Production Counters
Changeover Graph
Bottleneck Operation
173. Zeeshan Syed
Visual Management
173
How do we create Visual Management?
One phase at a time...
The 4th Phase is Visual Management
The 3rd Phase is Visual Measures
The 2nd Phase is Visual Display
The 1st Phase is Workplace Organization
174. Zeeshan Syed
Visual Management
174
Visual Management
Using the information provided by visuals to make informed
and proper decisions or judgements daily.
175. Zeeshan Syed
Visual Management
175
Vision
The Visually Managed Factory is:
A workplace that is easily understood by all. Anyone could
walk into a work unit and at a ‘glance’ understand the
status of that work unit, what is waste or abnormal, and
where improvements are needed.
176. Zeeshan Syed
Visual Management
176
Vision
If you walked into a work unit or facility on Sunday.
No one is around and nothing is running. Would you be
able to understand the status of that work unit?
177. Zeeshan Syed
Visual Management
177
Visual Management
• Status
• Distinguish between what is and is not normal
• Make waste and abnormalities obvious to everyone
• Constantly uncover needs for improvement
• Help make each persons job easier
• Involve everyone
178. Zeeshan Syed
Visual Management
178
Status at a Glance
What information do we need to know?
• Is it?
• easily visible
• consistent throughout the facility or business unit
• current
• USEFUL
180. Zeeshan Syed
Visual Management
180
Status at a Glance
What do certain visuals communicate and how do we use
them to manage?
• Production counters
• Downtime/Uptime clocks
• Change-over clocks
• BOS charts
181. Zeeshan Syed
Visual Management
181
Status at a Glance
What do certain visuals communicate and how
do we use them to manage?
•Safety
•PPM
•Scrap
182. Zeeshan Syed
Visual Management
182
Visual Management
The following are some examples of these visuals or
measures.
•What do they communicate to us?
•How do they communicate it?
•What judgements or decisions do they help us to
make?
190. Zeeshan Syed
Visual Management
190
Needs for Improvement
Knowing very little about these facilities,
with the simple visuals we just looked at,
we were able to make some suggestions
for possible improvements.
191. Zeeshan Syed
Visual Management
191
Needs for Improvement
• Utilize these visuals to make improvements and
suggestions for improvements during:
• EI meetings
• Shift Start Up Meetings
• Downtime
• ALL the Time
192. Zeeshan Syed
Visual Management
192
Standard Work Tools
Balance boards and equipment layouts are used to:
• Level work loads
• Make our jobs easier
• Processes better and more efficient
193. Zeeshan Syed
Visual Management
193
Standard Work Tools
What does this tell us?
How would you use this to manage?
194. Zeeshan Syed
Visual Management
194
25%
Able to process
w/ direction
50%
Able to process
w/o direction
75%
Able to process
& problem solve
100%
Able to train others
on entire process
Plant Material Inventory
Inter-Plant Transfers (On-Line)
Radio Frequency (RF)
Trakker Scanner (IRL)
Hazardous Mat’l Inventory
Plant Batch Reporting
Skills Assessment
Employee Name
Scan
Code
Single Receiving
Bar Item
Kanban/Inventory Inventory Division Joe
Bob
Betty
Cross Training Chart
195. Zeeshan Syed
Visual Management
195
Designated Areas of Responsibility
• Color coded maps
• Who does what?
• How often do they do it?
196. Zeeshan Syed
Visual Management
196
Red Box Scrap
• Separates non-conforming materials from product flow
• Gives a definite point for stopping the line and taking
corrective action
• Promotes visual awareness of repetitive defects
197. Zeeshan Syed
Visual Management
197
Red Box Scrap
• Are there less than 6 total or 3 identical parts in the
box?
YES - continue production
NO - stop production and take corrective actions
200. Zeeshan Syed
Visual Management
200
Error Proofing Program
P1 Device
(Green)
An Error Proofing device that PREVENTS an error from
occurring
201. Zeeshan Syed
Visual Management
201
Error Proofing Program
P2 Device
(Purple)
An Error Proofing device that DETECTS an error in time to
allow rework and prevents further errors of the same type
202. Zeeshan Syed
Visual Management
202
Error Proofing Program
P3 Device
(Blue)
An Error Proofing device that detects a defect and
ELIMINATES IT FROM THE FLOW of good products
204. Zeeshan Syed
Visual Management
204
CAPABILITY
Machine Number
Machine Type
Restudy Date
Person Responsible
Characteristic
Potential
Study
Long Term
Study
Cp Cpk Study Date
Capable
205. Zeeshan Syed
Visual Management
205
CAPABILITY
Machine Number
Machine Type
Restudy Date
Person Responsible
Characteristic
Potential
Study
Long Term
Study
Cp Cpk Study Date
Not Capable
206. Zeeshan Syed
Visual Management
206
Visual Management
Are WE Hitting the Target?
207. Zeeshan Syed
Visual Management
207
Do Our Visuals:
• Give you the information needed to make proper decisions?
• Make abnormalities and problems obvious?
• Promote communication and employee involvement?
• Make everyone's jobs easier?
• Recognize achievements and improvements?
208. Zeeshan Syed
Visual Management
208
The Visual Management Check List and
Implementation
209. Zeeshan Syed
Visual Management
209
THE VISUAL FACTORY CHECKLIST
ATEGORY ITEM YES NO
Changeover tools are within reach
Tooling is well organized
Machines and equipment are clean and painted
Unnecessary items are cleared
Workplace organization and orderliness
5S Aisles are well marked and clear
There is a place for everything and everything in its place
Housekeeping responsibilities are assigned
Disciplined approach to clean work area
All bins are labeled and no parts are on the floor
All personal items are stored in lockers
Method to identify hold and reject parts
Supplier defects are segregated
Business Unit/department display visible
Cell displays conform to the unit/department standards
Using standard changeover clock
Part counter displayed
Downtime clock in use
Red box scrap method in use
Work instructions displayed at the point of use
Min/Max Limbo bars for inventory
Current part number and next part number displayed
Kanban system in use
Kanban system for MRO
Kanban system for Tooling
First piece displayed
Boundary Sample board
VISUAL Customer/Supplier information displayed
DISPLAY Bottleneck machines are identified
Bottleneck cycle time is on the balance board
Changeover signal to synchronize cell
Changeover stock staging area for fast changeover
Error proofing devices are on the PM check
ATPM boards using tags and action status in each cell
Cumulative downtime clock displayed in each cell
Proper lighting and air handling
Cell number, customer and product posted at each cell
Employee information board is in a standard format
Key measures are trended and up to date
Team project display with before/after/future pictures
Defects are displayed with arrows and action plans
Safety rules are posted and followed
Color coding and symbols are used for quick identification
210. Zeeshan Syed
Visual Management
210
THE VISUAL FACTORY
IMPLEMENTATION PLAN
Implementation Objectives:
1. Begin immediately and involve all cell members.
2. Capture before condition.
3. Identify areas of greatest opportunity.
Activities Week 1: Responsible:
·
·
·
·
·
Activities Week 2: Responsible:
·
·
·
·
·
Activities Week 3: Responsible:
·
·
·
·
·
Activities Week 4: Responsible:
·
·
·
·
·
Key Support People:
Improve employee morale and performance through increased ownership and team territory.
Identity opportunities and suggestions for how, when and why to implement visual aids.
Goals:
To empower employees to improve their workplaces
To involve employees in improving quality, productivity, and safety
To improve communications between all ArvinMeritor employees, across all boundaries
To work toward Visual Management of the workplace, achieved through progressive application of each of the separate phases: Workplace Organization, Visual Display, Visual Measures, and Visual Control.
To make the work environment more pleasant, jobs easier to manage, and progress more apparent.
To give employees a high degree of ownership in what goes on within the Visual Factory
Instruct participants to break into smaller groups to brainstorm what the current situation is like. Instruct them to consider all 5 senses when discussing their workplace.
What are some of the real problems? (Problems no one talks about publicly.)
What do you dread about going to work?
Allow no more than 10 minutes for this exercise.
Record all ideas on a flipchart.
Ask a member from each group to briefly summarize what was discussed.
Left blank to allow groups time to work.
Implementation of the 4 phases will create a system for Visual Management of the workplace
Let’s think for a minute about how standards make our lives easier.
Do standards offer any additional benefits besides those mentioned here?
Think about the factor of cost? Can using standards help lower costs too?
How many of you are familiar with the procedure for RED BOX SCRAP ?
Is this procedure a STANDARD in your plant?
Not only does RED BOX SCRAP create a visual display standard ( I.e. using only a red box to hold manufactured scrap, the procedure is a standard for the way we operate
Each phase of the visual management process is typically best completed in an order that builds upon itself. The first level is Workplace Organization (WPO).
WPO is a vital link to continuous improvement. It would be very difficult to improve and implement lean manufacturing principles such as quick changeover, low inventories, FIFO, JIT, etc. without workplace organization.
The 5S’s are an important part of the WPO process. The S’s are Sort, Stabilize, Shine, Standardize, and Sustain.
Are your areas as well sorted as they should be? Keep only what is needed. Many areas have things such as tools , rags, even brooms sitting around that have not been used in months and probably never will. People are afraid to get rid of these things because they think they may be needed later. Get rid of the things that are not needed. Look for things that are not where they belong. If a tool is used for a machine in another cell isn’t that where it should be. X-tag what you don’t need, that will be discussed in a moment.
Does you facility have any walls or dark corners that have stuff or junk piled up in hopes that it will fix itself or will someday be needed?
This is a non-ArvinMeritor facility that shows some good 5 S-ing. These are tooling storage racks that can be rolled to the point of use. Note the reflections off of the floor. This place is clean. How could it be improved? By labeling or color coding.
X-Tagging is a way to remove things that are not needed or used anymore.
1. The first step is to select someone from the work unit or area to be the leader. This may be a responsibility that is rotated to everyone.
2. Identify what is not needed.
3. Attach a filled out X-tag to the item(s).
4. Move these items to a local holding area near or in the work unit.
5. Determine how long to hold these items before removing them. The minimum should be 24 hours, or long enough that each shift has a chance to decide if that is something that they need.
6. Once the time is up the item(s) should be moved to a facility holding area where items can be removed by anyone who could use that item in the facility.
7. All safety issues and problems should be tagged and addressed as soon as possible.
A good rule of thumb as to where to store stuff is:
This is what an X-tag looks like.
Read slide
This is a locker room in an ArvinMeritor facility in Spain.
Though the picture quality of these is very poor you can still see the incredible difference between the before and after pictures. This also shows that you don’t have to have a new facility to make it look nice.
Here is a very clean ArvinMeritor facility that is located in Spain.
Spain again
Does anyone know what this is? DNA. Is DNA very standardized? This is an extreme example but will hopefully get you think of the importance and the standardization you encounter all of the time.
Here are some of the initial things you will want to consider standardizing.
At the 17th street plant they have utilized the space behind a press and labeled where things should go.
Here some chemicals are labeled and even color coded, not to mention clean.
At Franklin, they have an area where they have written on cardboard what the part# is in that location, they have also included a sample part as well. This may not be the final labeling but is a good start and conveys the needed information.
Read slide
The arrows show the upper and lower limits of this gage. You don’t have to know anything about the process to easily see if this measure is where it should be.
This is a simple shadow board that lets you know what is missing. It is important that everyone cooperates in sustaining.
In review:
Here is a 5S checklist that can be used to help you determine how your area is doing
This is a display sign to visually show how you are doing with 5S.
These supporting strategies are also a part of WPO
The picture shown here is those color coded wooden blocks you would play with as a child. Funny, color coding is such a simple organizational tool that a 3 year old could use it, yet we probably don’t use it enough.
Most facilities separate their different types of scrap.
Here is what the Central Tubing Facility uses for their scrap color coding, also their overhead pipes.
Central Tubing Facility overhead pipes.
Color coded scrap hoppers at Gladstone.
Do you ever feel you are looking for tools like this.
Things that should be at the point of use are.
Tools at the point of use
Tooling cart at Gladstone
This is in the work area of a supplier. They keep information they need very accessible.
No one should ever get hurt on the job. Our goal is ZERO ACCIDENTS!!
Some of our work units are arranged this way. Is safety a concern if a machine or hydraulic line would break. Would people be able to get out of the way.
It looks very difficult to get to this eyewash station
The groups will be reporting what items they have x-tagged using this sheet
The groups also need to complete their 5S checklist and report the results.
Fill in the number of 5S points needing attention and this will be posted in the work area.
Visual Display communicates information about:
The work Environment
Safety
Operations
Storage
Quality
Equipment
Success
This example from AE Pamplona, Spain shows floor labeling used to set limits.
What are the advantages to using this level of labeling?
How does floor labeling help us maintain Visual Management?
Sometimes we get so familiar with something we fail to see the obvious. For example if you went into the store picked up a carton of eggs, opened it as you always do, and check to see that none were broken. Would you have notices that there were two eggs missing. You probably would have. But, what if there were only 10 spaces for the eggs, would you have noticed that there were only 10 then.
Can easily see what is missing if there is an open space for it.
Another example from Steel and Trucks, Queretaro, Mexico.
This component parts supplier has implemented visual display for items used frequently by the operator at the work unit.
What advantages do you see in this type of display?
CTF boundary board.
The display board of each work unit should include their 20 Keys with performance levels and goals marked.
Remember, work unit goals should be realistic and focus on the most important issues. The goals will probably not include improvement in all 20 Keys.
The Site 20 Keys showing current status and goals should be displayed on the facility information board.
Information boards should be as near the work areas as possible.
Tell story of small office manager who threw rolls of quarters all over floor to illustrate office waste.
What did the earlier slides mean by status
All of these areas can benefit from visual management.
Though you may not know Japanese this board is still easily understood.
Here is a simple check list that was used in the GM visual factory test work unit. It is very simple and easily visible as to what they have accomplished.
Here is a picture of an andon light from Chickasha. Why would something like this be of value to your work unit?
Here are some simple counters used to track defects. Though not vary large and visible they do keep a running count of the defects and are easily accessible.
Here are some very visible and standardized production counters and andon boards from a Mexico facility.
The balance boards are visual tools that help use to balance the workload within a work unit, and visually see areas that need attention or can be improved upon (the color coded walk and wait times).
Why may may we need to know who is trained in a particular job.