Downloaded 167 times
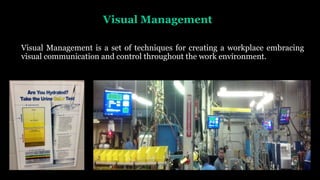
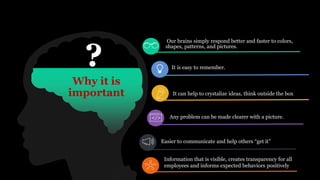
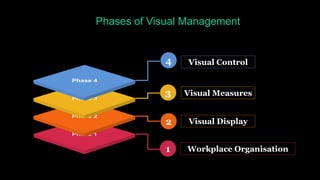
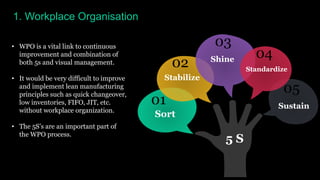
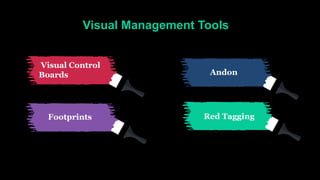


Visual management techniques enhance workplace communication and control by using visual aids like colors and symbols. Key components include workplace organization through 5S, visual measures for performance tracking, and visual controls that promote adherence to standards. The use of visual control boards, Andon systems, and tagging improves operational efficiency, safety, and overall productivity.


