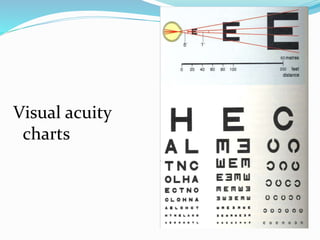
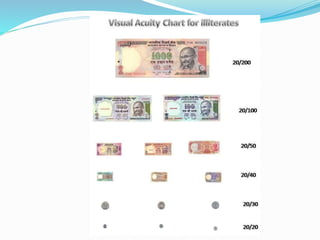
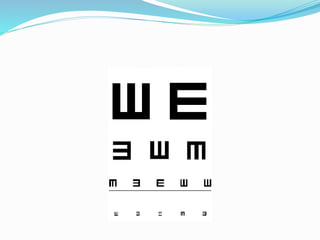
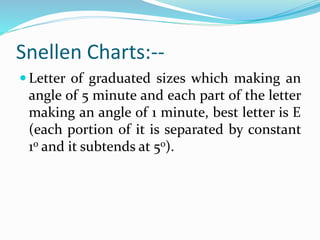
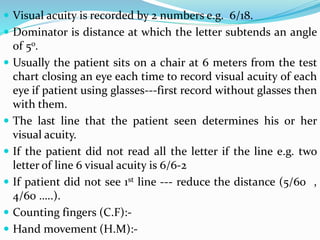
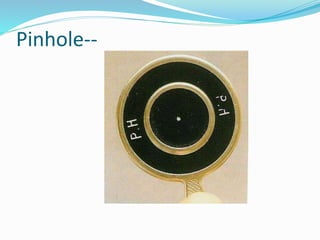
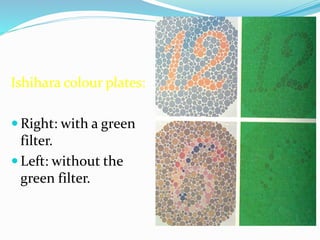
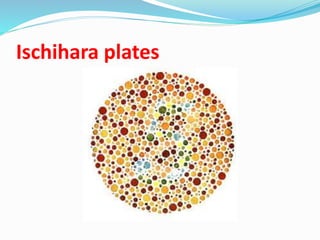
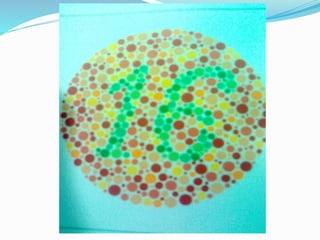
Dr. Mohd Najmussadiq Khan
M S (Ophth) DiSSO(ESASO)
VISUAL ACUITY--
 Visual acuity is the ability to distinguish
details and shape of the objects. It's
functional assessment of fovea.
 Total number of cones is 6.5 to 7 million but
cones of fovea are 147000/mm2.
 Cones in 3 mm from fovea are 6000/mm2.
 Cones in 10 mm from fovea are 3000/mm2.
Visual acuity
charts
Snellen Charts:--
Snellen Charts:--
 Letter of graduated sizes which making an
angle of 5 minute and each part of the letter
making an angle of 1 minute, best letter is E
(each portion of it is separated by constant
1o and it subtends at 5o).
Visual angle in Visual acuity
charts
 Visual acuity is recorded by 2 numbers e.g. 6/18.
 Dominator is distance at which the letter subtends an angle
of 5o.
 Usually the patient sits on a chair at 6 meters from the test
chart closing an eye each time to record visual acuity of each
eye if patient using glasses---first record without glasses then
with them.
 The last line that the patient seen determines his or her
visual acuity.
 If the patient did not read all the letter if the line e.g. two
letter of line 6 visual acuity is 6/6-2
 If patient did not see 1st line --- reduce the distance (5/60 ,
4/60 …..).
 Counting fingers (C.F):-
 Hand movement (H.M):-
 If person is unable of count finger --- record the
distance at which he can recognize hand
movements.
 Light projection (PR):-It’s the ability to detect
the direction of light (function test for retinal
periphery and optic nerve).
 Light perception (perception of light) (P.L):-
Can patient perceive light if no P.L ----blind. Try
not to use the word blind ----say no P.L
HOW TO TEST NEAR VISION--
 measurement of near vision is not as
accurate as distance vision.
 Test distance charts are 35cm; many test
charts are used as Jaeger charts J1, J2,
J3…..American ophthalmologic society N1,
N2 ….
HOW TO TEST VISUAL ACUITY IN
CHILDERN--
 4 year or > usually cooperative on Snellen
charts with familiar objects or E cards.
 By throwing coins on the floor--- let the child
pick them up.
 Using a rotating drum with alternating strips
of black and white--- this rotating movement
will produce of opticokinetic nystagmus
(OKN) in normal vision.
 Infants are taking interest in surrounding
light.
Hundreds and thousands’ sweet
test
Preferential looking with Cardiff
cards
Pinhole test:-
 Measurement of visual acuity with patient
seeing test letters through a small opening
in an opaque shield.
 It's to differentiate whether subnormal
vision is due to refractive error or pathology
in the eye.
Pinhole--
Visual field:-
 It’s the area simultaneously visible to one eye without
movement measured by perimeter 33 cm from the eye. It can
be recorded by many instruments or clinically by the
confrontation test.
 It gives rough estimation of visual field .
 The examiner sits facing the patient at 1 meter in a good
illumination.
 Ask the patient to close one eye with his fingers the examiner
closes right eye --- examiner closes left .
 The examiner brings his hand slowly from the periphery with
1 or 2 fingers extended --- midway between examiner and
patient .
 When the examiner and patient have normal vision they
should recognize number of finger at same time --- test
temporal, nasal, superior and inferior fields.
Normal visual field as plotted by
Bjerrum tangent screen
Confrontation visual field
testing
Kinetic visual
field testing
with
Goldmann
perimeter
Static perimeter: Friedman
analyzer
COLOUR VISION
It’s the function of cones and there are three type of
cones with photo pigments .
 Long wave length sensitive cones---red sensitive
 Middle wave length sensitive cones---green
sensitive
 Short wave length sensitive cones---blue sensitive
The red and green cones are 5 time more than blue
cones. The color vision is trichromatic (mixing of
the 3 primary colors to give 150 – 200 colors
(Trichromatism)
COLOR VISION DEFECT--
 Sex linked recessive disorder its 8% in male
and 0.4% in female.
 Color deficient not color blind.
 There is no treatment, it bilateral,
stationary, normal Fundus.
 They are unfit for some jobs as railway
engine drivers, laboratory technician.
Type of color defect:-
 Red deficient--- protanomaly Protanopia
protanopes
 Green deficient--- deutanomaly
Deuterdeutanopes
 Blue deficient--- tritanomaly
tritanopes
 Its trichromatic 3 pigments present but one is
abnormal.
Acquired :-
Cause :-
 degeneration of cons
 optic nerve disease e.g. neuritis
 visual cortex defects
 change in optical media e.g. cataract
 it is may be unilateral or bilateral,
progressive and may curable if disease
recovered .
Methods of testing colour vision :-
 Test plates
 Ischihara plates
 lantern test
 Hue discrimination test (100 hue test )
 D 15 test
Ishihara colour plates:
 Right: with a green
filter.
 Left: without the
green filter.
Ischihara plates
Visual acuity & colour vision

Visual acuity & colour vision

  • 1.
    Dr. Mohd NajmussadiqKhan M S (Ophth) DiSSO(ESASO)
  • 2.
    VISUAL ACUITY--  Visualacuity is the ability to distinguish details and shape of the objects. It's functional assessment of fovea.  Total number of cones is 6.5 to 7 million but cones of fovea are 147000/mm2.  Cones in 3 mm from fovea are 6000/mm2.  Cones in 10 mm from fovea are 3000/mm2.
  • 3.
  • 6.
  • 8.
    Snellen Charts:--  Letterof graduated sizes which making an angle of 5 minute and each part of the letter making an angle of 1 minute, best letter is E (each portion of it is separated by constant 1o and it subtends at 5o).
  • 9.
    Visual angle inVisual acuity charts
  • 10.
     Visual acuityis recorded by 2 numbers e.g. 6/18.  Dominator is distance at which the letter subtends an angle of 5o.  Usually the patient sits on a chair at 6 meters from the test chart closing an eye each time to record visual acuity of each eye if patient using glasses---first record without glasses then with them.  The last line that the patient seen determines his or her visual acuity.  If the patient did not read all the letter if the line e.g. two letter of line 6 visual acuity is 6/6-2  If patient did not see 1st line --- reduce the distance (5/60 , 4/60 …..).  Counting fingers (C.F):-  Hand movement (H.M):-
  • 11.
     If personis unable of count finger --- record the distance at which he can recognize hand movements.  Light projection (PR):-It’s the ability to detect the direction of light (function test for retinal periphery and optic nerve).  Light perception (perception of light) (P.L):- Can patient perceive light if no P.L ----blind. Try not to use the word blind ----say no P.L
  • 12.
    HOW TO TESTNEAR VISION--  measurement of near vision is not as accurate as distance vision.  Test distance charts are 35cm; many test charts are used as Jaeger charts J1, J2, J3…..American ophthalmologic society N1, N2 ….
  • 13.
    HOW TO TESTVISUAL ACUITY IN CHILDERN--  4 year or > usually cooperative on Snellen charts with familiar objects or E cards.  By throwing coins on the floor--- let the child pick them up.  Using a rotating drum with alternating strips of black and white--- this rotating movement will produce of opticokinetic nystagmus (OKN) in normal vision.  Infants are taking interest in surrounding light.
  • 14.
  • 15.
  • 16.
    Pinhole test:-  Measurementof visual acuity with patient seeing test letters through a small opening in an opaque shield.  It's to differentiate whether subnormal vision is due to refractive error or pathology in the eye.
  • 17.
  • 18.
    Visual field:-  It’sthe area simultaneously visible to one eye without movement measured by perimeter 33 cm from the eye. It can be recorded by many instruments or clinically by the confrontation test.  It gives rough estimation of visual field .  The examiner sits facing the patient at 1 meter in a good illumination.  Ask the patient to close one eye with his fingers the examiner closes right eye --- examiner closes left .  The examiner brings his hand slowly from the periphery with 1 or 2 fingers extended --- midway between examiner and patient .  When the examiner and patient have normal vision they should recognize number of finger at same time --- test temporal, nasal, superior and inferior fields.
  • 19.
    Normal visual fieldas plotted by Bjerrum tangent screen
  • 20.
  • 21.
  • 22.
  • 24.
    COLOUR VISION It’s thefunction of cones and there are three type of cones with photo pigments .  Long wave length sensitive cones---red sensitive  Middle wave length sensitive cones---green sensitive  Short wave length sensitive cones---blue sensitive The red and green cones are 5 time more than blue cones. The color vision is trichromatic (mixing of the 3 primary colors to give 150 – 200 colors (Trichromatism)
  • 25.
    COLOR VISION DEFECT-- Sex linked recessive disorder its 8% in male and 0.4% in female.  Color deficient not color blind.  There is no treatment, it bilateral, stationary, normal Fundus.  They are unfit for some jobs as railway engine drivers, laboratory technician.
  • 26.
    Type of colordefect:-  Red deficient--- protanomaly Protanopia protanopes  Green deficient--- deutanomaly Deuterdeutanopes  Blue deficient--- tritanomaly tritanopes  Its trichromatic 3 pigments present but one is abnormal.
  • 27.
    Acquired :- Cause :- degeneration of cons  optic nerve disease e.g. neuritis  visual cortex defects  change in optical media e.g. cataract  it is may be unilateral or bilateral, progressive and may curable if disease recovered .
  • 28.
    Methods of testingcolour vision :-  Test plates  Ischihara plates  lantern test  Hue discrimination test (100 hue test )  D 15 test
  • 29.
    Ishihara colour plates: Right: with a green filter.  Left: without the green filter.
  • 30.