Abstract: In this era of electronic advancements in the field of medical image processing, the quantum of medical X-ray images so produced exorbitantly can be effectively addressed by means of automated indexing, comparing, analysing and annotating that will really be pivotal to the radiologists in interpreting and diagnosing the diseases. In order to envisage such an objective, it has been humbly endeavoured in this paper by proposing an efficient methodology that takes care of the view classification of the X-ray images for the automated annotation from their vast database, with which the decision making for the physicians and radiologists becomes simpler despite an immeasurable and ever-growing trends of the X-ray images. In this paper, X-ray images of six different classes namely chest, head, foot, palm, spine and neck have been collected. The framework proposed in this paper involves the following: The images are pre-processed using M3 filter and segmentation by Expectation Maximization (EM) algorithm, followed by feature extraction through Discrete Wavelet Transform. The orientation of X-ray images has been performed in this work by comparing among the Probabilistic Neural Network (PNN), Decision Tree algorithm and Support Vector Machine (SVM), while the PNN yields an accuracy of 75%, the Decision Tree with 92.77% and the SVM of 93.33%. Key Words: M3 filter, Expectation Maximaization, Discrete Wavelet Transformation, Probabilistic Neural Network, Decision Tree Algorithm and Support Vector Machine.
View classification of medical x ray images using pnn classifier, decision tree algorithm and svm classifier
1. IJRET: International Journal of Research in Engineering and Technology eISSN: 2319-1163 | pISSN: 2321-7308
_______________________________________________________________________________________
Volume: 04 Issue: 11 | Nov-2015, Available @ http://www.ijret.org 277
VIEW CLASSIFICATION OF MEDICAL X-RAY IMAGES USING PNN
CLASSIFIER, DECISION TREE ALGORITHM AND SVM CLASSIFIER
Sumathi Ganesan1
, T.S.Subashini2
1
Assistant Professor, Department of Computer Science and Engineering, Faculty of Engineering and Technology,
Annamalai University, India.
2
Associate Professor, Department of Computer Science and Engineering, Faculty of Engineering and Technology,
Annamalai University, India.
Abstract:
In this era of electronic advancements in the field of medical image processing, the quantum of medical X-ray images so produced
exorbitantly can be effectively addressed by means of automated indexing, comparing, analysing and annotating that will really
be pivotal to the radiologists in interpreting and diagnosing the diseases. In order to envisage such an objective, it has been
humbly endeavoured in this paper by proposing an efficient methodology that takes care of the view classification of the X-ray
images for the automated annotation from their vast database, with which the decision making for the physicians and radiologists
becomes simpler despite an immeasurable and ever-growing trends of the X-ray images. In this paper, X-ray images of six
different classes namely chest, head, foot, palm, spine and neck have been collected. The framework proposed in this paper
involves the following: The images are pre-processed using M3 filter and segmentation by Expectation Maximization (EM)
algorithm, followed by feature extraction through Discrete Wavelet Transform. The orientation of X-ray images has been
performed in this work by comparing among the Probabilistic Neural Network (PNN), Decision Tree algorithm and Support
Vector Machine (SVM), while the PNN yields an accuracy of 75%, the Decision Tree with 92.77% and the SVM of 93.33%.
Key Words: M3 filter, Expectation Maximaization, Discrete Wavelet Transformation, Probabilistic Neural Network,
Decision Tree Algorithm and Support Vector Machine.
---------------------------------------------------------------------***---------------------------------------------------------------------
1. INTRODUCTION
Orientation of X-ray images is referred as radiographic
positioning or view of an X-ray image. Radiographic
positioning is highly standardized for better positioning, so
as to accurately interpret for the correct diagnosis by the
physician and radiologists. Hence, it plays a pivotal role in
viewing the particular portions or areas to be examined.
Radiographic positions viz. lateral view, oblique view,
anterior-posterior view, posterior-anterior view etc., which
are all so classified based on the way the X-ray images are
radiographed with respect to the object and the film. When
the X-rays have passed through the object from front to back
of the patients, it is referred as Anterior-Posterior (AP) view.
If it is taken from back to front of the patient it is said to be
Posterior-Anterior (PA) view. When it is passed through the
object from the side of the patients, it is said to be lateral
view. In oblique view, X-rays have passed through the
object based on the angle. Hence, it is quite inevitable that
there needs to be suitable computational algorithms for the
detection of the orientation of the X-ray images.
Keeping such objectives in view, an attempt has been made
in this paper so as to detect the orientation of the X-ray
images for image retrieval that aims for automated
annotation. The most relevant Discrete Wavelet
Transformation (DWT) coefficients were used as features
and the X-rays were classified using Support Vector
Machine (SVM) and Probabilistic Neural Network (PNN).
An effort has been made to automatically search and classify
the X-ray images into six classes namely chest, spine, foot,
palm, head and neck. Each class consists of 30 images. The
image dataset represents different ages, genders, views,
positions and pathologies. The classification techniques and
automatic code generation are very much helpful in
teaching, research, diagnostic analysis and hence this
method is proposed.
This paper has been organized as: Section I gives an outlay
of the general introduction and the need of the proposed
work. Review of the existing Literature has been presented
in Section II. Section III elaborates the Proposed
Methodology, while the Performance Measures and
Experimental Results are described in Section IV and V
respectively that are followed by the conclusion in Section
VI.
2. LITERATURE REVIEW
An extensive survey of the existing literatures has been
made with a view to realize the on-going trends in the field
of automated annotation of X-ray images for efficient
retrieval of medical-images, which gives an insight into the
issues and problems that are currently faced by the
prevailing methodologies and by which their shortcomings
can be addressed efficiently.
2. IJRET: International Journal of Research in Engineering and Technology eISSN: 2319-1163 | pISSN: 2321-7308
_______________________________________________________________________________________
Volume: 04 Issue: 11 | Nov-2015, Available @ http://www.ijret.org 278
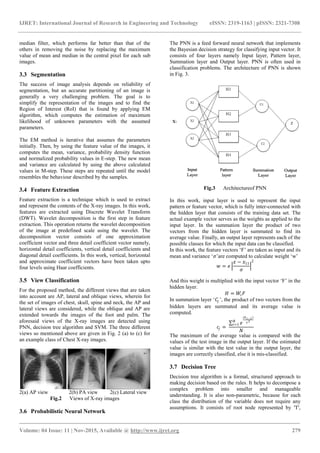
Image processing and pattern recognition techniques are
practically important to provide the required information in
diagnosis and treatment for medical imaging. The progress
in these techniques is reflected in the sophisticated software
tools, some of which are commercially available, and others
may still be in research and development stage [1]. The M3
Filter is proposed which is a hybridization of mean and
median filter. It replaces the central pixel by the maximum
value of mean and median for each sub images [2]. The
Paper in [3] presents with two different texture features
namely 32 bin gray scale histogram and statistical features,
which provide information about the properties of the level
of the intensity distribution in the echo cardiogram image.
EM algorithm is used to find the most likely distribution
function to describe the relation between obvious variables
and latent variables has been presented in [4]. A
segmentation algorithm based on the kernelized weighted C-
means clustering and automatic segmentation correctness
coefficients is proposed in [5]. The Paper in [6] describes
the removal of the noise and proposes with the enhancement
in terms of the contrast using high boost filter and Laplacian
of Gaussian filter. An EM algorithm for segmentation and
powerful probabilistic modeling tool that are used to provide
a model-based clustering of Transform domain features
namely DWT and DCT coefficients for classification of X-
rays have been studied in the work of [7] and [8]
respectively. The work in [9] attempts to recognize the
various views by image matching that employs a set of local
key points as features. A generalized approach to histogram
matching is given in [10]. An automatic classification of
cardiac views in Echocardiogram using BPNN and SVM
classifier is described in paper [11]. The author in [12]
describes the Decision tree classifier to address the problem
of automatic image annotation for medical image retrieval.
The work in [14] describes the Classification of X-rays
using Statistical Moments and SVM.
3. PROPOSED METHODOLOGY
In this system, the proposed work consists of three main
stages namely image pre-processing, feature extraction and
view classification that have been used in order to classify
the views of the X-ray images.
Medical X-ray images are taken as input to the system. M3
filter is applied on the input image to reduce the noise and to
improve the contrast. Filtered images have been segmented
using Expectation Maximization (EM) algorithm. From the
segmented images, the features have been extracted using
Discrete Wavelet Transform (DWT). SVM classifier, PNN
classifier and Decision tree algorithm are used for image
classification process to classify the X-ray images of head,
foot, palm, chest, neck and spine. The block diagram of the
proposed method is shown in Fig. 1.
Fig.1 Block Diagram of the Proposed Work
3.1 Data Source
The X-ray images used extensively in this work have been
obtained from the following
(i) IRMA database of the Department of Diagnostic
Radiology, Aachen, Germany and
(ii) Department of Radiology of the Raja Muthaiah Medical
College and Hospital, Annamalai University.
3.2 Pre-Processing
In medical image processing, Pre-processing is mandatorily
to be done at inception so as to increase the reliability of the
optical inspection of the images, which can usually be done
by a variety of filters that aim at enhancement or
augmentation of the quality of images with a view to allow
room towards the further stages of processing. In this paper,
M3 filter has been incorporated for the pre-processing of
images, which is basically a combination of mean and
Medical Image Database
Pre-Processing using M3
Filter
Segmentation Using
EM algorithm
DWT Feature Extraction
View Classification using
SVM
View Classification using
PNN
3. IJRET: International Journal of Research in Engineering and Technology eISSN: 2319-1163 | pISSN: 2321-7308
_______________________________________________________________________________________
Volume: 04 Issue: 11 | Nov-2015, Available @ http://www.ijret.org 279
median filter, which performs far better than that of the
others in removing the noise by replacing the maximum
value of mean and median in the central pixel for each sub
images.
3.3 Segmentation
The success of image analysis depends on reliability of
segmentation, but an accurate partitioning of an image is
generally a very challenging problem. The goal is to
simplify the representation of the images and to find the
Region of Interest (RoI) that is found by applying EM
algorithm, which computes the estimation of maximum
likelihood of unknown parameters with the assumed
parameters.
The EM method is iterative that assumes the parameters
initially. Then, by using the feature value of the images, it
computes the mean, variance, probability density function
and normalized probability values in E-step. The new mean
and variance are calculated by using the above calculated
values in M-step. These steps are repeated until the model
resembles the behaviour described by the samples.
3.4 Feature Extraction
Feature extraction is a technique which is used to extract
and represent the contents of the X-ray images. In this work,
features are extracted using Discrete Wavelet Transform
(DWT). Wavelet decomposition is the first step in feature
extraction. This operation returns the wavelet decomposition
of the image at predefined scale using the wavelet. The
decomposition vector consists of one approximation
coefficient vector and three detail coefficient vector namely,
horizontal detail coefficients, vertical detail coefficients and
diagonal detail coefficients. In this work, vertical, horizontal
and approximate coefficient vectors have been taken upto
four levels using Haar coefficients.
3.5 View Classification
For the proposed method, the different views that are taken
into account are AP, lateral and oblique views, wherein for
the set of images of chest, skull, spine and neck, the AP and
lateral views are considered, while the oblique and AP are
extended towards the images of the foot and palm. The
aforesaid views of the X-ray images are detected using
PNN, decision tree algorithm and SVM. The three different
views so mentioned above are given in Fig. 2 (a) to (c) for
an example class of Chest X-ray images.
2(a) AP view 2(b) PA view 2(c) Lateral view
Fig.2 Views of X-ray images
3.6 Probabilistic Neural Network
The PNN is a feed forward neural network that implements
the Bayesian decision strategy for classifying input vector. It
consists of four layers namely Input layer, Pattern layer,
Summation layer and Output layer. PNN is often used in
classification problems. The architecture of PNN is shown
in Fig. 3.
Fig.3 Architectureof PNN
In this work, input layer is used to represent the input
pattern or feature vector, which is fully inter-connected with
the hidden layer that consists of the training data set. The
actual example vector serves as the weights as applied to the
input layer. In the summation layer the product of two
vectors from the hidden layer is summated to find its
average value. Finally, an output layer represents each of the
possible classes for which the input data can be classified.
In this work, the feature vectors „F‟ are taken as input and its
mean and variance „𝜎‟are computed to calculate weight „w‟
𝑤 = 𝑒
𝑥 − 𝑥11
𝜎
2
And this weight is multiplied with the input vector „F‟ in the
hidden layer.
𝐻 = 𝑊𝑖 𝐹
In summation layer „𝐶𝑗 ‟, the product of two vectors from the
hidden layers are summated and its average value is
computed.
𝑐𝑗 =
𝑒
(ℎ 𝑖−1)
𝛾2𝑁
𝑖=1
𝑁
The maximum of the average value is compared with the
values of the test image in the output layer. If the estimated
value is similar with the test value in the output layer, the
images are correctly classified, else it is mis-classified.
3.7 Decision Tree
Decision tree algorithm is a formal, structured approach to
making decision based on the rules. It helps to decompose a
complex problem into smaller and manageable
understanding. It is also non-parametric, because for each
class the distribution of the variable does not require any
assumptions. It consists of root node represented by 'T',
4. IJRET: International Journal of Research in Engineering and Technology eISSN: 2319-1163 | pISSN: 2321-7308
_______________________________________________________________________________________
Volume: 04 Issue: 11 | Nov-2015, Available @ http://www.ijret.org 280
Chance node or leaf node as 'C', and terminal node as 'T'.
Each class contains decision criteria based on one feature.
Features with close resemblance are used for the first split
and this procedure is repeated until there is no further split.
Decision tree is constructed from the training dataset, which
consists of objects described by the set of attributes and
class label. The class that is associated with leaf is the
output of the tree. The tree misclassifies the images, when
the output of the tree does not match with the class label.
The structure of the decision tree is shown in Fig. 4.
Fig.4 Architecture of Decision Tree
In this work, six chance nodes „𝑪 𝟏‟ to „𝑪 𝟔‟ represents the six
different classes of X-ray images namely chest, foot, palm,
skull, hand and spine based on the similarity measures using
City block distance.
𝐷 = 𝑥1 − 𝑥2 + 𝑦1 − 𝑦2, here 𝑥1, 𝑥2 is test image
and 𝑦1, 𝑦2 is database image.
The probability will be assigned to each branch emanating
from each chance node. Based on the probability, the two
terminal nodes 𝑇1 and 𝑇2 for each class are assigned for the
anterior view and lateral view. If the probability is greater
than 0.6 then the orientation of the X-ray images is said to
be anterior view else it is said to be of lateral or oblique
view.
3.8 Support Vector Machines
Support Vector Machine is a supervised machine learning
algorithm that uses kernel function to map linearly
inseparable data to linearly separable data by mapping given
data in higher dimension. A hyperplane is constructed in
such a way that the margin between the two classes is
maximum. The data vectors lying near the hyperplane are
called support vectors which are alone then classified rather
than considering all data points unlike clustering algorithms.
In this work, classification is employed in classifying two
categories namely anterior view and lateral view for chest,
skull, neck and spine, whereas AP and oblique for foot and
palm of X-ray images, in which two binary SVM classifiers
are created and trained to distinguish one class from the
other.
4. PERFORMANCE MEASURES
Several performance metrices are measured for the results of
classification such as sensitivity, specificity and accuracy.
The quality of classification is measured from a confusion
matrix which records correctly and incorrectly recognized
examples for each class. The actual and predicted cases
produced by classification system can be provided by a
confusion matrix and it is given in Table 1. TP is the number
of true positives, FP is the number of false positives, TN is
the number of true negatives and FN is the number of false
negatives. Accuracy measures the quality of the
classification by finding the true and false positives and true
and false negatives. Whereas sensitivity deals with only
positive cases and specificity deals with only negative cases.
TABLE 1 Confusion matrix on performance indices
Actual
Predicted
Positive Negative
Positive True positive False positive
Negative False Negative True Negative
The performance measures sensitivity, specificity, and
accuracy which are calculated as follows:
Accuracy =
𝑡𝑝+𝑡𝑛
𝑡𝑝+𝑡𝑛+𝑓𝑝+𝑓𝑛
Sensitivity =
𝑡𝑝
𝑡𝑝+𝑓𝑛
Specificity =
𝑡𝑛
𝑡𝑛+𝑓𝑝
The specificity and sensitivity are the two most important
characteristics in medical image analysis. Sensitivity deals
with only positive cases and specificity deals with only
negative cases, while the quality of the classification is
measured by using accuracy. Accuracy is generally regarded
with balanced measure whereas sensitivity deals with only
positive cases and specificity deals with only negative cases.
5. EXPERIMENTAL RESULT
For the experimental process, six classes of X-ray images
namely chest, foot, palm, skull, neck and spine of each of 30
images have been considered. Initially, the X-ray images are
preprocessed and segmented. The sample result of
preprocessed and segmented X-ray images is shown in Fig.
5(a) and Fig. 5(b). Features are extracted from the
segmented images and the extracted features are used to test
the X-ray images for the classification using PNN classifier,
Decision Tree and SVM classifier. In this paper, the SVM
with DWT features provides better accuracy than that of
PNN classifier and Decision tree algorithm. The result of the
performance measures for the PNN classifier, Decision Tree
Algorithm and SVM classifier is shown in Table 2, Table 3,
and Table 4 and the comparison between these three
classifiers for its performance is given in the Table 5.
5 (a) Preprocessed Image
5. IJRET: International Journal of Research in Engineering and Technology eISSN: 2319-1163 | pISSN: 2321-7308
_______________________________________________________________________________________
Volume: 04 Issue: 11 | Nov-2015, Available @ http://www.ijret.org 281
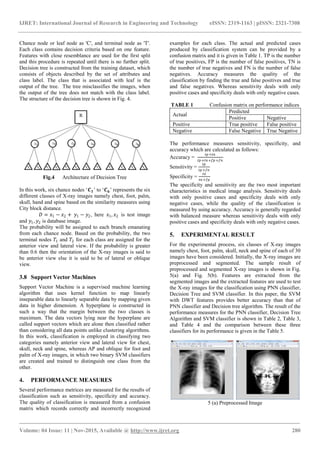
5(b) Segmented Image
Fig.5 Result of Preprocessed and Segmented X-ray
Images
TABLE 2 Performance measure for PNN
X-ray Image
Accuracy
(%)
Sensitivity
(%)
Specificity
(%)
Chest 85.71 71.43 100
Foot 71.43 57.14 85.71
Palm 64.29 57.14 71.43
Skull 78.57 85.71 71.43
Spine 78.57 71.43 85.71
Neck 71.43 71.43 71.43
Overall
Performance
75 69.04 80.95
TABLE 3 Performance measure of Decision Tree
X-ray Image
Accuracy
(%)
Sensitivity
(%)
Specificity
(%)
Chest 93.33 80 96
Foot 88.89 73.33 92
Palm 95.56 86.67 97.33
Skull 96.67 86.67 98.67
Spine 90 80 92
Neck 92.22 66.67 97.33
Overall
Performance
92.77 78.89 95.55
TABLE 4 Performance measure of SVM
X-ray Image
Accuracy
(%)
Sensitivity
(%)
Specificity
(%)
Chest 96.67 100 93.33
Foot 90 100 80
Palm 93.33 93.33 93.33
Skull 96.67 93.33 100
Spine 90 80 100
Neck 93.33 86.67 100
Overall
Performance
93.33 92.22 94.44
TABLE 5 Comparison between PNN, SVM and
Decision Tree
Classifier
Accuracy
(%)
Sensitivity
(%)
Specificity
(%)
PNN 75 69.04 80.95
SVM 93.33 92.22 94.44
Decision
Tree
92.77 78.89 95.55
CONCLUSION
In this paper, view classification of medical X-ray images
are automated by extracting DWT features. PNN classifier,
Decision Tree Algorithm and SVM classifier were used to
test the usefulness of the features in correctly classifying the
X-ray views. The result obtained for the five classes of X-
ray images are promising as obtained through SVM in terms
of accuracy for chest, foot, spine, neck and skull, whereas
for the palm, the accuracy yielded by Decision tree
algorithm has been proven better. Thus, the attempt has been
accomplished in this paper to bring out the view
classification for the different classes of X-ray images by a
couple of efficient classifiers, yet with very high accuracy.
REFERENCE
[1]. ShantalaPatill and Dr.KairanKumariPatil. “Roles of
Computer Vision, Image Processing and Pattern
Recognition in Health Application.” CSI
Communications, January 2014.
[2]. SumathiGanesanT.S.SubashiniE.Pavendhan,
“Automated Annotation Of X-Ray Images Using
Statistical Moment Features.” (IJAER),Volume 9,
Number 20 (2014) Special Issues, Pp.4395-4400.
[3]. Roy A, Sural S, Mukherjee J, Majumdar AK. State-
based modeling and object extraction from
echocardiogram video. Information Technology in
Biomedicine, IEEE Transactions on. IEEE;
2008;12(3):366–376.
[4]. Mohamed Ali Mahjoub1 KarimKalti 2 "Image
segmentation by Adaptive Distance Based on EM
algorithm"(IJACSA) International Journal of
Advanced Computer Science and Applications,
Special Issue on Image processing and Analysis May
2011.
[5]. M. Bugdol, J. Czajkowska, and E. Pietka, “A novel
model-based approach to left ventricle
segmentation,” in Computing in Cardiology (CinC).
Krakow, Poland: IEEE, 2012, pp. 561-564.
[6]. Balaji G.N, Subashini T.S, and Chidambaram
N.,"Detection of Heart Muscle Damage from
Automated Analysis of Echocardiogram video",
IETE Journal of Research, February 2015.
[7]. K. Vaidehi, T.S.Subashini, V. Ramalingam, S.
Palanivel, M. Kalaimani, “Transform based
approaches for Palmprint Identification”,
International Journal of Computer Applications, Vol.
41, No. 1, 2012
[8]. SumathiGanesan and T.S. Subashini, “An Approach
toward the Efficient Indexing and Retrieval on
Medical X-ray Images”, International Journal of
Computer Applications, Vol. 76, No. 12, PP: 7-10
2013.
[9]. Lowe, David G. "Distinctive image features from
scale-invariant keypoints." International journal of
computer vision 60, no. 2 (2004): 91-110.
[10]. Schiele B, Crowley JL. Recognition without
correspondence using multidimensional receptive
field histograms. International Journal of Computer
Vision. Springer; 2000;36(1):31–50.
6. IJRET: International Journal of Research in Engineering and Technology eISSN: 2319-1163 | pISSN: 2321-7308
_______________________________________________________________________________________
Volume: 04 Issue: 11 | Nov-2015, Available @ http://www.ijret.org 282
[11]. Balaji G.N, Subashini T.S, and Chidambaram N,
"Automatic classification of Cardiac Views in
Echocardiogram using Histogram and Statistical
Features" , ICICT 2014, ELSEVIER, Procedia
Computer Science.
[12]. Wei Li and Maosong Sun, "Automatic Image
Annotation Using Maximum Entropy Model",
IJCNLP 2005, LNAI 3651,pp. 34-45, 2005 Springer-
Verlag Berlin Heidelberg.
[13]. Dahab, Dina Aboul, Samy SA Ghoniemy, and Gamal
M. Selim. "Automated brain tumor detection and
identification using image processing and
probabilistic neural network techniques."
International Journal of Image Processing and Visual
Communication 1, no. 2 (2012): 1-8.
[14]. Ganesan, Sumathi, T. S. Subashini, and K.
Jayalakshmi. "Classification of X-rays using
statistical moments and SVM." In Communications
and Signal Processing (ICCSP), 2014 International
Conference on, pp. 1109-1112. IEEE, 2014.
[15]. http://www.imageclef.org/ImageCLEF2008