Download to read offline
![International Research Journal of Engineering and Technology (IRJET) e-ISSN: 2395 -0056
Volume: 04 Issue: 06 | June -2017 www.irjet.net p-ISSN: 2395-0072
© 2017, IRJET | Impact Factor value: 5.181 | ISO 9001:2008 Certified Journal | Page 1961
Brain Tumor detection and classification using Adaptive boosting
Abhishek Bargaje1,Ameya Kulkarni2,Shubham Lagad3,Aniruddha Gokhale4,Akshita Chanchlani5
1Abhishek Bargaje, Computer Engineering, Sinhgad Academy of Engineering, Pune, Maharashtra, India
2Ameya Kulkarni, Computer Engineering, Sinhgad Academy of Engineering, Pune, Maharashtra, India
3Shubham Lagad, Computer Engineering, Sinhgad Academy of Engineering, Pune, Maharashtra, India
4Aniruddha Gokhale, Computer Engineering, Sinhgad Academy of Engineering, Pune, Maharashtra, India
5Akshita Chanchlani, Computer Engineering, Sinhgad Academy of Engineering, Pune, Maharashtra, India
---------------------------------------------------------------------***---------------------------------------------------------------------
Abstract - MRI (Magnetic Resonance Imaging) is a medical
test to generate 2/3-dimensional images of body organs. This
technique produces clear and high quality images in various
medical image format, one of which is ‘.dcm’ which is being
used in the proposed system. For medical analysis and
interpretation, automated and accurateclassificationofbrain
MRI images is extremely important. Over the last decade
numerous methods have already been proposed. In thispaper,
we proposed a novel method to classify the MRI image as
normal or abnormal. The proposed system uses these images
for brain tumor detection by applying image processing
operations such as converting RGB image toGrayScaleimage,
Gray Scale image to Binary image. K-means clustering
algorithm is being used for tumor segmentation . An
important step in image analysis is the segmentation. These
segmented image is then passed further forfeatureextraction.
The feature extraction operation is performedontheobtained
images using Discrete Wavelet Transform(DWT). After the
features are extracted, the Principle Component Analysis
(PCA) operation is performed to reduce the dimensions of the
features. The classification of MRI images is done by using
Decision tree with adaptive boosting technique. The Decision
Tree is trained using the extracted and reduced features. Once
trained, this tree is then used to classify the brain MRI image
into normal or abnormal(Benign, Malignant). To increase the
accuracy of the system, adaptive boosting is used which
provides 100% accuracy. Also we have compared the system
with other systems and the comparative study is provided
below.
Key Words: MRI, Decision Tree, Classification, Image
Processing, Adaptive Boosting
1.Introduction
Imaging has strengthen the medical science through the
visualizing the structure of human anatomy. Some imaging
techniques are CT (computed tomography), PET (positron
emission tomography), X-Ray imaging, MRS (Magnetic
Resonance Spectroscopy) and MRI (Magnetic Resonance
Imaging) etc[6]. Brain MRI is taken using a scanner which
has strong magnets built-in which produces magnetic field
and radio waves that scan patient’s brain to produce high
quality images[7]. These images contain attributes like echo
time, repetition time, inversion time, slice information, flip
angle etc. which help doctor find whether that patient is
suffering from any brain related diseases or not. Magnetic
resonance imaging (MRI) is considered now asanimportant
tool for surgeons. It delivers high qualityimagesoftheinside
of the human body. A brain tumor is any intracranial mass
created by abnormal and uncontrolled cell division. Tumors
can destroy brain cells or damage them indirectlybycausing
inflammation, compressingotherpartsofthe brain,inducing
cerebral edema or by exerting internal pressure as they
grow.[10] These tumors can be classified into 2 types :
1) Benign and 2) Malignant.
Automated and accurate classificationofMRIbrainimagesis
extremely important for medical analysisandinterpretation.
Over the last few years many methods have already been
proposed. In this paper, we proposed a novel method to
classify a given brain MRI image as normal or abnormal and
predict the type of tumor. The proposed method first
employed discrete wavelet transform (DWT) to extract
features from images, followed by applying principle
component analysis (PCA) to reduce the dimensions of
features.[9] The reducedfeaturesweresubmittedtoBoosted
Decision Tree.
In this paper, a system is proposed for detecting brain
tumor.It also classifies the tumor(if present)into benignand
malignant. This system can be used to assist the neurologist
and radiologists. The flow of our system is as follows:
1) Upload test .dcm Image
2) Preprocessing
3) Segmentation (K-means)
4) Feature Extraction (DWT)
5) Feature Reduction (PCA)
6) Classification(Decision tree)
7) Tumor absent or present(Benign/Malignant)](https://image.slidesharecdn.com/irjet-v4i6373-180208071518/85/Brain-Tumor-Detection-and-Classification-using-Adaptive-Boosting-1-320.jpg)
![International Research Journal of Engineering and Technology (IRJET) e-ISSN: 2395 -0056
Volume: 04 Issue: 06 | June -2017 www.irjet.net p-ISSN: 2395-0072
© 2017, IRJET | Impact Factor value: 5.181 | ISO 9001:2008 Certified Journal | Page 1961
Brain Tumor detection and classification using Adaptive boosting
Abhishek Bargaje1,Ameya Kulkarni2,Shubham Lagad3,Aniruddha Gokhale4,Akshita Chanchlani5
1Abhishek Bargaje, Computer Engineering, Sinhgad Academy of Engineering, Pune, Maharashtra, India
2Ameya Kulkarni, Computer Engineering, Sinhgad Academy of Engineering, Pune, Maharashtra, India
3Shubham Lagad, Computer Engineering, Sinhgad Academy of Engineering, Pune, Maharashtra, India
4Aniruddha Gokhale, Computer Engineering, Sinhgad Academy of Engineering, Pune, Maharashtra, India
5Akshita Chanchlani, Computer Engineering, Sinhgad Academy of Engineering, Pune, Maharashtra, India
---------------------------------------------------------------------***---------------------------------------------------------------------
Abstract - MRI (Magnetic Resonance Imaging) is a medical
test to generate 2/3-dimensional images of body organs. This
technique produces clear and high quality images in various
medical image format, one of which is ‘.dcm’ which is being
used in the proposed system. For medical analysis and
interpretation, automated and accurateclassificationofbrain
MRI images is extremely important. Over the last decade
numerous methods have already been proposed. In thispaper,
we proposed a novel method to classify the MRI image as
normal or abnormal. The proposed system uses these images
for brain tumor detection by applying image processing
operations such as converting RGB image toGrayScaleimage,
Gray Scale image to Binary image. K-means clustering
algorithm is being used for tumor segmentation . An
important step in image analysis is the segmentation. These
segmented image is then passed further forfeatureextraction.
The feature extraction operation is performedontheobtained
images using Discrete Wavelet Transform(DWT). After the
features are extracted, the Principle Component Analysis
(PCA) operation is performed to reduce the dimensions of the
features. The classification of MRI images is done by using
Decision tree with adaptive boosting technique. The Decision
Tree is trained using the extracted and reduced features. Once
trained, this tree is then used to classify the brain MRI image
into normal or abnormal(Benign, Malignant). To increase the
accuracy of the system, adaptive boosting is used which
provides 100% accuracy. Also we have compared the system
with other systems and the comparative study is provided
below.
Key Words: MRI, Decision Tree, Classification, Image
Processing, Adaptive Boosting
1.Introduction
Imaging has strengthen the medical science through the
visualizing the structure of human anatomy. Some imaging
techniques are CT (computed tomography), PET (positron
emission tomography), X-Ray imaging, MRS (Magnetic
Resonance Spectroscopy) and MRI (Magnetic Resonance
Imaging) etc[6]. Brain MRI is taken using a scanner which
has strong magnets built-in which produces magnetic field
and radio waves that scan patient’s brain to produce high
quality images[7]. These images contain attributes like echo
time, repetition time, inversion time, slice information, flip
angle etc. which help doctor find whether that patient is
suffering from any brain related diseases or not. Magnetic
resonance imaging (MRI) is considered now asanimportant
tool for surgeons. It delivers high qualityimagesoftheinside
of the human body. A brain tumor is any intracranial mass
created by abnormal and uncontrolled cell division. Tumors
can destroy brain cells or damage them indirectlybycausing
inflammation, compressingotherpartsofthe brain,inducing
cerebral edema or by exerting internal pressure as they
grow.[10] These tumors can be classified into 2 types :
1) Benign and 2) Malignant.
Automated and accurate classificationofMRIbrainimagesis
extremely important for medical analysisandinterpretation.
Over the last few years many methods have already been
proposed. In this paper, we proposed a novel method to
classify a given brain MRI image as normal or abnormal and
predict the type of tumor. The proposed method first
employed discrete wavelet transform (DWT) to extract
features from images, followed by applying principle
component analysis (PCA) to reduce the dimensions of
features.[9] The reducedfeaturesweresubmittedtoBoosted
Decision Tree.
In this paper, a system is proposed for detecting brain
tumor.It also classifies the tumor(if present)into benignand
malignant. This system can be used to assist the neurologist
and radiologists. The flow of our system is as follows:
1) Upload test .dcm Image
2) Preprocessing
3) Segmentation (K-means)
4) Feature Extraction (DWT)
5) Feature Reduction (PCA)
6) Classification(Decision tree)
7) Tumor absent or present(Benign/Malignant)](https://image.slidesharecdn.com/irjet-v4i6373-180208071518/75/Brain-Tumor-Detection-and-Classification-using-Adaptive-Boosting-1-2048.jpg)
![International Research Journal of Engineering and Technology (IRJET) e-ISSN: 2395 -0056
Volume: 04 Issue: 06 | June -2017 www.irjet.net p-ISSN: 2395-0072
© 2017, IRJET | Impact Factor value: 5.181 | ISO 9001:2008 Certified Journal | Page 1962
2.System Description
2.1 Pre-processing
When an image is given as input in the proposed
system :
Resize the image into compatible
dimensions.
Convert the given image into Gray Scale by
eliminating the hue and saturation
information while retainingtheluminance.
Calculate a global threshold which is used
to convert the grayscale image into Binary
image. This threshold is a normalized
intensity value that lies in the range 0-1.
Using this threshold, the image can be
converted into binary image.The output
image has values of 1 (white) for all pixels
with luminance greater than threshold
value and 0 (black) for rest pixels.
2.2 Segmentation
An important step in image analysis is the segmentation.
Segmentation methods are divided into eight categories
namely; thresholding approaches, region growing
approaches, classifiers, clustering approaches, Markov
random field models, artificial neural networks,
deformable models, and atlas-guided approaches.[11] In
this system, we have used K-means clustering algorithm
for tumor segmentation. This approach first calculates the
Euclidean distance between centroid of k clusters and
pixels and assigns the pixels to respective cluster based on
this value.
2.3 Feature Extraction
Since 2D images are taken as input, the proposed system
uses the Discrete Wavelet Transform (DWT) for feature
extraction. It performs single level 2D wavelet
decomposition with respect to a particular wavelet. The
wavelet used is daubechies wavelet 4 for wavelet
decomposition. The input is taken asa 2Dmatrixofpixelsfor
DWT. After applying DWT on this matrix we get an
approximationcoefficients matrixCAanddetailedcoefficient
matrices CD,CV,CH as shown in the figure below.
Again DWT is applied on the approximation coefficient
matrix for 2 times. The final output is a compressed image
from which noise is removed. Here the feature extraction
part ends and the final approximation coefficient matrix is
the output of this step.
2.4 Feature Reduction
For feature reduction the proposed system uses principal
component analysis(PCA).Given a set of data, PCA finds the
linear lower-dimensional representation of the data such
that the variance of the reconstructed data is preserved.The
output of feature extraction step is taken as input forfeature
reduction step. The output of PCA is a matrix of principal
component coefficients also called as loadings. Each column
of this matrix contains coefficients for one principal
component and the columns are in descending order of
component variance. PCA centers the data and uses the
singular value decomposition (SVD) algorithm.
Objectives of principal component analysis
1) To discover or to reduce the dimensionality of the data
set.
2) To identify new meaningful underlying variables.
This leads to more efficient and accurate classifier. The
feature extraction process was carried out through two
steps: firstly the wavelet coefficients were extracted by the
DWT and then the essential coefficients have been selected
by the PCA.[1]
2.5 Classification
After feature reduction we getfollowingparameter:
1) Contrast
2) Correlation
3) Energy
4) Homogeneity
5) Mean
6) Standard Deviation
7) Entropy](https://image.slidesharecdn.com/irjet-v4i6373-180208071518/85/Brain-Tumor-Detection-and-Classification-using-Adaptive-Boosting-2-320.jpg)
![International Research Journal of Engineering and Technology (IRJET) e-ISSN: 2395 -0056
Volume: 04 Issue: 06 | June -2017 www.irjet.net p-ISSN: 2395-0072
© 2017, IRJET | Impact Factor value: 5.181 | ISO 9001:2008 Certified Journal | Page 1964
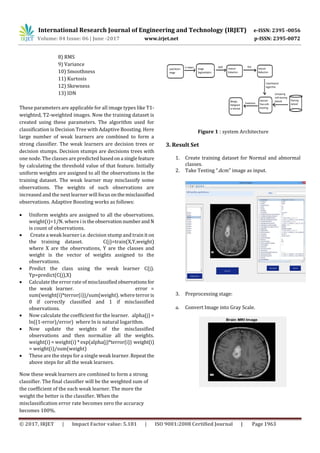
b. Convert Gray scale image into Binary image.
4. Apply Segmentation.
5. Feature Extraction using Discrete Wavelet
Transform(DWT).
6. Feature Reduction using Principal Component
Analysis(PCA).
7. Classification using Decision Tree with Adaptive
Boosting.
4. Comparative Study
Algorithms Accuracy %
Boosted Decision Tree 100
Naive Bayes 88.2
Probabilistic Neural
Network
88.2
SVM with Quadratic kernel 96
5.Conclusion
This system can be helpful for neurologist or radiologist to
help analyze the MRI image. Thus we have proposed a
system which uses decision tree with adaptive boosting
algorithm to classify the given MRI image into Abnormal or
Normal classes. This is done using various parameters like
Contrast, Co-relation, Mean, Std. Deviation, Entropy, etc.
which are obtained by preprocessing techniques like K-
means, DWT,PCA algorithms. These parameters are then
used to create Decision Trees which allow classification.
Also, weak parameters are combined together using
boosting which forms a strong learner for classification.This
increases the accuracy of the system without needing extra
resources. When classification is done the given images gets
classified into Normal orAbnormal(i.e.MalignantorBenign).
In Future, Various other functionalities like predicting the
stage of the tumor, possible medications suggestion canalso
be added.
6.REFERENCES
[1]http://www.radiologyinfo.org/
[2]http://www.webmd.com/brain/magnetic-resonance-
imaging-mri-of-the-head
[3] http://spinwarp.ucsd.edu/neuroweb/text/br-100.htm
[4] http:// mrimaster.com/](https://image.slidesharecdn.com/irjet-v4i6373-180208071518/85/Brain-Tumor-Detection-and-Classification-using-Adaptive-Boosting-4-320.jpg)
![International Research Journal of Engineering and Technology (IRJET) e-ISSN: 2395 -0056
Volume: 04 Issue: 06 | June -2017 www.irjet.net p-ISSN: 2395-0072
© 2017, IRJET | Impact Factor value: 5.181 | ISO 9001:2008 Certified Journal | Page 1965
[5] http://mri-q.com/tr-and-te.html
[6] An efficient approach for classification of brain mri
images - Shiva Ram Krishna - international journal of
advanced research in computer science and software
engineering-nov2015
[7] Tumor detection and classification using decision tree in
brain mri – Janki Naik and Sagar Patel | issn: 2321-9939
[8] Multiparameter segmentation and quantization of brain
tumor from mri images indian journal of science and
technology vol.2 no 2 (feb. 2009) issn: 0974- 6846
[9] Brain tumor mri image classification with feature
selection and extraction using linear discriminant analysis -
V.P.Gladis Pushpa Rathi and dr.S.P alani
[10] brain mri image classification usingprobabilisticneural
network and tumor detection using image segmentation-
prof. N.D.Pergad, ms. Kshitija V.Shingare -international
journal of advanced research in computer engineering &
technology (ijarcet) volume 4 issue 6, june 2015
[11] Brain tumor detection and identificationusingk-means
clustering technique - malathi r , dr. Nadirabanu kamal a r -
proceedings of the ugc sponsored national conference on
advanced networking and applications, 27th march 2015
[12] Classification of mri brain images using neuro fuzzy
model- mr. Lalit p. Bhaiya , ms. Suchita goswami , mr. Vivek
pali - international journal of engineering inventions issn:
2278-7461, www.ijeijournal.com volume 1, issue 4
(september 2012)
[13] Automated classification and segregation of brain mri
images into images captured with respect to ventricular
region and eye-ball region - c. Arunkumar , sadam r.
Husshine , v.p. Giriprasanth and arun b. Prasath -ictact
journal on image and video processing, may 2014, volume:
04, issue: 04
[14] A hybrid method for brain mri classification
yudong zhang , zhengchao dong, lenan wu,shuihuawang
- expert systems with applications volume 38, issue 8,
august 2011
[15] A hybrid approach for automatic classification of brain
mri using genetic algorithm and support vector machine -
ahmed kharrat, karim gasmi , mohamed ben messaoud ,
nacéra benamrane and mohamed abid - leonardo journal of
sciences issn 1583-0233 issue 17, july-december 2010](https://image.slidesharecdn.com/irjet-v4i6373-180208071518/85/Brain-Tumor-Detection-and-Classification-using-Adaptive-Boosting-5-320.jpg)

1. The document describes a system for detecting and classifying brain tumors using MRI images. 2. The system uses techniques like preprocessing, segmentation using k-means clustering, feature extraction with discrete wavelet transform and principal component analysis for dimension reduction, and classification with decision trees and adaptive boosting. 3. Adaptive boosting combines multiple weak learners or decision trees into a strong classifier and focuses on misclassified examples to improve accuracy, achieving 100% accuracy for tumor detection and classification in the system.