SlideShare a Scribd company logo
1 of 61
1
BY – VISHAL SINGH SOLANKI
IDEAL INSTITUTE OF PHARMACY, MH
 Electromagnetic radiation
Energy of an EMR
Electromagnetic spectrum & it’sregions
 Spectroscopy & it’stypes
 Colorimetry
UV-spectroscopy
 Electronic transitions
Terms used in UV-Visiblespectroscopy
Absorption band & it’stypes 2
 Electromagneticradiation is a typeof energy that is
transmitted through spaceatenormousvelocities.
 Radiant energy has wave nature and being associated
with electric as well as magnetic field,these radiations
are called electromagneticradiation.
 Electromagnetic radiation has it’s origin in atomic and
molecularprocesses.
3
 The field may be represented as electricand magnetic
vectors oscillating in mutually perpendicular planes.
4
 The energy of an EMR can be given by the following
equation: E=hµ
Where E= Energy of radiation
h=Planck’sconstant
µ=Frequency of radiation
5
Frequency(µ)= c/λ
6
:-Hence, E=hµ
E=hc/λ
Therefore,energy of a radiation depends uponfrequency
and wavelength of radiation.
The arrangement obtained by arranging various types of
electromagneticwavesorradiations in orderof their
increasing wavelegth or decreasing frequencies is called
electromagnetic spectrum.
The electromagnetic spectrum is divided into a number
of regions; these are artificial divisions in the sense that
they have been defined solely as a result of differences in
the instrumentation required for producing and detecting
radiation of agiven frequency range.
7
8
 Ultraviolet: 190~400nm
 Violet:
 Indigo:
400 - 420 nm
420 - 440 nm
 Blue:
 Green:
440 - 490 nm
490 - 570 nm
 Yellow:
 Orange:
570 - 585 nm
585 - 620 nm
 Red: 620 - 780 nm 9
10
Spectroscopy is the measurement and
interpretation of electromagnetic radiation
absorbed oremitted when the moleculesor
atoms or ions of a sample moves from one
energy state toanotherenergy state
11
1) Atomic spectroscopy:Here, the changes in energy takes
place at atomic level.
Eg: Atomic absorption spectroscopy, Flame
photometry
2)Molecular spectroscopy:Here,the changes in energy takes
place at molecular level.
Eg: UV spectroscopy, colorimetry, infrared
spectroscopy
12
Absorption spectrophotometry can be
defined as the measurement of absorption of radiant
energy by various substances.It involves the
measurementof absorptivecapacity forradiant energy
in thevisible,UVand IR regions of thespectrum.
13
o λ- 400-800nm
o Coloured substance absorbs light of different λin
different manner and hence get an absorption curve
o Theλatwhich maximum absorption takes place is called as
λmax
o λmax is characteristic for every colouredsubstance
o On plotting a graph of concentration v/s absorbance, we
getacalibration curve that is useful in determining the
concentration or amount of a drug substance in the given
samplesolution. 14
15
 UV spectroscopy is concerned with thestudyof absorption
of uv radiation which ranges from200-400nm.
 Valenceelectronsabsorb theenergy thereby molecules
undergoes transition from ground state to excited
state.
 This absorption ischaracteristic and dependson the
nature of electronspresent.
 Types of e- σ electrons:
π electrons:
n electrons:
in saturated compounds
in unsaturatedcompounds
in non bondedelectrons 16
17
 σ electron from orbital is excited tocorresponding
anti-bonding orbitalσ*.
 Theenergy required is large for this transition.
 The organic compounds in which all the valence shell
electrons are involved in the formation of σ bond do
notshowabsorption in normal uvregion (200-400nm)
 This transition is observed with saturated compounds. 18
 Eg: Methane(CH₄) has C-H bond only and can undergoσ-
σ* transition and shows absorption maximaat 122nm.
 The usual spectroscopic technique cannot beused below
200 nm.
 Tostudy this high energy transition,theentire region
should be evacuated (Vacuum uvregion)
 Here,theexcitation ocuurs with net retention of electronic
spin
 This region is lessinformative
19
1) σ-σ*
 π electron in a bonding orbital is excited to
corresponding anti-bonding orbitalπ*.
 Energy required is less whencompared to n-σ*
 Compounds containing multiple bondslike
alkenes,alkynes,carbonyls,nitriles,aromatic
compounds etc undergo π-π*transition.
Eg:Alkenesgenerallyabsorb in the region 170-205nm.
20
 Absorption usuallyoccurs in theordinary uv
spectrophotometer
 Absorption bands in unconjugated alkenes(170-
190nm)
 Absorption bands in carbonyls (180nm)
 Introductionof alkyl group in olefinic linkage
produces bathochromicshift
21
2) π-π*
 Saturated compoundscontaining one heteroatom
with unshared pair of electrons(n) like O,N,S and
halogens arecapableof n-σ* transition.
 These transition require lessenergy than σ-σ*
transition.
 In saturated alkyl halides, the energy required for
transition decreasewith increase in the size of halogen
atom (or decrease inelectronegativity)
22
 Eg:Methyl chloride has aλmax of 173nm.
Methyl iodide has aλmax of 258nm.
 This typeof transition isvery sensitive to hydrogen
bonding
Eg: Alcohol & amines
 Hydrogen bonding shift the uvabsorptions to
shorterwavelength.
23
3) n-σ*
 An electron from non-bonding orbital is promoted to
anti-bonding π* orbital.
 Compounds containing double bondsinvolving
hetero atoms(C=O,N=O) undergo such type of
transitions.
 This transition require minimumenergy outof all
transitions and shows absorption band at longer
wavelength around 300nm.
24
 Eg:Saturated aldehydes shows both type oftransitions
(n-π*, π-π*) at {lowenergy and high energy}
around 290 and 180 nm.
25
4) n-π*
26
 Chromophore is defined as the nucleus or any
isolated covalently bonded group responsible for the
absorption of lightradiation.
 Any group which exhibits absorption of
electromagneticradiations in thevisibleorultraviolet
region.
C=C , C=O ,NO2 etc
 Some of the important chromophores are
carbonyls,acids,esters,nitrile,ethylenicgroups.
27
28
 These are co-ordinatively saturated or un-saturated
groupswhich themselvesdo notabsorb radiations,but
when presentalongwith achromophoreenhances the
absorbing properties of chromophore.
 Also knownas colourenhancing group.
 All auxochromes haveoneor more non-bonding pair
of electrons.
-NH2 ,-OH ,-OR,-COOH etc
 Itextend theconjugationof a chromophore bysharing
the non-bonding electrons. 29
30
31
 When the absorption maxima(λmax)of acompound
shifts to longer wavelength,it is known as
bathochromic shift orred shift.
 The effect is due to the presenceof auxochromeor by
change of solvent.
 Eg: The n-π* transition for carbonyl compounds
experiences bathochromic shift when the polarityof
solvent isdecreased.
32
 When theabsorption maxima (λmax) of a compound
shifts to a shorter wavelength,it is known as
hypsochromic shift or blueshift.
 Theeffect is due to the presenceof a groupcauses
removal of conjugationor bychangeof solvent.
33
Eg:
Aniline shows blueshift in acidic medium since it loses
conjugation. Aniline(280nm) & Anilinium ion (-
203nm).
34
35
36
37
38
 The spectrum consist of sharp peaks and each peak will
correspond to the promotion of electron from one
electronic level toanother.
 During promotion,the electron moves from a given
vibrational and rotational level within one electronicmode
to theotherwithin the nextelectronic mode.
 Thus,therewill bea large no of possible transitions
 Hence,not justone but a large no. of wavelengthswhich
are close enough will be absorbed resulting in the
formation of bands
39
40
K-Bandsoriginatedue toπ-π* transition from a
compound containing a conjugatedsystem
Such typeof bandsarise in compounds like
dienes,polyenes and enonesetc.
Compound Transition λmax(nm) εmax
Acetophenone π-π* 240 13,000
1,3-butadiene π-π* 217 21,000
R-Band transition originatedue to n-π* transition of a
single chromophoric group and having atleast one
lone pairof electronson the heteroatom
Theseare less intensewith εmax value below 100
Compound Transition λmax(nm) εmax
Acetone n-π* 270 15
Acetaldehyde n-π* 293 12
41
Such typeof bandsarisedue toπ-π* transition in
aromatic or hetero-aromaticmolecules.
Benzene shows absorption peaks between 230-
270nm.when achromophoricgroup is attached to the
benzene ring ,the B-Bands are observed at longer
wavelengths than the more intenseK-Bands.
Compound Transition λmax(nm) εmax
Benzene π-π* 255 215
Phenol π- π* 270 1450
42
E-Band originate due to the electronic transitions in
the benzenoid systemsof threeethylenic bondswhich
are in closed cyclicconjugation.
Theseare furthercharacterized as E1 and E2 bands
E1 band which appearat shorterwavelength is usually
more intense than the E2 band for the same
compound which appearsat longerwavelength.
Compound E1 Band E1 Band E2 Band E2 Band
λmax(nm) εmax λmax(nm) εmax
Benzene 184 50,000 204 79,000
Napthalene 221 133,000 286 9,300
43
44
BEER’S LAW
According to this law,when a beam of monochromatic
radiation is passed through a solution of absorbing species,the
intensity of beam of monochromatic light decreases exponentially
with increase in concentration of absorbing species
LAMBERT’S LAW -dI/dc α I
Lambert’s law states that the rate of decrease of
intensity of monochromatic light with the thickness of the
medium is directly proportional to the intensity of incident
light.
-dI/dt α I
45
According to beer’s law,
-dI α I
dc
The decrease in the intensity of light (I) with
concentration(c) is proportional to intensityof
incident light(I)
-dI = K.I
dc
{ removing & introducing the
constant of proportionality
“K”}
-dI = K.dc { rearranging terms}
I 46
 When concentration =0, there is no
absorbance,Hence I=I₀ Substituting in
equation 
 -ln I₀ = K*0+b
 -ln I₀ = b
 Substituting the value of b in
equation
I
-ln I = K.c + b  { b constantof integration}
47
I₀ = ekc { removing natural log }
I
I
I₀
= e-kc {making inverse on bothsides}
 [equation for beer’slaw]
According to lambert’s law,
-dI α I
dt
This eqn can be simplified by replacing ‘c’ with ‘t’ in
I = I₀e-kt 
Eqn  &  can be combined toget I = I₀e-kct 48
I = ₁₀-kct { rearranging terms }
I₀
{ inverse on bothsides}
I₀ = ₁₀kct
I
Taking log on both sides,
log I₀ = Kct 
I
Here, TransmittanceT = I₀ , Absorbance,A = log 1
I T 49
A = log 1
T
A = log 1 { Since T = I₀ }
I/I₀ I
A =log I₀ 
I
Using eqn  & , since A =log I₀ and
I
log I₀ = Kct ,
I
A= Kct
Instead of K, we can useε
A = εct {Mathematical eqn for beerlambert’s
law} 50
51
52
There are 3 typesof deviations usuallyobserved
A)The real limitationof the law is that the beer’s law is
successful in describing the absorption behaviour of
dilute solutionsonly.
B)CHEMICAL DEVIATIONS:
Association of molecules
This can be explained by taking the examples of
methylene blueat small concentration(10‾⁵ molar) and 53
 Dissociation of molecules
This can beexplained by the fact thatdichromate
ions posses their maximum absorbance at 450nm
which is orange in colour .Butupondilution,itwill be
dissociated to chromate ions having maximum
absorbanceat 410nm which is yellow in colour.
This law is notvalid in case if theabsorbing material
is coagulated intoa small numberof large units.
This law showsdeviation if theabsorbing material at 54
 This law is notapplicable in caseof suspension.
C)INSTRUMENTAL DEVIATIONS:
Strict adherence of an absorbing system to this law is
observed only when theradiation used is monochromatic.
Strayradiation,slitwidth also causes deviation.
Hence,the reasons for the deviation depends on
environment such astemperature,pressure,solvent, 55
 Absorbance
0.800
λ=430nm
0.600 λ=570nm
0.400
0.200
0.00
0.00 4.00 8.00 12.00 16.00 concentration
56
 Absorbance
0.800 ε=1000 ε=1500
0.600
ε=1750
0.400
0.200
0.00 2.0 4.0 6.0 8.0 10.0 concentration
57
 2.0
0.0%
0.2%
 1%
 1.0 5%
 0

2.5 5.0 7.5 10 concentration
58
1)Elementary organic spectroscopy,principles &chemical
applications,Y.R Sharma,Revised edition,pg n.o
18,26,27
2) Pharmaceutical chemistry,Instrumental
techniques,vol 2,Leslie.G.chatten,pg n.o 21-24
3) Principles and practice of analyticalchemistry,F.W
Fifield & D.kealey, 5th edition ,pg n.o270-274
4) Pharmaceutical analysis,P.Parimoo, pg n.o
147,151,152,165 59
 6)Instrumental analysis,Skoog,Holler,Crouch, pg
no.383,386
 7)Practical pharmaceutical chemistry,4th edition,partv
2, Beckett ,stenlake, pg n.o275-277
60

61


More Related Content

What's hot

Absorption and intensity shift
Absorption and intensity shiftAbsorption and intensity shift
Absorption and intensity shiftAfrina Jasy
 
Transition in ultraviolet and visible light
Transition in ultraviolet and visible lightTransition in ultraviolet and visible light
Transition in ultraviolet and visible lightMzgin Mohammed
 
Uv visible spectroscopy- madan
Uv visible spectroscopy- madanUv visible spectroscopy- madan
Uv visible spectroscopy- madanMadan Sigdel
 
Ultraviolet spectroscopy (UV)
Ultraviolet spectroscopy (UV)Ultraviolet spectroscopy (UV)
Ultraviolet spectroscopy (UV)Mona Ismail
 
UV Spectroscopy and Its Applications
UV Spectroscopy  and Its ApplicationsUV Spectroscopy  and Its Applications
UV Spectroscopy and Its ApplicationsVikram Choudhary
 
infrared spectroscopy and factors effecting the IR
infrared spectroscopy and factors effecting the IRinfrared spectroscopy and factors effecting the IR
infrared spectroscopy and factors effecting the IRBakhtawarRasheed
 
Optical rotatory dispersion and circular dichroism presentation
Optical rotatory dispersion and circular dichroism presentationOptical rotatory dispersion and circular dichroism presentation
Optical rotatory dispersion and circular dichroism presentationChaitrali Jadhav
 
Fluorescence and phosphorescence
Fluorescence and phosphorescenceFluorescence and phosphorescence
Fluorescence and phosphorescenceSamawiaIqbal
 
The absorption band
The absorption bandThe absorption band
The absorption bandAfrina Jasy
 
UV Visible Spectroscopy
UV Visible SpectroscopyUV Visible Spectroscopy
UV Visible Spectroscopykrishslide
 
Uv visible spectroscopy
Uv visible spectroscopyUv visible spectroscopy
Uv visible spectroscopyNilesh Thakare
 
UV visible spectroscopy ( electronic spectroscopy)
UV visible spectroscopy ( electronic spectroscopy)UV visible spectroscopy ( electronic spectroscopy)
UV visible spectroscopy ( electronic spectroscopy)ushaSanmugaraj
 
Infrared Spectroscopy (IR) - Overview & Interpretation
Infrared Spectroscopy (IR) - Overview & InterpretationInfrared Spectroscopy (IR) - Overview & Interpretation
Infrared Spectroscopy (IR) - Overview & InterpretationManoj Prajapati
 

What's hot (20)

Absorption and intensity shift
Absorption and intensity shiftAbsorption and intensity shift
Absorption and intensity shift
 
UV-VISIBLE SPECTROSCOPY
UV-VISIBLE SPECTROSCOPYUV-VISIBLE SPECTROSCOPY
UV-VISIBLE SPECTROSCOPY
 
Transition in ultraviolet and visible light
Transition in ultraviolet and visible lightTransition in ultraviolet and visible light
Transition in ultraviolet and visible light
 
Uv visible spectroscopy- madan
Uv visible spectroscopy- madanUv visible spectroscopy- madan
Uv visible spectroscopy- madan
 
Ultraviolet spectroscopy (UV)
Ultraviolet spectroscopy (UV)Ultraviolet spectroscopy (UV)
Ultraviolet spectroscopy (UV)
 
Electronic transition.pptx
Electronic transition.pptxElectronic transition.pptx
Electronic transition.pptx
 
Presentation2
Presentation2Presentation2
Presentation2
 
UV Spectroscopy and Its Applications
UV Spectroscopy  and Its ApplicationsUV Spectroscopy  and Its Applications
UV Spectroscopy and Its Applications
 
CHM260 - UV-VIS
CHM260 - UV-VISCHM260 - UV-VIS
CHM260 - UV-VIS
 
infrared spectroscopy and factors effecting the IR
infrared spectroscopy and factors effecting the IRinfrared spectroscopy and factors effecting the IR
infrared spectroscopy and factors effecting the IR
 
Optical rotatory dispersion and circular dichroism presentation
Optical rotatory dispersion and circular dichroism presentationOptical rotatory dispersion and circular dichroism presentation
Optical rotatory dispersion and circular dichroism presentation
 
Uv visible spectroscopy
Uv visible spectroscopyUv visible spectroscopy
Uv visible spectroscopy
 
Fluorescence and phosphorescence
Fluorescence and phosphorescenceFluorescence and phosphorescence
Fluorescence and phosphorescence
 
Uv absorption spectroscopy
Uv absorption spectroscopyUv absorption spectroscopy
Uv absorption spectroscopy
 
The absorption band
The absorption bandThe absorption band
The absorption band
 
UV Visible Spectroscopy
UV Visible SpectroscopyUV Visible Spectroscopy
UV Visible Spectroscopy
 
Uv visible spectroscopy
Uv visible spectroscopyUv visible spectroscopy
Uv visible spectroscopy
 
UV visible spectroscopy ( electronic spectroscopy)
UV visible spectroscopy ( electronic spectroscopy)UV visible spectroscopy ( electronic spectroscopy)
UV visible spectroscopy ( electronic spectroscopy)
 
Application of ir
Application of irApplication of ir
Application of ir
 
Infrared Spectroscopy (IR) - Overview & Interpretation
Infrared Spectroscopy (IR) - Overview & InterpretationInfrared Spectroscopy (IR) - Overview & Interpretation
Infrared Spectroscopy (IR) - Overview & Interpretation
 

Similar to uv-visible spectroscopy also available video lecture on youtube channel name - PHARMA RISING

Uv visible spectroscopy ppt
Uv visible spectroscopy pptUv visible spectroscopy ppt
Uv visible spectroscopy pptAlexa Jacob
 
uv-visiblespectroscopy final.pptx
uv-visiblespectroscopy final.pptxuv-visiblespectroscopy final.pptx
uv-visiblespectroscopy final.pptxRagisha Thomas
 
UV- VISIBLE-NIR spectroscopy-IIT DHANBAD
UV- VISIBLE-NIR spectroscopy-IIT DHANBADUV- VISIBLE-NIR spectroscopy-IIT DHANBAD
UV- VISIBLE-NIR spectroscopy-IIT DHANBADSHIV SHANKAR
 
UV Visible Spectroscopy
UV Visible SpectroscopyUV Visible Spectroscopy
UV Visible SpectroscopySimranDhiman12
 
Uv vis spectroscopy for ktu students
Uv vis spectroscopy for ktu studentsUv vis spectroscopy for ktu students
Uv vis spectroscopy for ktu studentsSiju N Antony
 
Uv visible sprctroscopy ppt
Uv visible sprctroscopy pptUv visible sprctroscopy ppt
Uv visible sprctroscopy pptnehla313
 
UV VISIBLE SPECTRO Final.pptx
UV VISIBLE SPECTRO Final.pptxUV VISIBLE SPECTRO Final.pptx
UV VISIBLE SPECTRO Final.pptxHemantThakare8
 
Uv spectroscopy
Uv spectroscopy Uv spectroscopy
Uv spectroscopy Rokon khan
 
U1 C1 UV Spectroscopy.pptx
U1 C1 UV Spectroscopy.pptxU1 C1 UV Spectroscopy.pptx
U1 C1 UV Spectroscopy.pptxAnkita Raikwar
 
Uv visible spectroscopy with Instrumentation
Uv visible spectroscopy with InstrumentationUv visible spectroscopy with Instrumentation
Uv visible spectroscopy with InstrumentationSHIVANEE VYAS
 
Uvvisiblespectroscopy 130121115849-phpapp02
Uvvisiblespectroscopy 130121115849-phpapp02Uvvisiblespectroscopy 130121115849-phpapp02
Uvvisiblespectroscopy 130121115849-phpapp02gufy ssah
 
uvvisiblespectroscopy-130121115849-phpapp02.pptx
uvvisiblespectroscopy-130121115849-phpapp02.pptxuvvisiblespectroscopy-130121115849-phpapp02.pptx
uvvisiblespectroscopy-130121115849-phpapp02.pptxTridevSastri1
 
UV spectrometery; woodward fischer rule
UV spectrometery; woodward fischer ruleUV spectrometery; woodward fischer rule
UV spectrometery; woodward fischer ruleAJAYKUMAR4872
 
uv spectroscopy by HARVINDAR SINGH .M.PHARM PHARMACEUTICS
 uv spectroscopy by HARVINDAR SINGH .M.PHARM PHARMACEUTICS uv spectroscopy by HARVINDAR SINGH .M.PHARM PHARMACEUTICS
uv spectroscopy by HARVINDAR SINGH .M.PHARM PHARMACEUTICSHarevindarsingh
 
Uv visible spectroscopy
Uv visible spectroscopyUv visible spectroscopy
Uv visible spectroscopyPALANIANANTH.S
 
Ultraviolet and visible spectrophotometer and Its application in pharmaceutic...
Ultraviolet and visible spectrophotometer and Its application in pharmaceutic...Ultraviolet and visible spectrophotometer and Its application in pharmaceutic...
Ultraviolet and visible spectrophotometer and Its application in pharmaceutic...nikhil kadam
 
1.b. pharm uvvisiblespectroscopy jntu pharmacy
1.b. pharm uvvisiblespectroscopy jntu pharmacy1.b. pharm uvvisiblespectroscopy jntu pharmacy
1.b. pharm uvvisiblespectroscopy jntu pharmacyDr. Suman Pattanayak
 

Similar to uv-visible spectroscopy also available video lecture on youtube channel name - PHARMA RISING (20)

Uv visible spectroscopy ppt
Uv visible spectroscopy pptUv visible spectroscopy ppt
Uv visible spectroscopy ppt
 
uv-visiblespectroscopy final.pptx
uv-visiblespectroscopy final.pptxuv-visiblespectroscopy final.pptx
uv-visiblespectroscopy final.pptx
 
UV- VISIBLE-NIR spectroscopy-IIT DHANBAD
UV- VISIBLE-NIR spectroscopy-IIT DHANBADUV- VISIBLE-NIR spectroscopy-IIT DHANBAD
UV- VISIBLE-NIR spectroscopy-IIT DHANBAD
 
UV Visible Spectroscopy
UV Visible SpectroscopyUV Visible Spectroscopy
UV Visible Spectroscopy
 
Uv vis spectroscopy for ktu students
Uv vis spectroscopy for ktu studentsUv vis spectroscopy for ktu students
Uv vis spectroscopy for ktu students
 
UV-Visible Spectroscopy.pptx
UV-Visible Spectroscopy.pptxUV-Visible Spectroscopy.pptx
UV-Visible Spectroscopy.pptx
 
Uv visible sprctroscopy ppt
Uv visible sprctroscopy pptUv visible sprctroscopy ppt
Uv visible sprctroscopy ppt
 
UV VISIBLE SPECTRO Final.pptx
UV VISIBLE SPECTRO Final.pptxUV VISIBLE SPECTRO Final.pptx
UV VISIBLE SPECTRO Final.pptx
 
Uv spectroscopy
Uv  spectroscopyUv  spectroscopy
Uv spectroscopy
 
Uv spectroscopy
Uv spectroscopy Uv spectroscopy
Uv spectroscopy
 
U1 C1 UV Spectroscopy.pptx
U1 C1 UV Spectroscopy.pptxU1 C1 UV Spectroscopy.pptx
U1 C1 UV Spectroscopy.pptx
 
Uv visible spectroscopy with Instrumentation
Uv visible spectroscopy with InstrumentationUv visible spectroscopy with Instrumentation
Uv visible spectroscopy with Instrumentation
 
Uvvisiblespectroscopy 130121115849-phpapp02
Uvvisiblespectroscopy 130121115849-phpapp02Uvvisiblespectroscopy 130121115849-phpapp02
Uvvisiblespectroscopy 130121115849-phpapp02
 
uvvisiblespectroscopy-130121115849-phpapp02.pptx
uvvisiblespectroscopy-130121115849-phpapp02.pptxuvvisiblespectroscopy-130121115849-phpapp02.pptx
uvvisiblespectroscopy-130121115849-phpapp02.pptx
 
Basic uv spectroscopy
Basic uv spectroscopyBasic uv spectroscopy
Basic uv spectroscopy
 
UV spectrometery; woodward fischer rule
UV spectrometery; woodward fischer ruleUV spectrometery; woodward fischer rule
UV spectrometery; woodward fischer rule
 
uv spectroscopy by HARVINDAR SINGH .M.PHARM PHARMACEUTICS
 uv spectroscopy by HARVINDAR SINGH .M.PHARM PHARMACEUTICS uv spectroscopy by HARVINDAR SINGH .M.PHARM PHARMACEUTICS
uv spectroscopy by HARVINDAR SINGH .M.PHARM PHARMACEUTICS
 
Uv visible spectroscopy
Uv visible spectroscopyUv visible spectroscopy
Uv visible spectroscopy
 
Ultraviolet and visible spectrophotometer and Its application in pharmaceutic...
Ultraviolet and visible spectrophotometer and Its application in pharmaceutic...Ultraviolet and visible spectrophotometer and Its application in pharmaceutic...
Ultraviolet and visible spectrophotometer and Its application in pharmaceutic...
 
1.b. pharm uvvisiblespectroscopy jntu pharmacy
1.b. pharm uvvisiblespectroscopy jntu pharmacy1.b. pharm uvvisiblespectroscopy jntu pharmacy
1.b. pharm uvvisiblespectroscopy jntu pharmacy
 

More from Pharma Rising, Bhopal (14)

PRIMARY AND SECONDARY STANDARD
PRIMARY AND SECONDARY STANDARDPRIMARY AND SECONDARY STANDARD
PRIMARY AND SECONDARY STANDARD
 
AMINO ACID & PEPTIDES
AMINO ACID & PEPTIDESAMINO ACID & PEPTIDES
AMINO ACID & PEPTIDES
 
5 membered heterocyclic compound.pptx
5 membered heterocyclic compound.pptx5 membered heterocyclic compound.pptx
5 membered heterocyclic compound.pptx
 
Reaction of carbonyl compounds
Reaction of carbonyl compoundsReaction of carbonyl compounds
Reaction of carbonyl compounds
 
Structure, uses and qualitative test of carbonyl compound
Structure, uses and qualitative test of carbonyl compoundStructure, uses and qualitative test of carbonyl compound
Structure, uses and qualitative test of carbonyl compound
 
Morpholine
MorpholineMorpholine
Morpholine
 
QUINOLINE, ISOQUINOLINE AND INDOLE
QUINOLINE, ISOQUINOLINE AND INDOLEQUINOLINE, ISOQUINOLINE AND INDOLE
QUINOLINE, ISOQUINOLINE AND INDOLE
 
Skin creams
Skin creamsSkin creams
Skin creams
 
Quinoline
QuinolineQuinoline
Quinoline
 
Oxazole
OxazoleOxazole
Oxazole
 
Pyridine and pyrimidine
Pyridine and pyrimidinePyridine and pyrimidine
Pyridine and pyrimidine
 
Scope of pharmacy
Scope of pharmacyScope of pharmacy
Scope of pharmacy
 
Introduction to analysis
Introduction to analysisIntroduction to analysis
Introduction to analysis
 
Qsar by hansch analysis
Qsar by hansch analysisQsar by hansch analysis
Qsar by hansch analysis
 

Recently uploaded

FSB Advising Checklist - Orientation 2024
FSB Advising Checklist - Orientation 2024FSB Advising Checklist - Orientation 2024
FSB Advising Checklist - Orientation 2024Elizabeth Walsh
 
PANDITA RAMABAI- Indian political thought GENDER.pptx
PANDITA RAMABAI- Indian political thought GENDER.pptxPANDITA RAMABAI- Indian political thought GENDER.pptx
PANDITA RAMABAI- Indian political thought GENDER.pptxakanksha16arora
 
NO1 Top Black Magic Specialist In Lahore Black magic In Pakistan Kala Ilam Ex...
NO1 Top Black Magic Specialist In Lahore Black magic In Pakistan Kala Ilam Ex...NO1 Top Black Magic Specialist In Lahore Black magic In Pakistan Kala Ilam Ex...
NO1 Top Black Magic Specialist In Lahore Black magic In Pakistan Kala Ilam Ex...Amil baba
 
How to Manage Call for Tendor in Odoo 17
How to Manage Call for Tendor in Odoo 17How to Manage Call for Tendor in Odoo 17
How to Manage Call for Tendor in Odoo 17Celine George
 
Introduction to TechSoup’s Digital Marketing Services and Use Cases
Introduction to TechSoup’s Digital Marketing  Services and Use CasesIntroduction to TechSoup’s Digital Marketing  Services and Use Cases
Introduction to TechSoup’s Digital Marketing Services and Use CasesTechSoup
 
On_Translating_a_Tamil_Poem_by_A_K_Ramanujan.pptx
On_Translating_a_Tamil_Poem_by_A_K_Ramanujan.pptxOn_Translating_a_Tamil_Poem_by_A_K_Ramanujan.pptx
On_Translating_a_Tamil_Poem_by_A_K_Ramanujan.pptxPooja Bhuva
 
Beyond_Borders_Understanding_Anime_and_Manga_Fandom_A_Comprehensive_Audience_...
Beyond_Borders_Understanding_Anime_and_Manga_Fandom_A_Comprehensive_Audience_...Beyond_Borders_Understanding_Anime_and_Manga_Fandom_A_Comprehensive_Audience_...
Beyond_Borders_Understanding_Anime_and_Manga_Fandom_A_Comprehensive_Audience_...Pooja Bhuva
 
OSCM Unit 2_Operations Processes & Systems
OSCM Unit 2_Operations Processes & SystemsOSCM Unit 2_Operations Processes & Systems
OSCM Unit 2_Operations Processes & SystemsSandeep D Chaudhary
 
Spellings Wk 4 and Wk 5 for Grade 4 at CAPS
Spellings Wk 4 and Wk 5 for Grade 4 at CAPSSpellings Wk 4 and Wk 5 for Grade 4 at CAPS
Spellings Wk 4 and Wk 5 for Grade 4 at CAPSAnaAcapella
 
How to setup Pycharm environment for Odoo 17.pptx
How to setup Pycharm environment for Odoo 17.pptxHow to setup Pycharm environment for Odoo 17.pptx
How to setup Pycharm environment for Odoo 17.pptxCeline George
 
Understanding Accommodations and Modifications
Understanding  Accommodations and ModificationsUnderstanding  Accommodations and Modifications
Understanding Accommodations and ModificationsMJDuyan
 
Model Attribute _rec_name in the Odoo 17
Model Attribute _rec_name in the Odoo 17Model Attribute _rec_name in the Odoo 17
Model Attribute _rec_name in the Odoo 17Celine George
 
TỔNG ÔN TẬP THI VÀO LỚP 10 MÔN TIẾNG ANH NĂM HỌC 2023 - 2024 CÓ ĐÁP ÁN (NGỮ Â...
TỔNG ÔN TẬP THI VÀO LỚP 10 MÔN TIẾNG ANH NĂM HỌC 2023 - 2024 CÓ ĐÁP ÁN (NGỮ Â...TỔNG ÔN TẬP THI VÀO LỚP 10 MÔN TIẾNG ANH NĂM HỌC 2023 - 2024 CÓ ĐÁP ÁN (NGỮ Â...
TỔNG ÔN TẬP THI VÀO LỚP 10 MÔN TIẾNG ANH NĂM HỌC 2023 - 2024 CÓ ĐÁP ÁN (NGỮ Â...Nguyen Thanh Tu Collection
 
Accessible Digital Futures project (20/03/2024)
Accessible Digital Futures project (20/03/2024)Accessible Digital Futures project (20/03/2024)
Accessible Digital Futures project (20/03/2024)Jisc
 
Play hard learn harder: The Serious Business of Play
Play hard learn harder:  The Serious Business of PlayPlay hard learn harder:  The Serious Business of Play
Play hard learn harder: The Serious Business of PlayPooky Knightsmith
 
How to Create and Manage Wizard in Odoo 17
How to Create and Manage Wizard in Odoo 17How to Create and Manage Wizard in Odoo 17
How to Create and Manage Wizard in Odoo 17Celine George
 
21st_Century_Skills_Framework_Final_Presentation_2.pptx
21st_Century_Skills_Framework_Final_Presentation_2.pptx21st_Century_Skills_Framework_Final_Presentation_2.pptx
21st_Century_Skills_Framework_Final_Presentation_2.pptxJoelynRubio1
 
Simple, Complex, and Compound Sentences Exercises.pdf
Simple, Complex, and Compound Sentences Exercises.pdfSimple, Complex, and Compound Sentences Exercises.pdf
Simple, Complex, and Compound Sentences Exercises.pdfstareducators107
 
UGC NET Paper 1 Unit 7 DATA INTERPRETATION.pdf
UGC NET Paper 1 Unit 7 DATA INTERPRETATION.pdfUGC NET Paper 1 Unit 7 DATA INTERPRETATION.pdf
UGC NET Paper 1 Unit 7 DATA INTERPRETATION.pdfNirmal Dwivedi
 

Recently uploaded (20)

FSB Advising Checklist - Orientation 2024
FSB Advising Checklist - Orientation 2024FSB Advising Checklist - Orientation 2024
FSB Advising Checklist - Orientation 2024
 
PANDITA RAMABAI- Indian political thought GENDER.pptx
PANDITA RAMABAI- Indian political thought GENDER.pptxPANDITA RAMABAI- Indian political thought GENDER.pptx
PANDITA RAMABAI- Indian political thought GENDER.pptx
 
NO1 Top Black Magic Specialist In Lahore Black magic In Pakistan Kala Ilam Ex...
NO1 Top Black Magic Specialist In Lahore Black magic In Pakistan Kala Ilam Ex...NO1 Top Black Magic Specialist In Lahore Black magic In Pakistan Kala Ilam Ex...
NO1 Top Black Magic Specialist In Lahore Black magic In Pakistan Kala Ilam Ex...
 
How to Manage Call for Tendor in Odoo 17
How to Manage Call for Tendor in Odoo 17How to Manage Call for Tendor in Odoo 17
How to Manage Call for Tendor in Odoo 17
 
Introduction to TechSoup’s Digital Marketing Services and Use Cases
Introduction to TechSoup’s Digital Marketing  Services and Use CasesIntroduction to TechSoup’s Digital Marketing  Services and Use Cases
Introduction to TechSoup’s Digital Marketing Services and Use Cases
 
On_Translating_a_Tamil_Poem_by_A_K_Ramanujan.pptx
On_Translating_a_Tamil_Poem_by_A_K_Ramanujan.pptxOn_Translating_a_Tamil_Poem_by_A_K_Ramanujan.pptx
On_Translating_a_Tamil_Poem_by_A_K_Ramanujan.pptx
 
Beyond_Borders_Understanding_Anime_and_Manga_Fandom_A_Comprehensive_Audience_...
Beyond_Borders_Understanding_Anime_and_Manga_Fandom_A_Comprehensive_Audience_...Beyond_Borders_Understanding_Anime_and_Manga_Fandom_A_Comprehensive_Audience_...
Beyond_Borders_Understanding_Anime_and_Manga_Fandom_A_Comprehensive_Audience_...
 
OSCM Unit 2_Operations Processes & Systems
OSCM Unit 2_Operations Processes & SystemsOSCM Unit 2_Operations Processes & Systems
OSCM Unit 2_Operations Processes & Systems
 
Spellings Wk 4 and Wk 5 for Grade 4 at CAPS
Spellings Wk 4 and Wk 5 for Grade 4 at CAPSSpellings Wk 4 and Wk 5 for Grade 4 at CAPS
Spellings Wk 4 and Wk 5 for Grade 4 at CAPS
 
How to setup Pycharm environment for Odoo 17.pptx
How to setup Pycharm environment for Odoo 17.pptxHow to setup Pycharm environment for Odoo 17.pptx
How to setup Pycharm environment for Odoo 17.pptx
 
Understanding Accommodations and Modifications
Understanding  Accommodations and ModificationsUnderstanding  Accommodations and Modifications
Understanding Accommodations and Modifications
 
Model Attribute _rec_name in the Odoo 17
Model Attribute _rec_name in the Odoo 17Model Attribute _rec_name in the Odoo 17
Model Attribute _rec_name in the Odoo 17
 
OS-operating systems- ch05 (CPU Scheduling) ...
OS-operating systems- ch05 (CPU Scheduling) ...OS-operating systems- ch05 (CPU Scheduling) ...
OS-operating systems- ch05 (CPU Scheduling) ...
 
TỔNG ÔN TẬP THI VÀO LỚP 10 MÔN TIẾNG ANH NĂM HỌC 2023 - 2024 CÓ ĐÁP ÁN (NGỮ Â...
TỔNG ÔN TẬP THI VÀO LỚP 10 MÔN TIẾNG ANH NĂM HỌC 2023 - 2024 CÓ ĐÁP ÁN (NGỮ Â...TỔNG ÔN TẬP THI VÀO LỚP 10 MÔN TIẾNG ANH NĂM HỌC 2023 - 2024 CÓ ĐÁP ÁN (NGỮ Â...
TỔNG ÔN TẬP THI VÀO LỚP 10 MÔN TIẾNG ANH NĂM HỌC 2023 - 2024 CÓ ĐÁP ÁN (NGỮ Â...
 
Accessible Digital Futures project (20/03/2024)
Accessible Digital Futures project (20/03/2024)Accessible Digital Futures project (20/03/2024)
Accessible Digital Futures project (20/03/2024)
 
Play hard learn harder: The Serious Business of Play
Play hard learn harder:  The Serious Business of PlayPlay hard learn harder:  The Serious Business of Play
Play hard learn harder: The Serious Business of Play
 
How to Create and Manage Wizard in Odoo 17
How to Create and Manage Wizard in Odoo 17How to Create and Manage Wizard in Odoo 17
How to Create and Manage Wizard in Odoo 17
 
21st_Century_Skills_Framework_Final_Presentation_2.pptx
21st_Century_Skills_Framework_Final_Presentation_2.pptx21st_Century_Skills_Framework_Final_Presentation_2.pptx
21st_Century_Skills_Framework_Final_Presentation_2.pptx
 
Simple, Complex, and Compound Sentences Exercises.pdf
Simple, Complex, and Compound Sentences Exercises.pdfSimple, Complex, and Compound Sentences Exercises.pdf
Simple, Complex, and Compound Sentences Exercises.pdf
 
UGC NET Paper 1 Unit 7 DATA INTERPRETATION.pdf
UGC NET Paper 1 Unit 7 DATA INTERPRETATION.pdfUGC NET Paper 1 Unit 7 DATA INTERPRETATION.pdf
UGC NET Paper 1 Unit 7 DATA INTERPRETATION.pdf
 

uv-visible spectroscopy also available video lecture on youtube channel name - PHARMA RISING

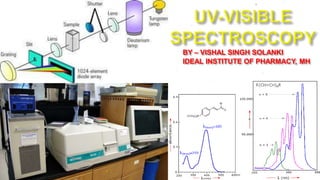
  • 1. 1 BY – VISHAL SINGH SOLANKI IDEAL INSTITUTE OF PHARMACY, MH
  • 2.  Electromagnetic radiation Energy of an EMR Electromagnetic spectrum & it’sregions  Spectroscopy & it’stypes  Colorimetry UV-spectroscopy  Electronic transitions Terms used in UV-Visiblespectroscopy Absorption band & it’stypes 2
  • 3.  Electromagneticradiation is a typeof energy that is transmitted through spaceatenormousvelocities.  Radiant energy has wave nature and being associated with electric as well as magnetic field,these radiations are called electromagneticradiation.  Electromagnetic radiation has it’s origin in atomic and molecularprocesses. 3
  • 4.  The field may be represented as electricand magnetic vectors oscillating in mutually perpendicular planes. 4
  • 5.  The energy of an EMR can be given by the following equation: E=hµ Where E= Energy of radiation h=Planck’sconstant µ=Frequency of radiation 5
  • 6. Frequency(µ)= c/λ 6 :-Hence, E=hµ E=hc/λ Therefore,energy of a radiation depends uponfrequency and wavelength of radiation.
  • 7. The arrangement obtained by arranging various types of electromagneticwavesorradiations in orderof their increasing wavelegth or decreasing frequencies is called electromagnetic spectrum. The electromagnetic spectrum is divided into a number of regions; these are artificial divisions in the sense that they have been defined solely as a result of differences in the instrumentation required for producing and detecting radiation of agiven frequency range. 7
  • 8. 8
  • 9.  Ultraviolet: 190~400nm  Violet:  Indigo: 400 - 420 nm 420 - 440 nm  Blue:  Green: 440 - 490 nm 490 - 570 nm  Yellow:  Orange: 570 - 585 nm 585 - 620 nm  Red: 620 - 780 nm 9
  • 10. 10
  • 11. Spectroscopy is the measurement and interpretation of electromagnetic radiation absorbed oremitted when the moleculesor atoms or ions of a sample moves from one energy state toanotherenergy state 11
  • 12. 1) Atomic spectroscopy:Here, the changes in energy takes place at atomic level. Eg: Atomic absorption spectroscopy, Flame photometry 2)Molecular spectroscopy:Here,the changes in energy takes place at molecular level. Eg: UV spectroscopy, colorimetry, infrared spectroscopy 12
  • 13. Absorption spectrophotometry can be defined as the measurement of absorption of radiant energy by various substances.It involves the measurementof absorptivecapacity forradiant energy in thevisible,UVand IR regions of thespectrum. 13
  • 14. o λ- 400-800nm o Coloured substance absorbs light of different λin different manner and hence get an absorption curve o Theλatwhich maximum absorption takes place is called as λmax o λmax is characteristic for every colouredsubstance o On plotting a graph of concentration v/s absorbance, we getacalibration curve that is useful in determining the concentration or amount of a drug substance in the given samplesolution. 14
  • 15. 15
  • 16.  UV spectroscopy is concerned with thestudyof absorption of uv radiation which ranges from200-400nm.  Valenceelectronsabsorb theenergy thereby molecules undergoes transition from ground state to excited state.  This absorption ischaracteristic and dependson the nature of electronspresent.  Types of e- σ electrons: π electrons: n electrons: in saturated compounds in unsaturatedcompounds in non bondedelectrons 16
  • 17. 17
  • 18.  σ electron from orbital is excited tocorresponding anti-bonding orbitalσ*.  Theenergy required is large for this transition.  The organic compounds in which all the valence shell electrons are involved in the formation of σ bond do notshowabsorption in normal uvregion (200-400nm)  This transition is observed with saturated compounds. 18
  • 19.  Eg: Methane(CH₄) has C-H bond only and can undergoσ- σ* transition and shows absorption maximaat 122nm.  The usual spectroscopic technique cannot beused below 200 nm.  Tostudy this high energy transition,theentire region should be evacuated (Vacuum uvregion)  Here,theexcitation ocuurs with net retention of electronic spin  This region is lessinformative 19 1) σ-σ*
  • 20.  π electron in a bonding orbital is excited to corresponding anti-bonding orbitalπ*.  Energy required is less whencompared to n-σ*  Compounds containing multiple bondslike alkenes,alkynes,carbonyls,nitriles,aromatic compounds etc undergo π-π*transition. Eg:Alkenesgenerallyabsorb in the region 170-205nm. 20
  • 21.  Absorption usuallyoccurs in theordinary uv spectrophotometer  Absorption bands in unconjugated alkenes(170- 190nm)  Absorption bands in carbonyls (180nm)  Introductionof alkyl group in olefinic linkage produces bathochromicshift 21 2) π-π*
  • 22.  Saturated compoundscontaining one heteroatom with unshared pair of electrons(n) like O,N,S and halogens arecapableof n-σ* transition.  These transition require lessenergy than σ-σ* transition.  In saturated alkyl halides, the energy required for transition decreasewith increase in the size of halogen atom (or decrease inelectronegativity) 22
  • 23.  Eg:Methyl chloride has aλmax of 173nm. Methyl iodide has aλmax of 258nm.  This typeof transition isvery sensitive to hydrogen bonding Eg: Alcohol & amines  Hydrogen bonding shift the uvabsorptions to shorterwavelength. 23 3) n-σ*
  • 24.  An electron from non-bonding orbital is promoted to anti-bonding π* orbital.  Compounds containing double bondsinvolving hetero atoms(C=O,N=O) undergo such type of transitions.  This transition require minimumenergy outof all transitions and shows absorption band at longer wavelength around 300nm. 24
  • 25.  Eg:Saturated aldehydes shows both type oftransitions (n-π*, π-π*) at {lowenergy and high energy} around 290 and 180 nm. 25 4) n-π*
  • 26. 26
  • 27.  Chromophore is defined as the nucleus or any isolated covalently bonded group responsible for the absorption of lightradiation.  Any group which exhibits absorption of electromagneticradiations in thevisibleorultraviolet region. C=C , C=O ,NO2 etc  Some of the important chromophores are carbonyls,acids,esters,nitrile,ethylenicgroups. 27
  • 28. 28
  • 29.  These are co-ordinatively saturated or un-saturated groupswhich themselvesdo notabsorb radiations,but when presentalongwith achromophoreenhances the absorbing properties of chromophore.  Also knownas colourenhancing group.  All auxochromes haveoneor more non-bonding pair of electrons. -NH2 ,-OH ,-OR,-COOH etc  Itextend theconjugationof a chromophore bysharing the non-bonding electrons. 29
  • 30. 30
  • 31. 31
  • 32.  When the absorption maxima(λmax)of acompound shifts to longer wavelength,it is known as bathochromic shift orred shift.  The effect is due to the presenceof auxochromeor by change of solvent.  Eg: The n-π* transition for carbonyl compounds experiences bathochromic shift when the polarityof solvent isdecreased. 32
  • 33.  When theabsorption maxima (λmax) of a compound shifts to a shorter wavelength,it is known as hypsochromic shift or blueshift.  Theeffect is due to the presenceof a groupcauses removal of conjugationor bychangeof solvent. 33
  • 34. Eg: Aniline shows blueshift in acidic medium since it loses conjugation. Aniline(280nm) & Anilinium ion (- 203nm). 34
  • 35. 35
  • 36. 36
  • 37. 37
  • 38. 38
  • 39.  The spectrum consist of sharp peaks and each peak will correspond to the promotion of electron from one electronic level toanother.  During promotion,the electron moves from a given vibrational and rotational level within one electronicmode to theotherwithin the nextelectronic mode.  Thus,therewill bea large no of possible transitions  Hence,not justone but a large no. of wavelengthswhich are close enough will be absorbed resulting in the formation of bands 39
  • 40. 40 K-Bandsoriginatedue toπ-π* transition from a compound containing a conjugatedsystem Such typeof bandsarise in compounds like dienes,polyenes and enonesetc. Compound Transition λmax(nm) εmax Acetophenone π-π* 240 13,000 1,3-butadiene π-π* 217 21,000
  • 41. R-Band transition originatedue to n-π* transition of a single chromophoric group and having atleast one lone pairof electronson the heteroatom Theseare less intensewith εmax value below 100 Compound Transition λmax(nm) εmax Acetone n-π* 270 15 Acetaldehyde n-π* 293 12 41
  • 42. Such typeof bandsarisedue toπ-π* transition in aromatic or hetero-aromaticmolecules. Benzene shows absorption peaks between 230- 270nm.when achromophoricgroup is attached to the benzene ring ,the B-Bands are observed at longer wavelengths than the more intenseK-Bands. Compound Transition λmax(nm) εmax Benzene π-π* 255 215 Phenol π- π* 270 1450 42
  • 43. E-Band originate due to the electronic transitions in the benzenoid systemsof threeethylenic bondswhich are in closed cyclicconjugation. Theseare furthercharacterized as E1 and E2 bands E1 band which appearat shorterwavelength is usually more intense than the E2 band for the same compound which appearsat longerwavelength. Compound E1 Band E1 Band E2 Band E2 Band λmax(nm) εmax λmax(nm) εmax Benzene 184 50,000 204 79,000 Napthalene 221 133,000 286 9,300 43
  • 44. 44
  • 45. BEER’S LAW According to this law,when a beam of monochromatic radiation is passed through a solution of absorbing species,the intensity of beam of monochromatic light decreases exponentially with increase in concentration of absorbing species LAMBERT’S LAW -dI/dc α I Lambert’s law states that the rate of decrease of intensity of monochromatic light with the thickness of the medium is directly proportional to the intensity of incident light. -dI/dt α I 45
  • 46. According to beer’s law, -dI α I dc The decrease in the intensity of light (I) with concentration(c) is proportional to intensityof incident light(I) -dI = K.I dc { removing & introducing the constant of proportionality “K”} -dI = K.dc { rearranging terms} I 46
  • 47.  When concentration =0, there is no absorbance,Hence I=I₀ Substituting in equation   -ln I₀ = K*0+b  -ln I₀ = b  Substituting the value of b in equation I -ln I = K.c + b  { b constantof integration} 47
  • 48. I₀ = ekc { removing natural log } I I I₀ = e-kc {making inverse on bothsides}  [equation for beer’slaw] According to lambert’s law, -dI α I dt This eqn can be simplified by replacing ‘c’ with ‘t’ in I = I₀e-kt  Eqn  &  can be combined toget I = I₀e-kct 48
  • 49. I = ₁₀-kct { rearranging terms } I₀ { inverse on bothsides} I₀ = ₁₀kct I Taking log on both sides, log I₀ = Kct  I Here, TransmittanceT = I₀ , Absorbance,A = log 1 I T 49
  • 50. A = log 1 T A = log 1 { Since T = I₀ } I/I₀ I A =log I₀  I Using eqn  & , since A =log I₀ and I log I₀ = Kct , I A= Kct Instead of K, we can useε A = εct {Mathematical eqn for beerlambert’s law} 50
  • 51. 51
  • 52. 52
  • 53. There are 3 typesof deviations usuallyobserved A)The real limitationof the law is that the beer’s law is successful in describing the absorption behaviour of dilute solutionsonly. B)CHEMICAL DEVIATIONS: Association of molecules This can be explained by taking the examples of methylene blueat small concentration(10‾⁵ molar) and 53
  • 54.  Dissociation of molecules This can beexplained by the fact thatdichromate ions posses their maximum absorbance at 450nm which is orange in colour .Butupondilution,itwill be dissociated to chromate ions having maximum absorbanceat 410nm which is yellow in colour. This law is notvalid in case if theabsorbing material is coagulated intoa small numberof large units. This law showsdeviation if theabsorbing material at 54
  • 55.  This law is notapplicable in caseof suspension. C)INSTRUMENTAL DEVIATIONS: Strict adherence of an absorbing system to this law is observed only when theradiation used is monochromatic. Strayradiation,slitwidth also causes deviation. Hence,the reasons for the deviation depends on environment such astemperature,pressure,solvent, 55
  • 57.  Absorbance 0.800 ε=1000 ε=1500 0.600 ε=1750 0.400 0.200 0.00 2.0 4.0 6.0 8.0 10.0 concentration 57
  • 58.  2.0 0.0% 0.2%  1%  1.0 5%  0  2.5 5.0 7.5 10 concentration 58
  • 59. 1)Elementary organic spectroscopy,principles &chemical applications,Y.R Sharma,Revised edition,pg n.o 18,26,27 2) Pharmaceutical chemistry,Instrumental techniques,vol 2,Leslie.G.chatten,pg n.o 21-24 3) Principles and practice of analyticalchemistry,F.W Fifield & D.kealey, 5th edition ,pg n.o270-274 4) Pharmaceutical analysis,P.Parimoo, pg n.o 147,151,152,165 59
  • 60.  6)Instrumental analysis,Skoog,Holler,Crouch, pg no.383,386  7)Practical pharmaceutical chemistry,4th edition,partv 2, Beckett ,stenlake, pg n.o275-277 60