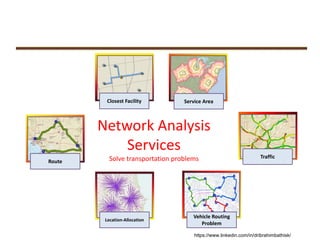
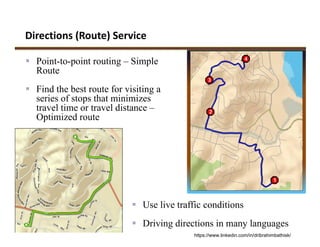
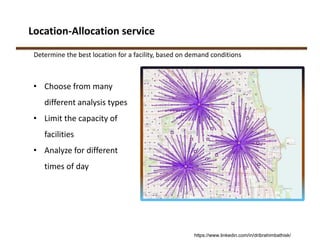
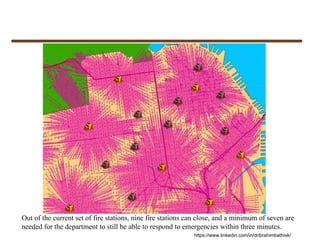
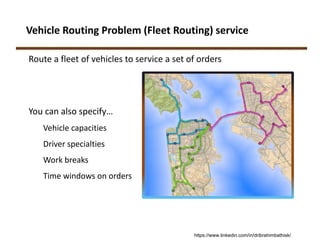
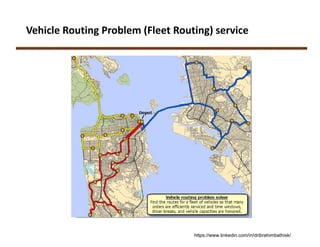
Transportation involves the movement of people and the shipment of goods from one location to another.
A geospatial model of a transportation network is comprised of linear features and the points of intersection between them.
A network is a system of interconnected elements, such as edges (lines) and connecting junctions (points), that represent possible routes from one location to another.
Here I explained introduction to the network analysis in GIS.
Digital Elevation Model (DEM) is the digital representation of the land surface elevation with respect to any reference datum. DEM is frequently used to refer to any digital representation of a topographic surface. DEM is the simplest form of digital representation of topography. GIS applications depend mainly on DEMs, today.
When you georeference your raster data, you define its location using map coordinates and assign the coordinate system of the map frame. Georeferencing raster data allows it to be viewed, queried, and analyzed with your other geographic data. The georeferencing tools on the Georeference tab allows you to georeference any raster dataset.
In general, there are four steps to georeference your data:
Add the raster dataset that you want to align with your projected data.
Use the Georeference tab to create control points, to connect your raster to known positions in the map
Review the control points and the errors
Save the georeferencing result, when you are satisfied with the alignment.
An introduction to GIS Data Types. Strengths and weaknesses of raster and vector data are discussed. Also covered is the importance of topology. Concludes with a discussion of the vector-based format of OpenStreetMap data.
Geographic Regions: by definition There three types of regions Formal regions are areas where a certain characteristic is found throughout. Functional regions consist of a central place and the surrounding places affected by it. Perceptual regions are defined by peopleâs attitudes and feelings about areas. 4.
Digitizing in GIS is the process of converting geographic data either from a hardcopy or a scanned image into vector data by tracing the features. During the digitzing process, features from the traced map or image are captured as coordinates in either point, line, or polygon format
This presentation is about the raster and vector data in GIS which is important and costly as well, through the presentation we will learn about both type of data.
DEFINITION :
GIS is a powerful set of tools for collecting, storing , retrieving at will, transforming and displaying spatial data from the real world for a particular set of purposes
APPLICATION AREAS OF GIS
Agriculture
Business
Electric/Gas utilities
Environment
Forestry
Geology
Hydrology
Land-use planning
Local government
Mapping
11. Military
12. Risk management
13. Site planning
14. Transportation
15. Water / Waste water industry
COMPONENTS OF GIS
DATA INPUT
SPATIAL DATA MODEL
Data Model:
It describes in an abstract way how the data is represented in an information system or in DBMS
Spatial Data Model :
The models or abstractions of reality that are intended to have some similarity with selected aspects of the real world
Creation of analogue and digital spatial data sets involves seven levels of model development and abstraction
SPATIAL DATA MODEL
Conceptual model : A view of reality
Analog model : Human conceptualization leads to analogue abstraction
Spatial data models : Formalization of analogue abstractions without any conventions
Database model : How the data are recorded in the computer
Physical computational model : Particular representation of the data structures in computer memory
Data manipulation model : Accepted axioms and rules for handling the data
SPATIAL DATA MODEL
SPATIAL DATA MODEL
Objects on the earth surface are shown as continuous and discrete objects in spatial data models
Types of data models
Raster data model
vector data models
RASTER DATA MODEL
Basic Elements :
Extent
Rows
Columns
Origin
Orientation
Resolution: pixel = grain = grid cell
Ex: Bit Map Image (BMP),Joint Photographic Expert Group (JPEG), Portable Network Graphics(PNG) etc
RASTER DATA MODEL
VECTOR DATA MODEL
Basic Elements:
Location (x,y) or (x,y,z)
Explicit, i.e. pegged to a coordinate system
Different coordinate system (and precision) require different values
o e.g. UTM as integer (but large)
o Lat, long as two floating point numbers +/-
Points are used to build more complex features
Ex: Auto CAD Drawing File(DWG), Data Interchange(exchange) File(DXF), Vector Product Format (VPF) etc
VECTOR DATA MODEL
RASTER vs VECTORRaster is faster but Vector is corrector
TESSELLATIONS OF CONTINUOUS FIELDS
Triangular Irregular Network: (TIN)
TIN is a vector data structure for representing geographical information that is continuous
Digital elevation model
TIN is generally used to create Digital Elevation Model (DEM)
DIGITAL ELEVATION MODEL
DATA STRUCTURES
Data structure tells about how the data is stored
Data organization in raster data structures
Each cell is referenced directly
Each overlay Is referenced directly
Each mapping unit is referenced directly
Each overlay is separate file with general header
The Design of a Simulation for the Modeling and Analysis of Public Transporta...CSCJournals
Â
Vehicular ad-hoc networks, when combined with wireless sensor networks, are used in a variety of solutions for commercial, urban, and metropolitan areas, including emergency response, traffic, and environmental monitoring. In this work, we model buses in the Washington, DC Metropolitan Area Transit Authority (WMATA) as a network of vehicular nodes equipped with wireless sensors. A simulation tool was developed, using the actual WMATA schedule, to determine performance metrics such as end-to-end packet delivery delay. In addition, a web-based front-end was developed, using the Google Maps API, to provide a user-friendly display and control of the network map, input parameters, and simulated results. This application will provide users with a simplified method for modifying network parameters to account for a number of parameters and conditions, including inclement weather, traffic congestion, and more.
CREATING DATA OUTPUTS FROM MULTI AGENT TRAFFIC MICRO SIMULATION TO ASSIMILATI...cscpconf
Â
The intensive development of traffic engineering and technologies that are integrated into vehicles, roads and their surroundings, bring opportunities of real time transport mobility modeling. Based on such model it is then possible to establish a predictive layer that is capable of predicting short and long term traffic flow behavior. It is possible to create the real time model of traffic mobility based on generated data. However, data may have different geographical, temporal or other constraints, or failures. It is therefore appropriate to develop tools that artificially create missing data, which can then be assimilated with real data. This paper presents a mechanism describing strategies of generating artificial data using microsimulations. It describes traffic microsimulation based on our solution of multiagent framework over which a system for generating traffic data is built. The system generates data of a structure corresponding to the data acquired in the real world.
CREATING DATA OUTPUTS FROM MULTI AGENT TRAFFIC MICRO SIMULATION TO ASSIMILATI...csandit
Â
The intensive development of traffic engineering and technologies that are integrated into
vehicles, roads and their surroundings, bring opportunities of real time transport mobility
modeling. Based on such model it is then possible to establish a predictive layer that is capable
of predicting short and long term traffic flow behavior. It is possible to create the real time
model of traffic mobility based on generated data. However, data may have different
geographical, temporal or other constraints, or failures. It is therefore appropriate to develop
tools that artificially create missing data, which can then be assimilated with real data. This
paper presents a mechanism describing strategies of generating artificial data using
microsimulations. It describes traffic microsimulation based on our solution of multiagent
framework over which a system for generating traffic data is built. The system generates data of
a structure corresponding to the data acquired in the real world.
Optimal Content Downloading in Vehicular Network with Density MeasurementZac Darcy
Â
The existence of Internet-connected navigation and infotainment systems is becoming a truth that will
easily lead to a remarkable growth in bandwidth demand by in-vehicle users. In Examples the applications
of vehicular communication proliferate, and range from the updating of road maps to the repossession of
nearby points of interest, downloading of touristic information and multimedia files. This content
downloading system will induce the vehicular user to use the resource to the same extent as todayâs mobile
customers. By this approach communication-enabled vehicles are paying attention in downloading
different contents from Internet-based servers. We summarize the performance limits of such a vehicular
multimedia content downloading system by modeling the content downloading process as an effective
problem and developing the overall system throughput with density measurement. Results highlight the
methods where the Roadside infrastructure i.e., access points are working at different capabilities
irrespective of vehicle density, the vehicle-to-vehicle communication.
International Journal of Computational Engineering Research (IJCER) ijceronline
Â
International Journal of Computational Engineering Research(IJCER) is an intentional online Journal in English monthly publishing journal. This Journal publish original research work that contributes significantly to further the scientific knowledge in engineering and Technology
Optimal content downloading in vehicular network with density measurementZac Darcy
Â
The existence of Internet-connected navigation and infotainment systems is becoming a truth that will easily lead to a remarkable growth in bandwidth demand by in-vehicle users. In Examples the applications of vehicular communication proliferate, and range from the updating of road maps to the repossession of nearby points of interest, downloading of touristic information and multimedia files. This content downloading system will induce the vehicular user to use the resource to the same extent as todayâs mobile customers. By this approach communication-enabled vehicles are paying attention in downloading different contents from Internet-based servers. We summarize the performance limits of such a vehicular multimedia content downloading system by modeling the content downloading process as an effective problem and developing the overall system throughput with density measurement. Results highlight the methods where the Roadside infrastructure i.e., access points are working at different capabilities irrespective of vehicle density, the vehicle-to-vehicle communication.
Back-Bone Assisted HOP Greedy Routing for VANETijsrd.com
Â
Using advanced wireless local area network technologies, vehicular ad hoc networks (VANETs) have become viable and valuable for their wide variety of novel applications, such as road safety, multimedia content sharing, commerce on wheels, etc., currently, geographic routing protocols are widely adopted for VANETs as they do not require route construction and route maintenance phases. Again, with connectivity awareness, they perform well in terms of reliable delivery. Further, in the case of sparse and void regions, frequent use of the recovery strategy elevates hop count. Some geographic routing protocols adopt the minimum weighted algorithm based on distance or connectivity to select intermediate intersections. However, the shortest path or the path with higher connectivity may include numerous intermediate intersections. As a result, these protocols yield routing paths with higher hop count. In this paper, we propose a hop greedy routing scheme that yields a routing path with the minimum number of intermediate intersection nodes while taking connectivity into consideration. Moreover, we introduce back-bone nodes that play a key role in providing connectivity status around an intersection. Apart from this, by tracking the movement of source as well as destination, the back-bone nodes enable a packet to be forwarded in the changed direction. Simulation results signify the benefits of the proposed routing strategy in terms of high packet delivery ratio and shorter end-to-end delay.
IJERA (International journal of Engineering Research and Applications) is International online, ... peer reviewed journal. For more detail or submit your article, please visit www.ijera.com
International Journal of Engineering and Science Invention (IJESI)inventionjournals
Â
International Journal of Engineering and Science Invention (IJESI) is an international journal intended for professionals and researchers in all fields of computer science and electronics. IJESI publishes research articles and reviews within the whole field Engineering Science and Technology, new teaching methods, assessment, validation and the impact of new technologies and it will continue to provide information on the latest trends and developments in this ever-expanding subject. The publications of papers are selected through double peer reviewed to ensure originality, relevance, and readability. The articles published in our journal can be accessed online
Reducing Latency in African NRENS Using Performance-Based LISP/SDN Traffic En...csandit
Â
Active topology measurements on the African Internet have showed that over 75% of the intraAfrica
traffic destined for Africa's National Research and Education Net- works (NRENs) uses
intercontinental links, resulting in high latencies and data transmission costs. The goal of this
work is to investigate how latency-based path selection using Locator/Identifier Separation
Protocol (LISP) and Software Defined Networking (SDN) in NRENs can be used to reduce
inter-NREN latencies. We present aspects of an experimental prototype implementation for realtime
topology probes to discover lower-latency remote gateways and dynamic configuration of
end-to-end Internet paths. Simulation results indicate that ranking remote ingress gateways, and
dynamic configuration of end-to-end paths between gateways can lower the average latency for
inter-NREN traffic exchange.
REDUCING LATENCY IN AFRICAN NRENS USING PERFORMANCE-BASED LISP/SDN TRAFFIC EN...cscpconf
Â
Active topology measurements on the African Internet have showed that over 75% of the intraAfrica traffic destined for Africa's National Research and Education Net- works (NRENs) uses intercontinental links, resulting in high latencies and data transmission costs. The goal of this work is to investigate how latency-based path selection using Locator/Identifier Separation Protocol (LISP) and Software Defined Networking (SDN) in NRENs can be used to reduce inter-NREN latencies. We present aspects of an experimental prototype implementation for realtime topology probes to discover lower-latency remote gateways and dynamic configuration of end-to-end Internet paths. Simulation results indicate that ranking remote ingress gateways, and dynamic configuration of end-to-end paths between gateways can lower the average latency for inter-NREN traffic exchange.
Similar to Network analysis in gis , part 4 transportation networks (20)
Here I included all the possible information pertaining to the GEO-SPATIAL TECHNOLOGY IN ENVIRONMENTAL SCIENCE & MANAGEMENT. Such as Remote sensing, Geographical information system, and Global Navigational satellite system.
utility networks such as sewer and water systems; rivers and streams
Elements on the network have no choice in travel decision. Flow direction is determined by the network characteristics alone
The utility network is the main component users will work with when managing utility and telecom networks within ArcGIS.
The utility network combined with a transaction model, attribute rules, editing tools, and more allows users to completely model and analyze their complex network systems for water, gas, electric, telecom, sewer, stormwater, and other utilities.
Connectivity rules constrain the type of network features that may be connected to one another and the number of features of any particular type that can be connected to features of another type.
Brief introduction to the topic on Oceanography. Anyone who have interested to study the basic of oceanography may be refer to this slide.
for me information kindly refer to the text book
"Essentials of Oceanography" Alan P. Trujillo Harold V. Thurman
(Eleventh Edition)
Honest Reviews of Tim Han LMA Course Program.pptxtimhan337
Â
Personal development courses are widely available today, with each one promising life-changing outcomes. Tim Hanâs Life Mastery Achievers (LMA) Course has drawn a lot of interest. In addition to offering my frank assessment of Success Insiderâs LMA Course, this piece examines the courseâs effects via a variety of Tim Han LMA course reviews and Success Insider comments.
Read| The latest issue of The Challenger is here! We are thrilled to announce that our school paper has qualified for the NATIONAL SCHOOLS PRESS CONFERENCE (NSPC) 2024. Thank you for your unwavering support and trust. Dive into the stories that made us stand out!
Francesca Gottschalk - How can education support child empowerment.pptxEduSkills OECD
Â
Francesca Gottschalk from the OECDâs Centre for Educational Research and Innovation presents at the Ask an Expert Webinar: How can education support child empowerment?
The Roman Empire A Historical Colossus.pdfkaushalkr1407
Â
The Roman Empire, a vast and enduring power, stands as one of history's most remarkable civilizations, leaving an indelible imprint on the world. It emerged from the Roman Republic, transitioning into an imperial powerhouse under the leadership of Augustus Caesar in 27 BCE. This transformation marked the beginning of an era defined by unprecedented territorial expansion, architectural marvels, and profound cultural influence.
The empire's roots lie in the city of Rome, founded, according to legend, by Romulus in 753 BCE. Over centuries, Rome evolved from a small settlement to a formidable republic, characterized by a complex political system with elected officials and checks on power. However, internal strife, class conflicts, and military ambitions paved the way for the end of the Republic. Julius Caesarâs dictatorship and subsequent assassination in 44 BCE created a power vacuum, leading to a civil war. Octavian, later Augustus, emerged victorious, heralding the Roman Empireâs birth.
Under Augustus, the empire experienced the Pax Romana, a 200-year period of relative peace and stability. Augustus reformed the military, established efficient administrative systems, and initiated grand construction projects. The empire's borders expanded, encompassing territories from Britain to Egypt and from Spain to the Euphrates. Roman legions, renowned for their discipline and engineering prowess, secured and maintained these vast territories, building roads, fortifications, and cities that facilitated control and integration.
The Roman Empireâs society was hierarchical, with a rigid class system. At the top were the patricians, wealthy elites who held significant political power. Below them were the plebeians, free citizens with limited political influence, and the vast numbers of slaves who formed the backbone of the economy. The family unit was central, governed by the paterfamilias, the male head who held absolute authority.
Culturally, the Romans were eclectic, absorbing and adapting elements from the civilizations they encountered, particularly the Greeks. Roman art, literature, and philosophy reflected this synthesis, creating a rich cultural tapestry. Latin, the Roman language, became the lingua franca of the Western world, influencing numerous modern languages.
Roman architecture and engineering achievements were monumental. They perfected the arch, vault, and dome, constructing enduring structures like the Colosseum, Pantheon, and aqueducts. These engineering marvels not only showcased Roman ingenuity but also served practical purposes, from public entertainment to water supply.
Welcome to TechSoup New Member Orientation and Q&A (May 2024).pdfTechSoup
Â
In this webinar you will learn how your organization can access TechSoup's wide variety of product discount and donation programs. From hardware to software, we'll give you a tour of the tools available to help your nonprofit with productivity, collaboration, financial management, donor tracking, security, and more.
Unit 8 - Information and Communication Technology (Paper I).pdfThiyagu K
Â
This slides describes the basic concepts of ICT, basics of Email, Emerging Technology and Digital Initiatives in Education. This presentations aligns with the UGC Paper I syllabus.
How to Make a Field invisible in Odoo 17Celine George
Â
It is possible to hide or invisible some fields in odoo. Commonly using âinvisibleâ attribute in the field definition to invisible the fields. This slide will show how to make a field invisible in odoo 17.
June 3, 2024 Anti-Semitism Letter Sent to MIT President Kornbluth and MIT Cor...Levi Shapiro
Â
Letter from the Congress of the United States regarding Anti-Semitism sent June 3rd to MIT President Sally Kornbluth, MIT Corp Chair, Mark Gorenberg
Dear Dr. Kornbluth and Mr. Gorenberg,
The US House of Representatives is deeply concerned by ongoing and pervasive acts of antisemitic
harassment and intimidation at the Massachusetts Institute of Technology (MIT). Failing to act decisively to ensure a safe learning environment for all students would be a grave dereliction of your responsibilities as President of MIT and Chair of the MIT Corporation.
This Congress will not stand idly by and allow an environment hostile to Jewish students to persist. The House believes that your institution is in violation of Title VI of the Civil Rights Act, and the inability or
unwillingness to rectify this violation through action requires accountability.
Postsecondary education is a unique opportunity for students to learn and have their ideas and beliefs challenged. However, universities receiving hundreds of millions of federal funds annually have denied
students that opportunity and have been hijacked to become venues for the promotion of terrorism, antisemitic harassment and intimidation, unlawful encampments, and in some cases, assaults and riots.
The House of Representatives will not countenance the use of federal funds to indoctrinate students into hateful, antisemitic, anti-American supporters of terrorism. Investigations into campus antisemitism by the Committee on Education and the Workforce and the Committee on Ways and Means have been expanded into a Congress-wide probe across all relevant jurisdictions to address this national crisis. The undersigned Committees will conduct oversight into the use of federal funds at MIT and its learning environment under authorities granted to each Committee.
⢠The Committee on Education and the Workforce has been investigating your institution since December 7, 2023. The Committee has broad jurisdiction over postsecondary education, including its compliance with Title VI of the Civil Rights Act, campus safety concerns over disruptions to the learning environment, and the awarding of federal student aid under the Higher Education Act.
⢠The Committee on Oversight and Accountability is investigating the sources of funding and other support flowing to groups espousing pro-Hamas propaganda and engaged in antisemitic harassment and intimidation of students. The Committee on Oversight and Accountability is the principal oversight committee of the US House of Representatives and has broad authority to investigate âany matterâ at âany timeâ under House Rule X.
⢠The Committee on Ways and Means has been investigating several universities since November 15, 2023, when the Committee held a hearing entitled From Ivory Towers to Dark Corners: Investigating the Nexus Between Antisemitism, Tax-Exempt Universities, and Terror Financing. The Committee followed the hearing with letters to those institutions on January 10, 202
Biological screening of herbal drugs: Introduction and Need for
Phyto-Pharmacological Screening, New Strategies for evaluating
Natural Products, In vitro evaluation techniques for Antioxidants, Antimicrobial and Anticancer drugs. In vivo evaluation techniques
for Anti-inflammatory, Antiulcer, Anticancer, Wound healing, Antidiabetic, Hepatoprotective, Cardio protective, Diuretics and
Antifertility, Toxicity studies as per OECD guidelines
2. TRANSPORTATION NETWORKS
ď§ Transportation involves the movement of people and the shipment
of goods from one location to another.
ď§ A geospatial model of a transportation network is comprised of
linear features and the points of intersection between them.
ď§ A street network is a multilevel network that has a two-way flow
except for situations, such as one-way streets, divided highways, and
transition ramps.
ď§ The modeling and analysis of networks has so many applications
that there is an entire branch of mathematics devoted to it known as
graph theory.
ď§ In graph theory, linear segments of the network (e.g. road segments)
are referred to as edges and the points where the linear segments
connect are called nodes.
https://www.linkedin.com/in/dribrahimbathisk/
3. TRANSPORTATION NETWORKS
Transportation tasks include the following:
ď§ Road type (width of road), pavement management, traffic
management and accident related data.
ď§ As per the population within that area the transport network
structure should be redesigned.
ď§ This may be to increase road width, make one ways, and identify
the parking area (multi floor parking).
ď§ The use of GIS technology in development of Urbanization, the
transportation information system and management can provide a
very strong solution.
ď§ Information related to transportation network is used in the efficient
planning, designing, construction, maintenance and
management of the transport system
https://www.linkedin.com/in/dribrahimbathisk/
4. TRANSPORTATION NETWORKS
Transportation tasks include the following:
ď§ Calculating the quickest path between two locations
ď§ Determining a trade area based on travel time
ď§ Dispatching the closest ambulance to an accident
ď§ Finding the best path and sequence to visit customers
ď§ Routing a fleet of vehicles efficiently
ď§ Determining the best location for a facility
ď§ Finding the distance from every origin in a set of origins to every
destination in a set of destinations
https://www.linkedin.com/in/dribrahimbathisk/
5. Important Measures of Transport Networks
(i) The connectivity of networks;
(ii) The centrality within networks;
(iii) The spread and diameter of networks; and
(iv) Detours.
http://www.geographynotes.com/articles/4âimportantâmeasuresâofâtransportânetworksâwithâ
diagram/165
https://www.linkedin.com/in/dribrahimbathisk/
6. Connectivity and its Measurement
ď§ The connectivity of a network may be defined as the degree of
completeness of the links between nodes.
ď§ The greater the degree of connectivity within a transportation
network, the more efficient with that system.
ď§ When a network is abstracted as a set of edges that are related to set
of vertices (nodes), a fundamental question is the degree to which all
pairs of vertices are interconnected.
https://www.linkedin.com/in/dribrahimbathisk/
7. Connectivity and its Measurement
ď§ Beta Index (β): dividing the total number of arcs in a network by
the total number of nodes
Some characteristics
(i) β value for tree types of structures and disconnected networks would
always be less than 1. It would take zero values when there are no
edges in the network
(ii) β value for any network structure with one circuit would always be
equal to 1.
(iii) β value exceeds 1 for a complicated network structure having more
than one circuit.
https://www.linkedin.com/in/dribrahimbathisk/
8. Connectivity and its Measurement
Alpha Index (Îą):
ď§ Non-planar graph as actual circuit / maximum circuits.
ď§ The higher the index, the greater is the degree of connectivity
Gamma Index (ŇŻ): -ratio between the observed number of edges and
vertices
ď§ The connectivity as measured by y index varies from a set of nodes
having no interconnection to the one in which every node has an
edge connected to every other node in the graph.
https://www.linkedin.com/in/dribrahimbathisk/
9. Centrality within a Network:
ď§ Koning Number for describing the degree of centrality of any node
on a network
ď§ The koning number for each node is calculated by adding up the
number of arcs from each other node using the shortest path
available.
https://www.linkedin.com/in/dribrahimbathisk/
10. Spread and Diameter of Networks
Pi Index (Ď):
ď§ investigate the relationship between the total transportation network
as a whole and its diameter.
ď§ The application of Ď index to transportation network would give a
numerical value which would be greater than or equal to one.
ď§ Higher numerical values will be ascribed to more complicated
networks and it would reflect higher degree of development of the
network.
https://www.linkedin.com/in/dribrahimbathisk/
11. Spread and Diameter of Networks
Eta Index (n):
ď§ useful when some spatial characteristic of the network are under
examination.
ď§ This is also indicative of spread of a network.
ď§ total network distance / number of arcs.
ď§ This index is useful in examining the utility of a given transport
network.
https://www.linkedin.com/in/dribrahimbathisk/
12. Detours
ď§ The straight routes between two places or direct routes (also known
as âdesire lineâ) are the routes, which travellers used to follow
because of their shortest distance.
ď§ But straight routes are, however, seldom to be found in reality; even
the most direct route in practice deviates from straight line. This
type of deflection is very common due to physical obstacles.
ď§ Detour index= actual route distance/ straight line distance Ă
100/1
ď§ In other words, the detour index is the actual journey distance
calculated as a percentage of the desire line distance.
ď§ It is obvious that lower the detour index, the more direct is a given
route. The detour index is used for assessing the effects which the
addition or abstraction of links produce in a given network.
https://www.linkedin.com/in/dribrahimbathisk/
13. Geographic Information Systems for Transportation (GIS-T)
ď§ Refers to the principles and applications of applying geographic
information technologies to transportation problems.
ď§ Access and analyze;
-spatially distributed nature of transportation related data
ď§ Integration; the biggest advantage GIS
-bridge inventories; signage location, accident record and other
safety data; traffic volume and other operational data,
-Administrative, terrain, land use, demographic, environmental,
resource, and subsurface data.
https://www.linkedin.com/in/dribrahimbathisk/
14. Geographic Information Systems for Transportation (GIS-T)
GIS-T studies can be grouped into
ď§ Data representations;
How can various components of transport systems be represented?
ď§ Analysis and modeling;
How can transport methodologies be used in a GIS-T?
ď§ Applications;
What types of applications are particularly suitable for GIS-T?
https://www.linkedin.com/in/dribrahimbathisk/
15. GIS-T; Potential applications in transportation planning
ď§ Executive information system.
ď§ Pavement management system.
ď§ Bridge management.
ď§ Maintenance management.
ď§ Safety management.
ď§ Transportation system management (TSM)
ď§ Travel demand forecasting
ď§ Corridor preservation and right-of-way
ď§ Construction management
ď§ Hazardous cargo routing
ď§ Overweight/oversize vehicles permit routing.
ď§ Accident analysis
ď§ Environment impact
ď§ Land side economic impact and value-capture analysis and Others.
https://www.linkedin.com/in/dribrahimbathisk/
17. Directions (Route) Service
ď§ Point-to-point routing â Simple
Route
ď§ Find the best route for visiting a
series of stops that minimizes
travel time or travel distance â
Optimized route
ď§ Use live traffic conditions
ď§ Driving directions in many languages
https://www.linkedin.com/in/dribrahimbathisk/
18. Finding the best route
ď§ ArcGIS Network Analyst can find the best way to get from
one location to another or the best way to visit several
locations.
ď§ The locations can be specified interactively by placing points
on the screen, by entering an address, or by using points in an
existing feature class or feature layer.
ď§ The best route can be determined for the order of locations as
specified by the user.
ď§ Alternatively, ArcGIS Network Analyst can determine the best
sequence to visit the locations.
https://www.linkedin.com/in/dribrahimbathisk/
19. What's the best route?
ď§ Whether finding a simple route between two locations or one
that visits several locations, people usually try to take the best
route. But best route can mean different things in different
situations.
ď§ The best route can be the quickest, shortest, or most scenic
route, depending on the impedance chosen. If the
impedance is time, then the best route is the quickest route.
ď§ Hence, the best route can be defined as the route that has the
lowest impedance, where the impedance is chosen by the user.
Any valid network cost attribute can be used as the impedance
when determining the best route.
https://www.linkedin.com/in/dribrahimbathisk/
20. The quickest path is shown in blue and has a
total length of 4.6 miles, which takes 8
minutes
the length of the shortest path is 4.5
miles, which takes 9 minutes
https://www.linkedin.com/in/dribrahimbathisk/
21. Along with the best route, Network
Analyst provides directions with
turn-by-turn maps that can be
printed.
https://www.linkedin.com/in/dribrahimbathisk/
24. Finding the closest facility
ď§ Finding the closest hospital to an accident, the closest police cars to
a crime scene, and the closest store to a customer's address are all
examples of closest facility problems.
ď§ When finding closest facilities, you can specify how many to find
and whether the direction of travel is toward or away from them.
ď§ Once you've found the closest facilities, you can display the best
route to or from them, return the travel cost for each route, and
display directions to each facility.
ď§ Additionally, you can specify a cutoff cost beyond which ArcGIS
Network Analyst should not search for a facility.
ď§ For instance, you can set up a closest facility problem to search for
hospitals within 15 minutes' drive time of the site of an accident.
ď§ Any hospitals that take longer than 15 minutes to reach will not be
included in the results.
https://www.linkedin.com/in/dribrahimbathisk/
25. ď§ The hospitals are referred to as facilities, and the accident is referred to as an incident.
ď§ ArcGIS Network Analyst allows you to perform multiple closest facility analyses
simultaneously.
ď§ This means you can have multiple incidents and find the closest facility or facilities to each
incident.
https://www.linkedin.com/in/dribrahimbathisk/
26. ď§ The hospitals are
referred to as facilities,
and the accident is
referred to as an
incident.
ď§ Network Analyst allows
you to perform multiple
closest facility analyses
simultaneously.
ď§ This means you can have
multiple incidents and
find the closest facility
or facilities to each
incident
https://www.linkedin.com/in/dribrahimbathisk/
27. Finding service areas
ď§ With Network Analyst, you can find service areas around any
location on a network.
ď§ A network service area is a region that encompasses all
accessible streets, that is, streets that lie within a specified
impedance.
ď§ For instance, the 5 or 10 -minute service area for a point
includes all the streets that can be reached within five or ten
minutes from that point.
https://www.linkedin.com/in/dribrahimbathisk/
30. What is accessibility?
ď§ Accessibility refers to how easy it is to go to a site.
ď§ In ArcGIS Network Analyst, accessibility can be measured in
terms of travel time, distance, or any other impedance on the
network.
ď§ Evaluating accessibility helps answer basic questions, such as,
"How many people live within a 10-minute drive from a movie
theater?" or "How many customers live within a half-kilometer
walking distance from a convenience store?"
ď§ Examining accessibility can help you determine how suitable a
site is for a new business.
ď§ It can also help you identify what is near an existing business to
help you make other marketing decisions.
https://www.linkedin.com/in/dribrahimbathisk/
31. Evaluating accessibility
ď§ One simple way to evaluate accessibility is by a buffer distance
around a point.
ď§ For example, find out how many customers live within a 5-
kilometer radius of a site using a simple circle.
ď§ However, considering people travel by road, this method won't
reflect the actual accessibility to the site.
ď§ Service networks computed by ArcGIS Network Analyst can
overcome this limitation by identifying the accessible streets
within five kilometers of a site via the road network.
ď§ Once created, you can use service networks to see what is
alongside the accessible streets, for example, find competing
businesses within a 5-minute drive.
https://www.linkedin.com/in/dribrahimbathisk/
34. ď§ Multiple concentric service areas show how accessibility changes with an increase in impedance.
ď§ It can be used, for example, to show how many hospitals are within 5-, 10-, and 15-minute drive times
of schools.
https://www.linkedin.com/in/dribrahimbathisk/
35. ď§ Multiple concentric service areas show how accessibility changes with an increase in
impedance.
ď§ It can be used, for example, to show how many hospitals are within 5-, 10-, and 15-
minute drive times of schools.
https://www.linkedin.com/in/dribrahimbathisk/
36. Creating an O-D cost matrix
ď§ With ArcGIS Network Analyst, you can create an originâ
destination (OD) cost matrix from multiple origins to
destinations.
ď§ An OD cost matrix is a table that contains the total impedance
from each origin to each destination.
ď§ Additionally, it ranks the destinations that each origin connects to
in ascending order of the time it takes to travel from that origin to
each destination.
ď§ The paths from each origin to each destination are represented as
straight lines on the map, which can be symbolized by color,
representing which point they originate from; or by thickness,
representing the travel time of each path.
https://www.linkedin.com/in/dribrahimbathisk/
38. The straight lines can be symbolized in various ways, such as by color,
representing which point they originate from, or by thickness, representing the
travel time of each path.
https://www.linkedin.com/in/dribrahimbathisk/
41. Out of the current set of fire stations, nine fire stations can close, and a minimum of seven are
needed for the department to still be able to respond to emergencies within three minutes.
https://www.linkedin.com/in/dribrahimbathisk/