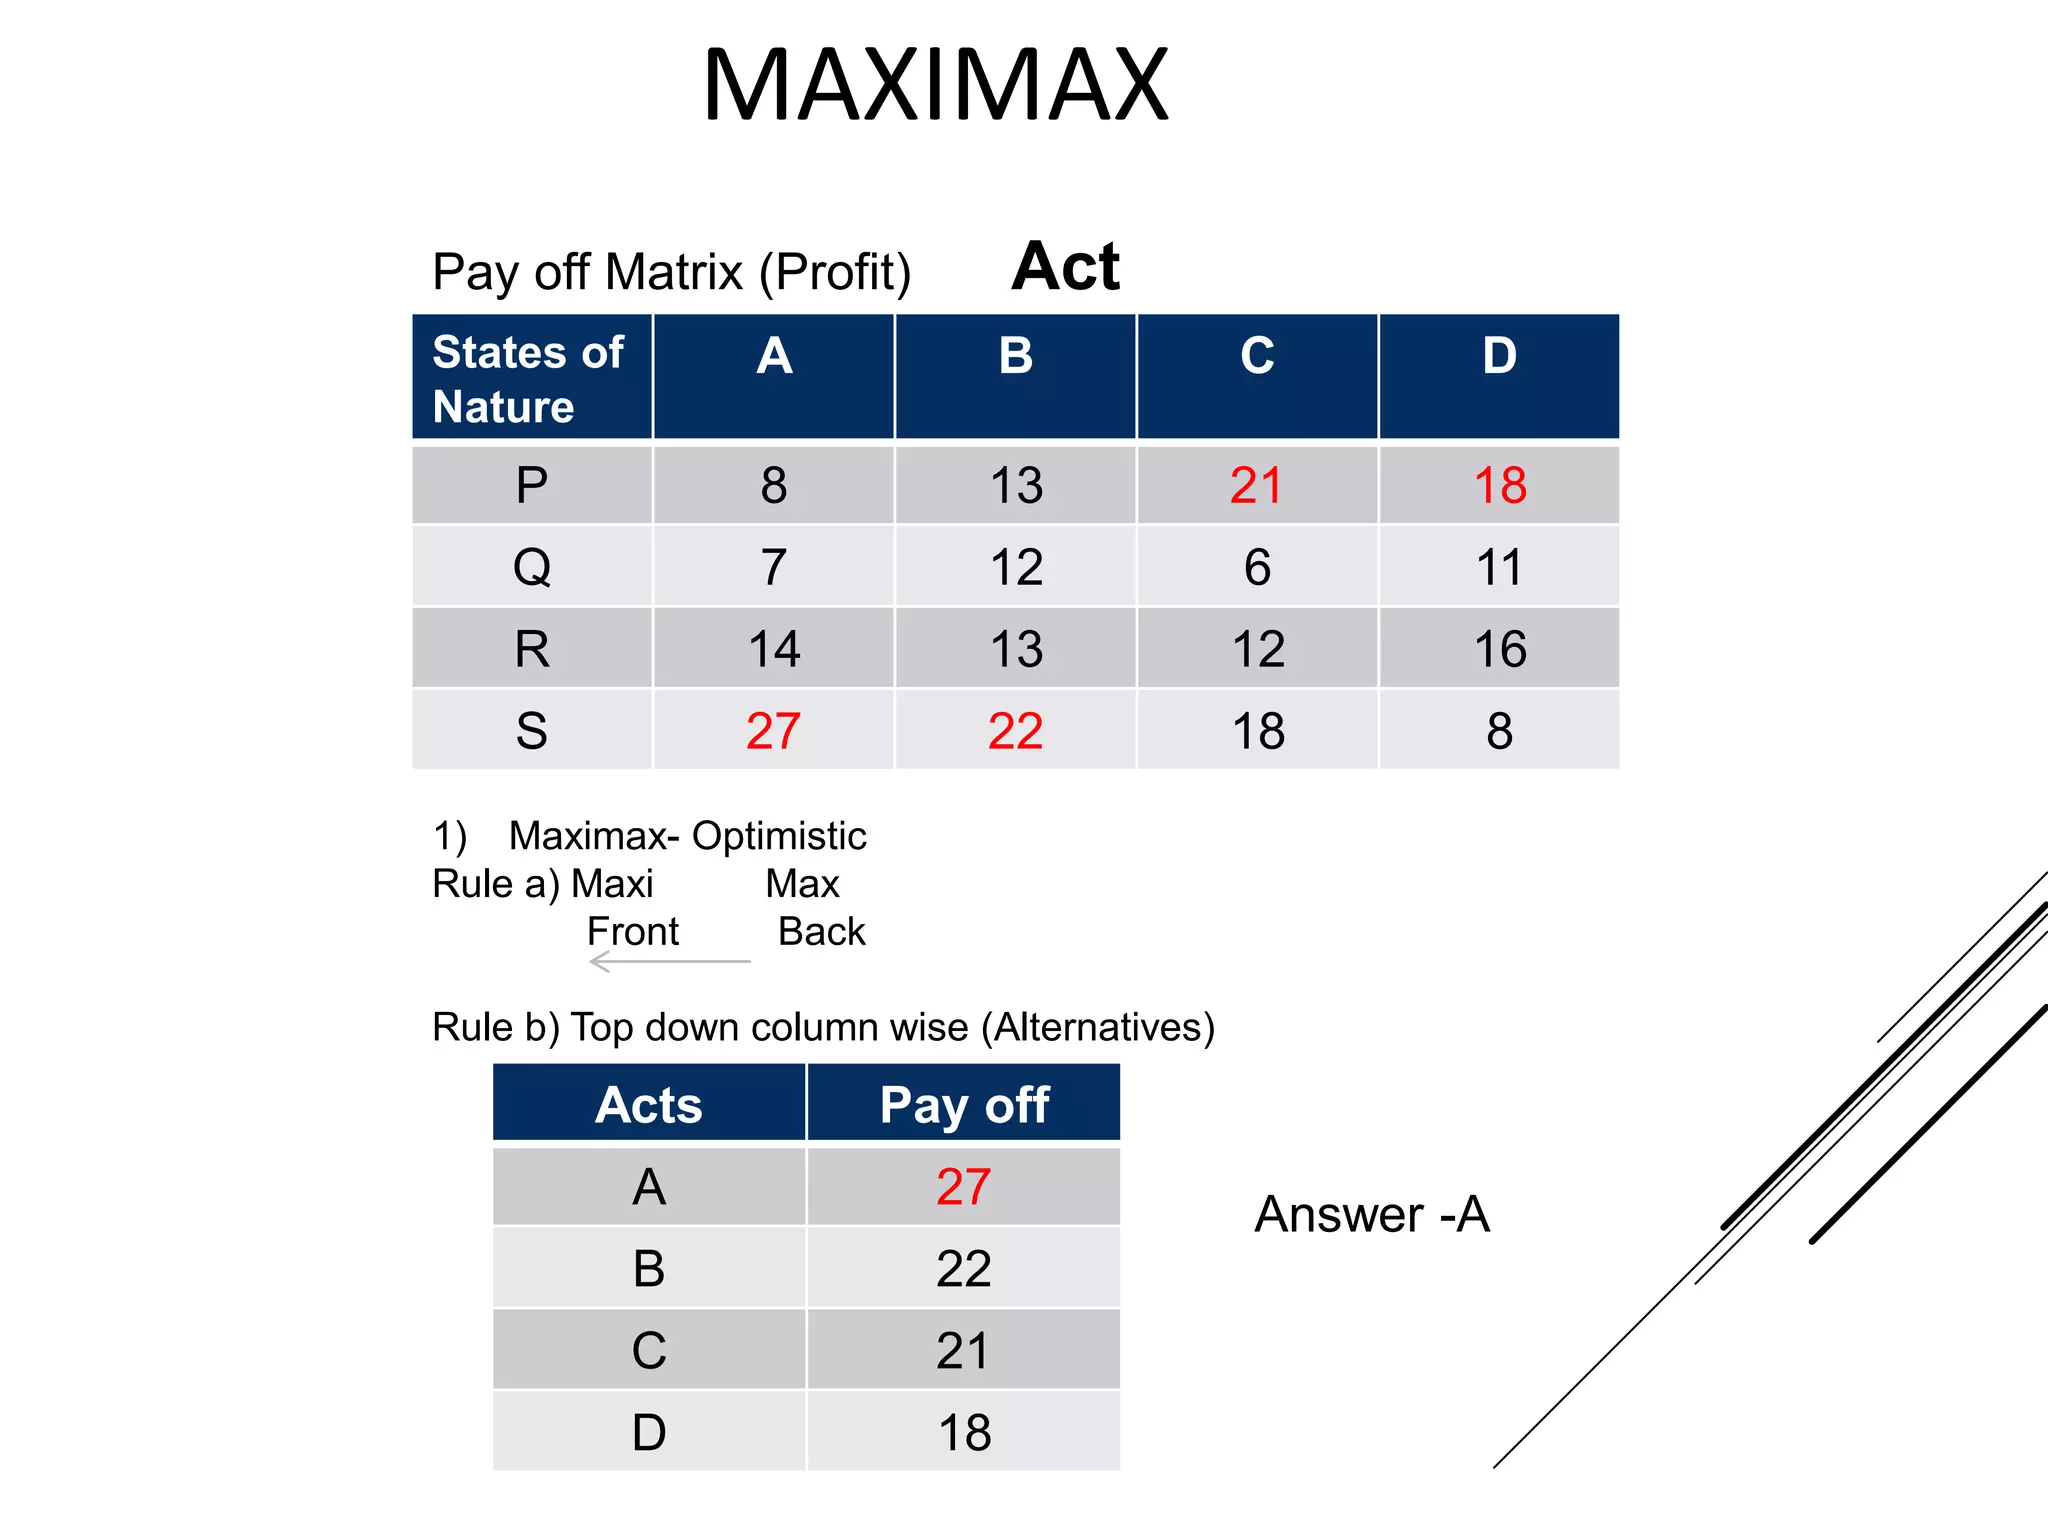
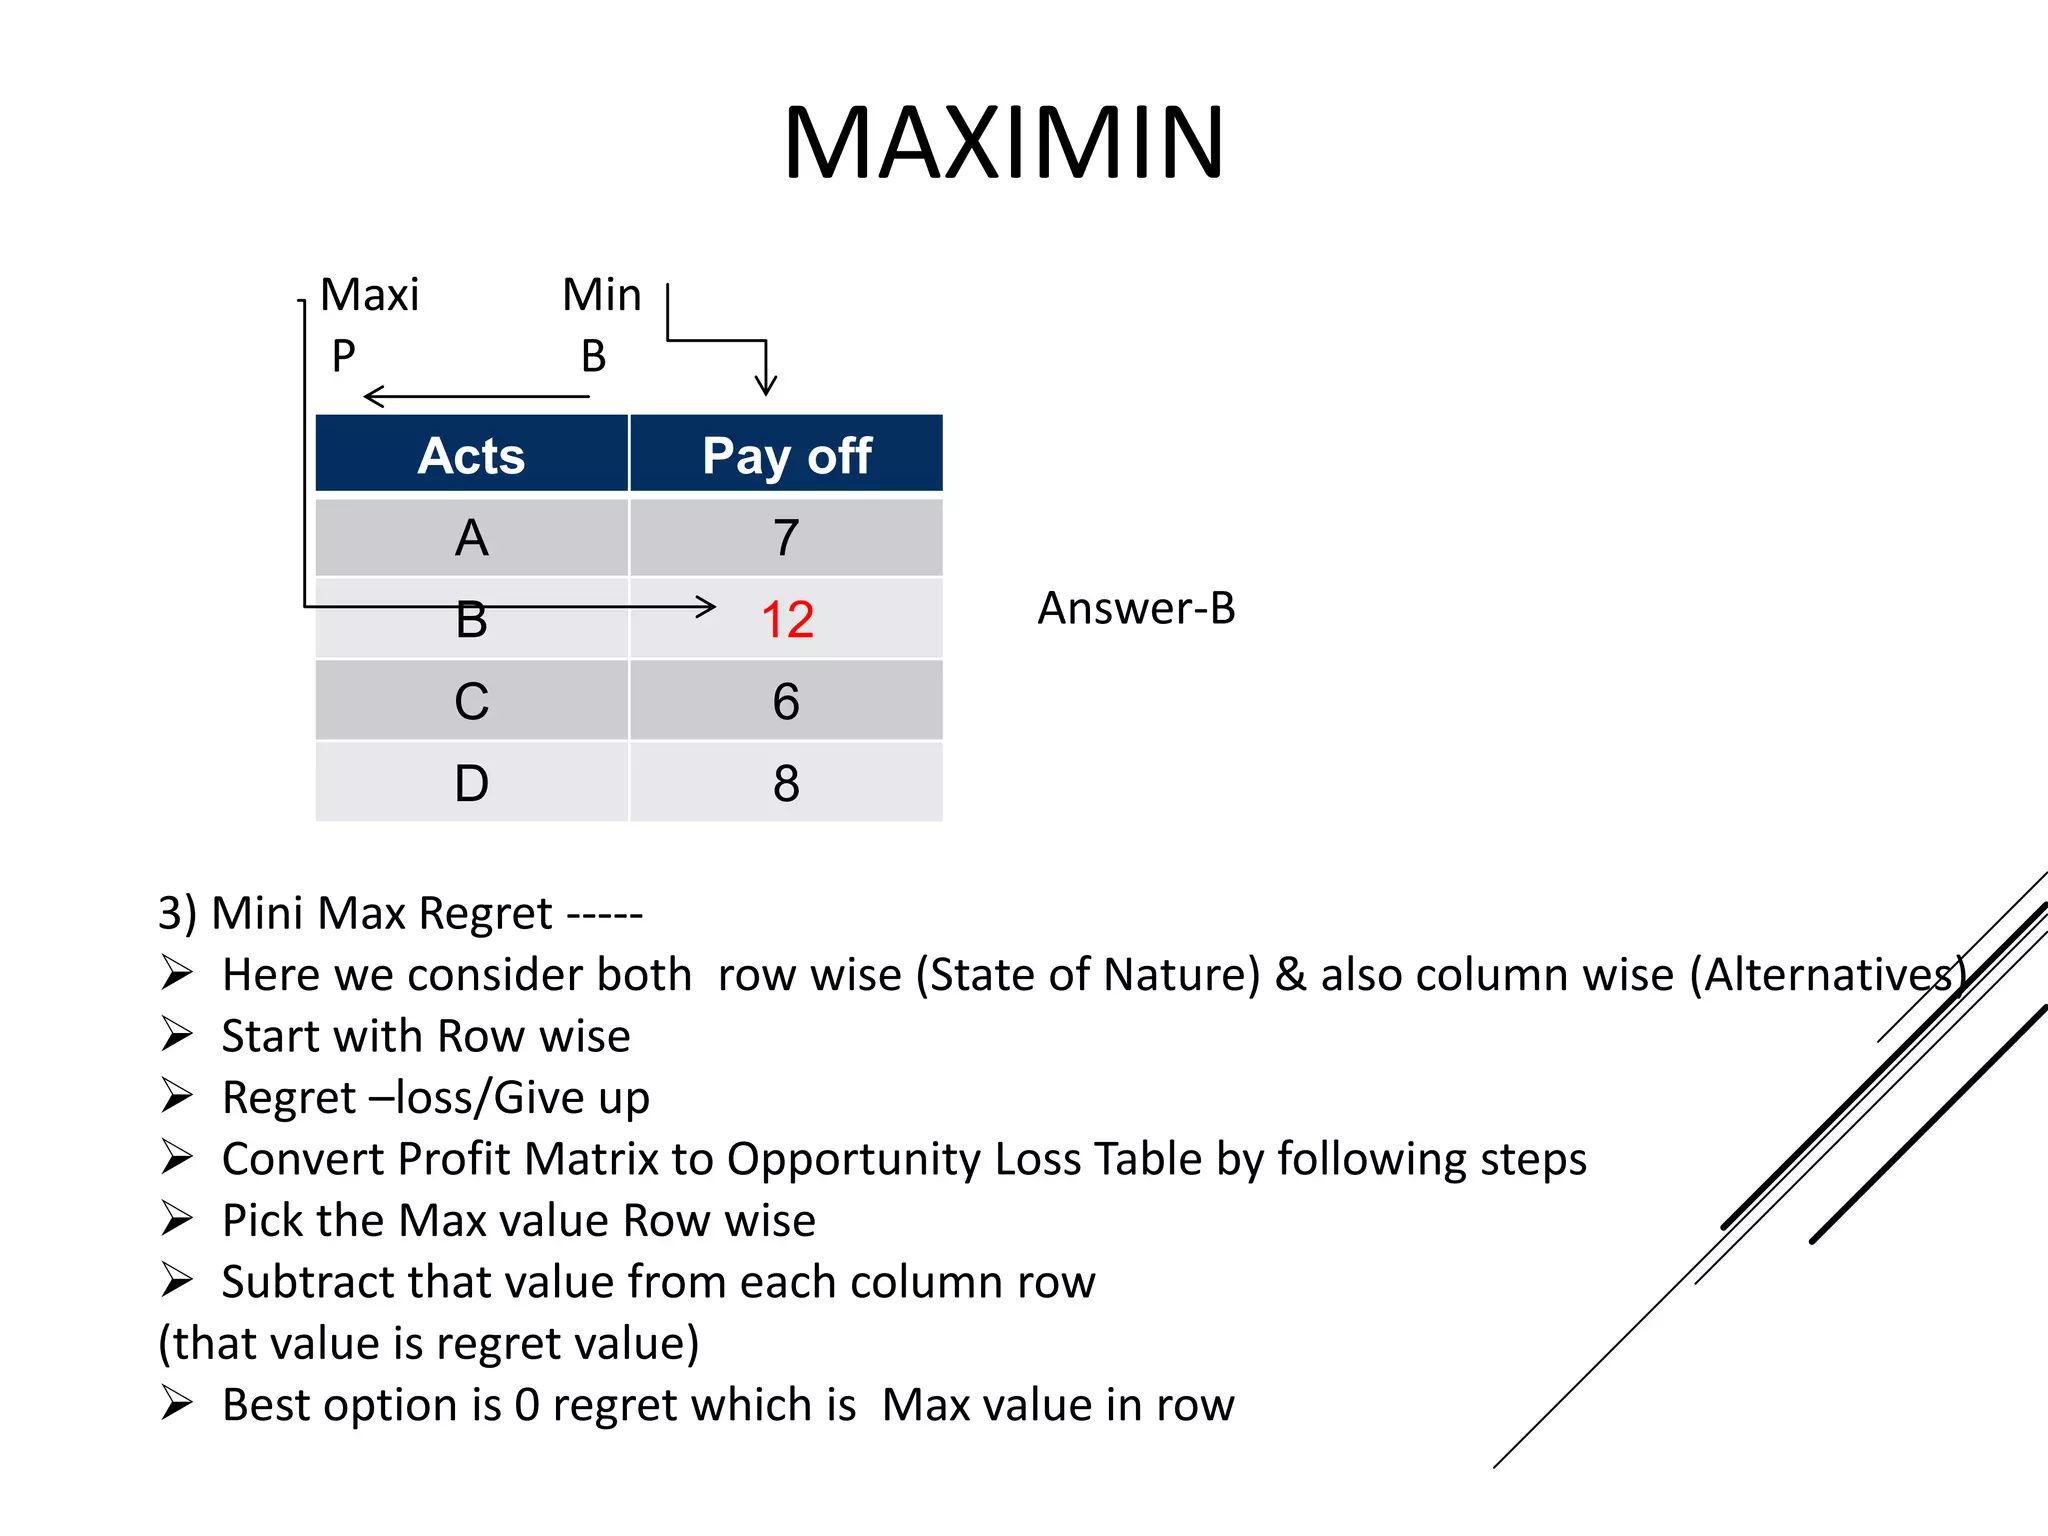
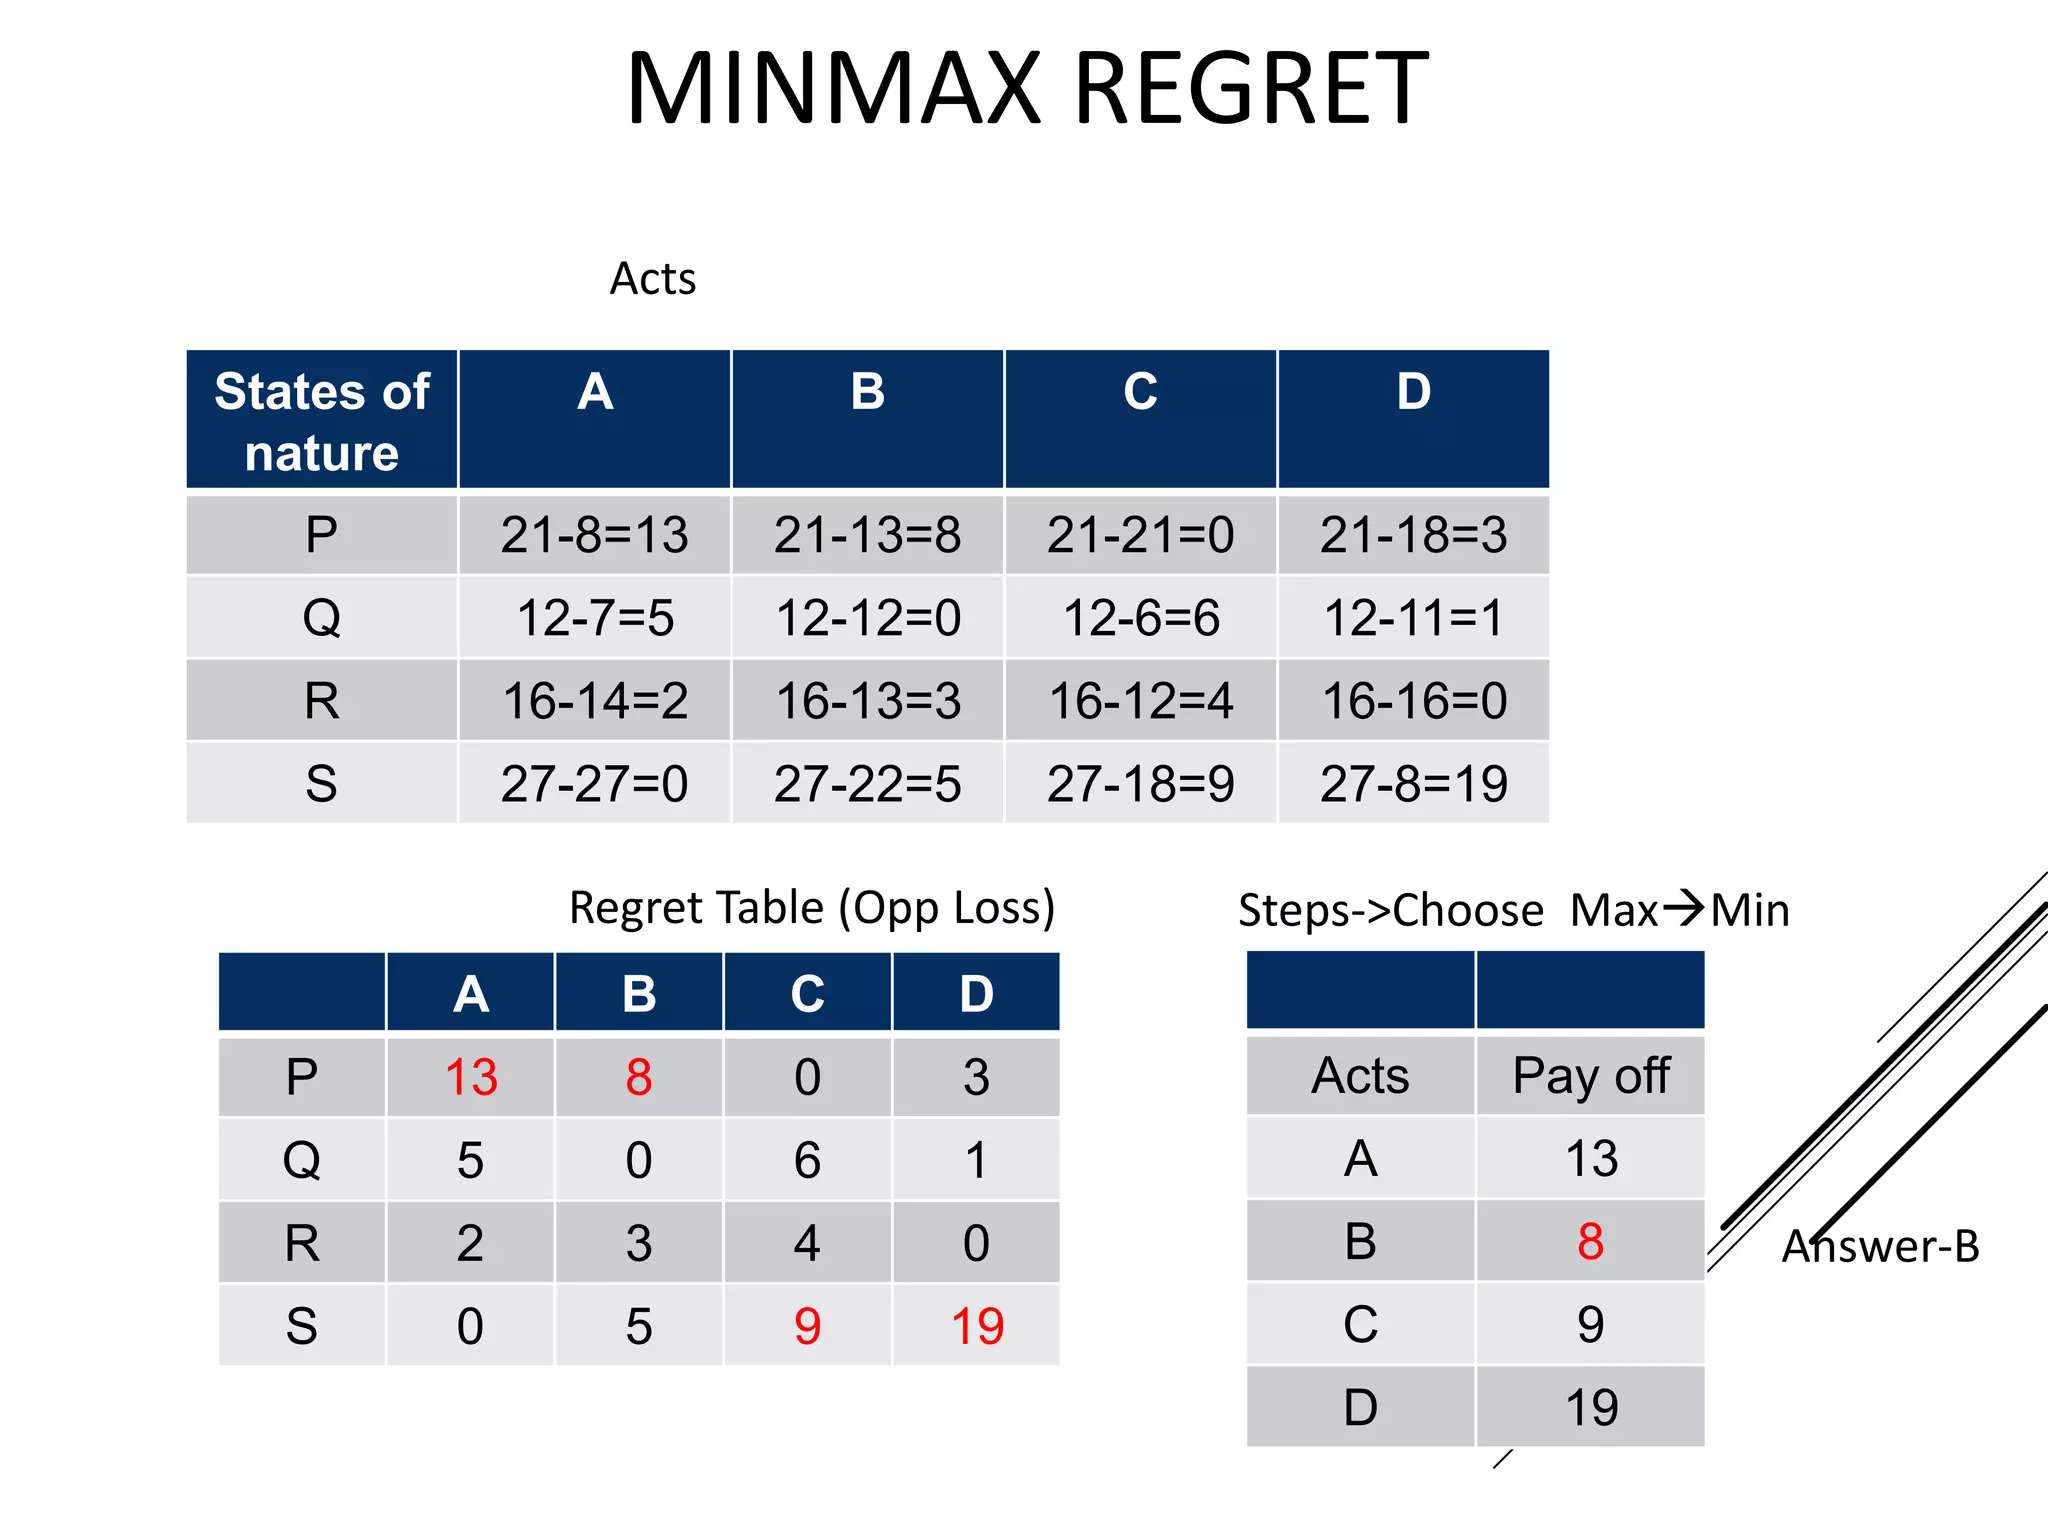
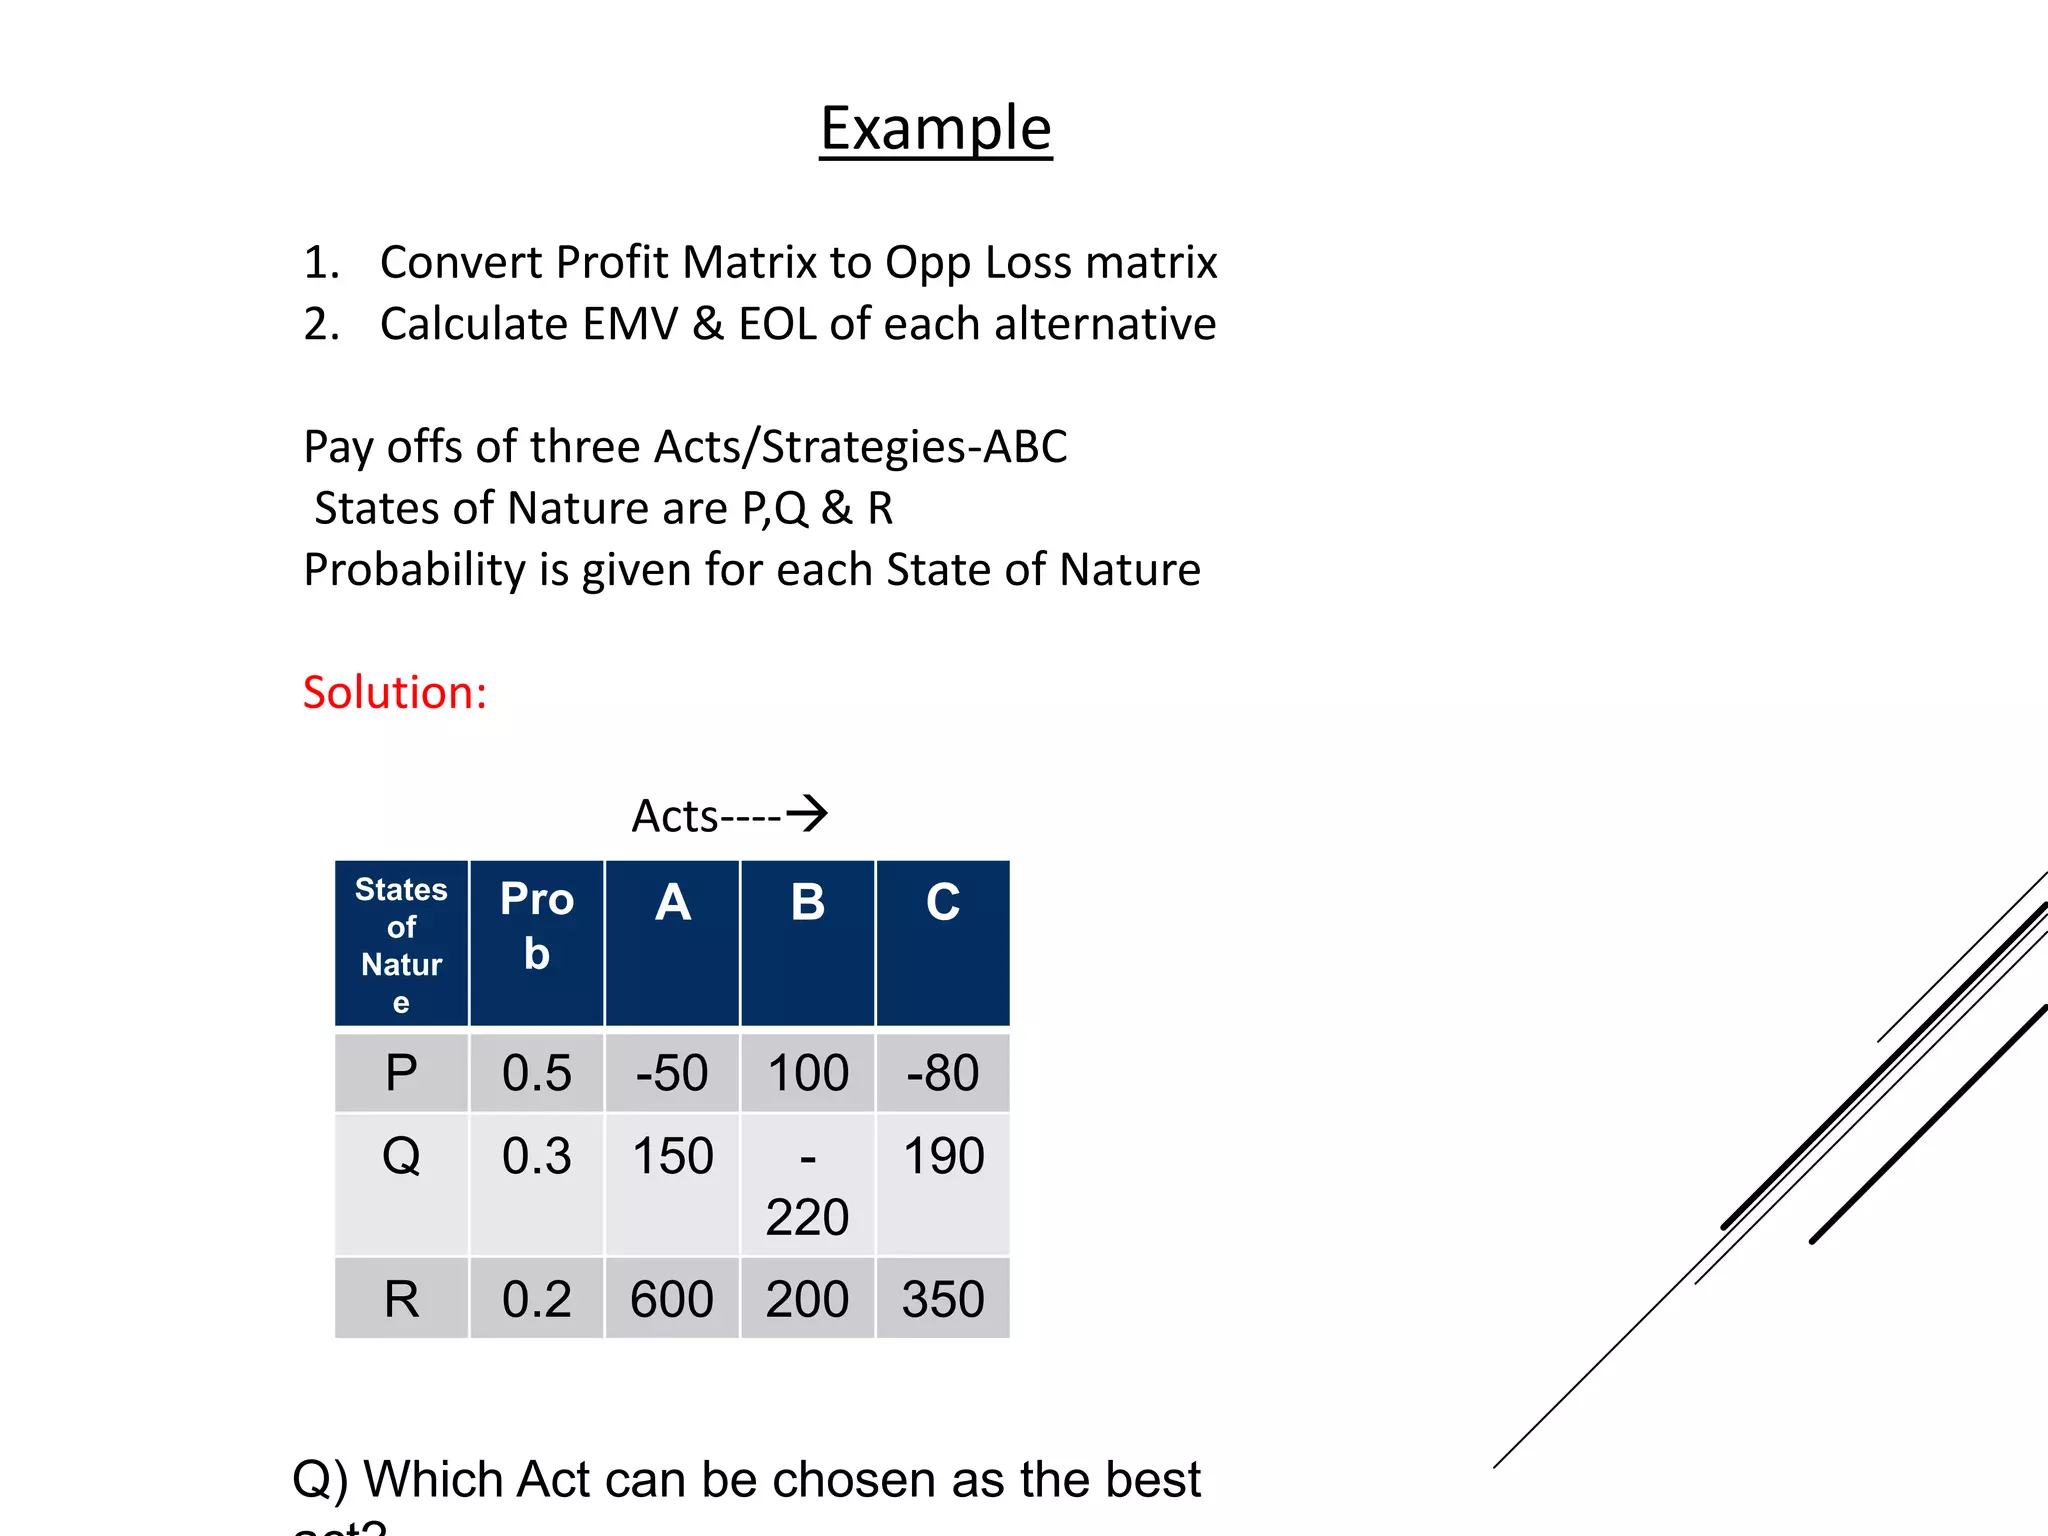
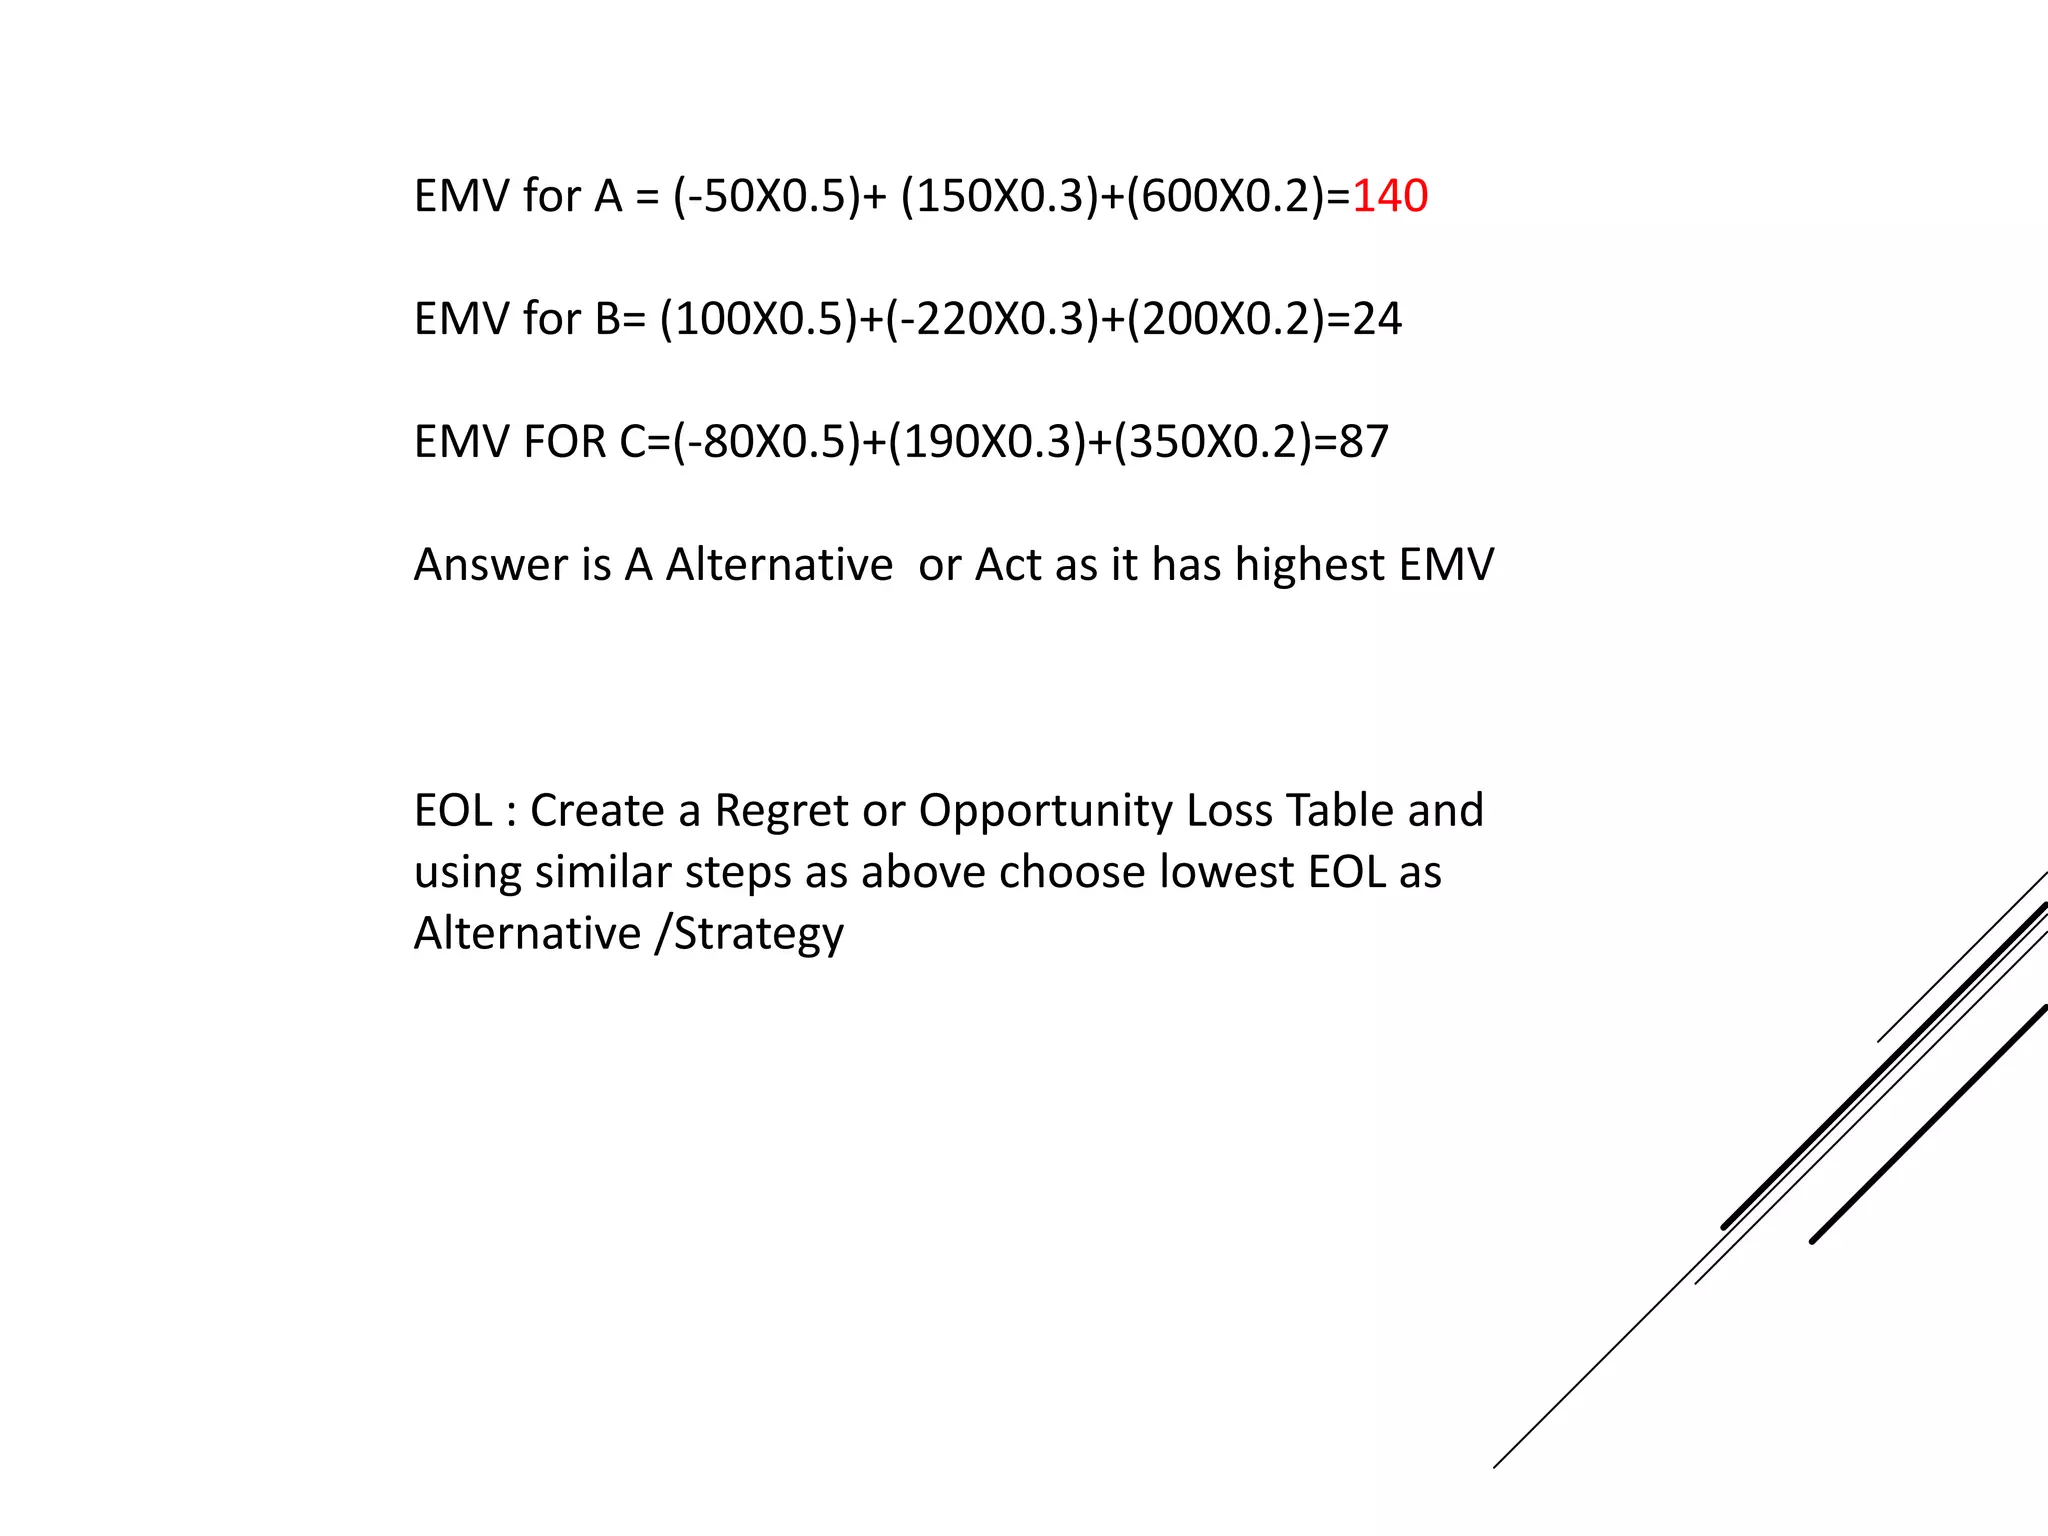
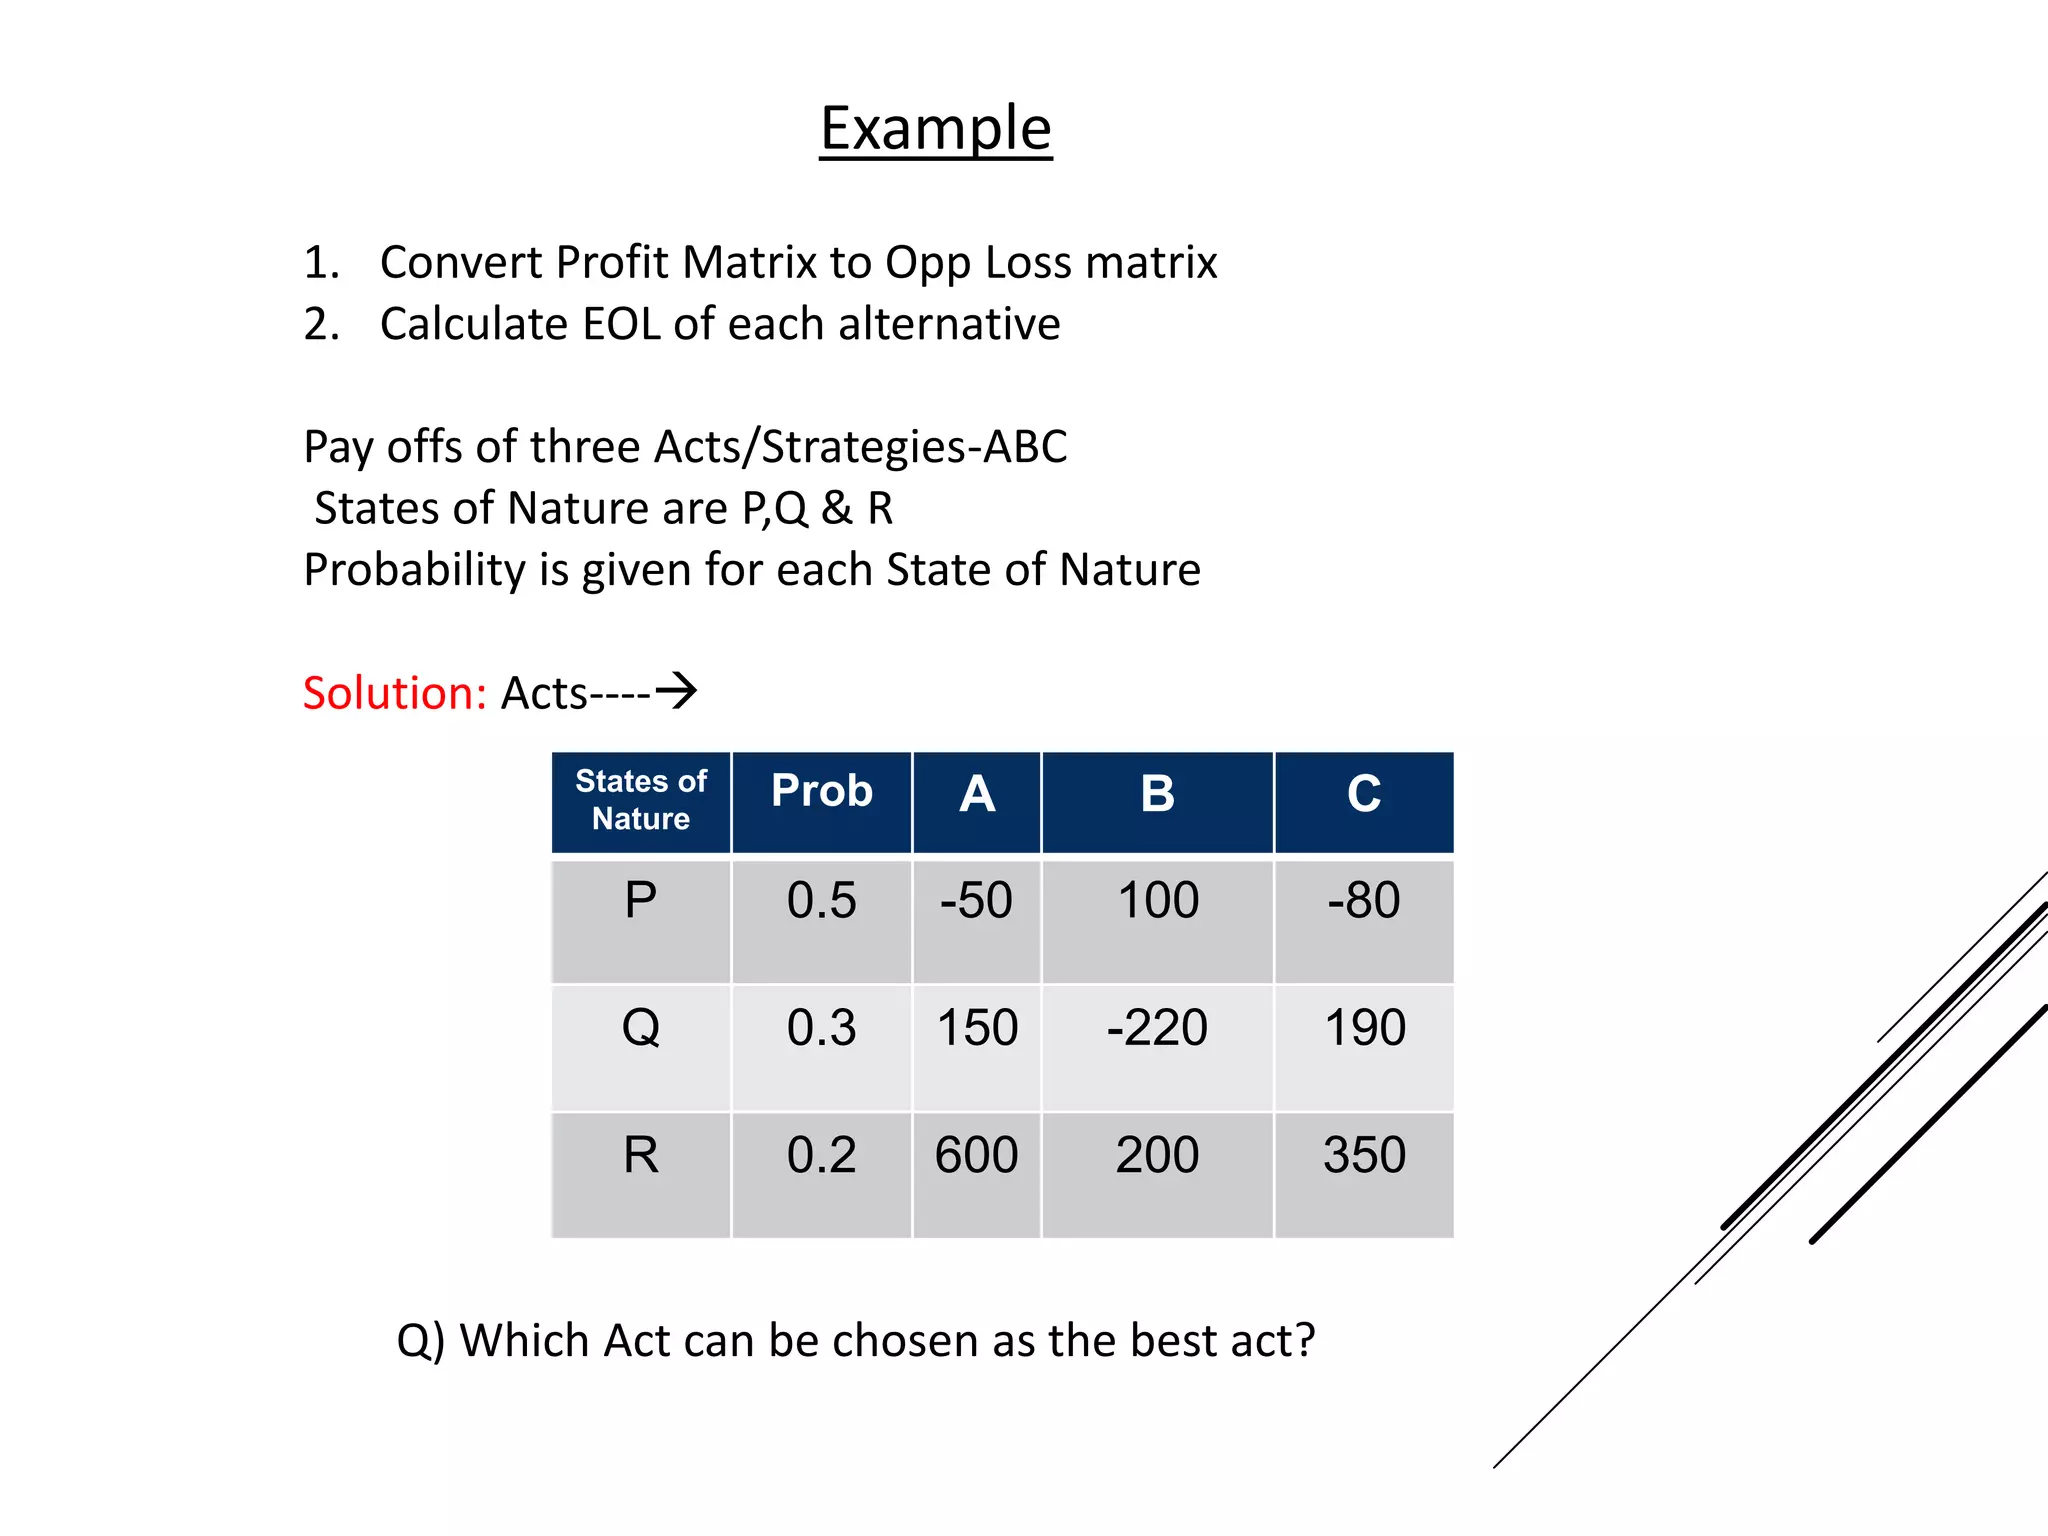
Introduction to
Information Systems
DR SAUMENDRA MOHANTY
INTRODUCTION TO INFORMATION SYSTEMS IS WRITTEN PREDOMINANTLY KEEPING IN
MIND THE FIRST FORAY INTO THE WORLD OF IT (INFORMATION TECHNOLOGY) FOR
NON TECHNOLOGY BACKGROUND STUDENTS PURSUING MBA /PGDM COURSES
THE STYLE IS DELIBERATELY KEPT SIMPLE PRESENTATION TYPES WITH BULLET POINTS
APPROACH TO ENSURE THAT KEY CONCEPTS CAN BE QUICKLY ASSIMILATED
THE EFFORT IS TO ENCOURAGE STUDENTS WITH NON TECHNOLOGY BACKGROUND TO
TAKE UP IT & BUSINESS ANALYTICS COURSES AS NEXT STEP
THE E BOOK HAS 5 CHAPTERS STARTING FROM RAW DATA AND ENDING WITH
INTRODUCTION TO EXPERT SYSTEMS (ARTIFICIAL INTELLIGENCE )
CONCEPTS ARE EXPLAINED WITH DIAGRAMS AND NUMERICAL EXAMPLES WHEREVER
APPLICABLE
COPYRIGHTS WITH DR SAUMENDRA MOHANTY
PREFACE
TABLE OF CONTENTS
CHAPTER 1 : DIKW MODEL MAPPED TO INFORMATION SYSTEMS
CHAPTER 2 : TYPES OF INFORMATION SYSTEMS TPS, MIS ,DSS & EIS
CHAPTER 3 : DECISION THEORY WITH EXAMPLES
CHAPTER 4 : KNOWLEDGE MANAGEMENT SYSTEMS
CHAPTER 5: EXPERT SYSTEMS
CHAPTER 1 : DIKW MODEL MAPPED
TO INFORMATION SYSTEMS
DATA
INFORMATION
KNOWLEDGE
WISDOM
DIKW MODEL PYRAMID
CORPORATE PYRAMID
INFORMATION SYSTEMS PYRAMID
DECISION MAKING TYPES PYRAMID
KEY CONCEPTS
230975 IS DATA
23/09/75 IS DATA – IT COULD BE ANYONE’S DOB
DOB 23/09/76 SURESH – DATA – COULD BE ANY SURESH IN THE WORLD
DOB 23/09/76 SURESH S/O OF RAMESH – DATA –COULD BE ANY SURESH S/O OF
RAMESH
DOB 23/09/76 SURESH S/O RAMESH R/O OF …….
IS INFORMATION NOW AS THERE IS “CONTEXT “ TO DATA
WHAT IS DATA
DATA IS COLLECTION OF RAW FACTS AND FIGURES
DATA CAN BE REPRESENTED BY ALPHABETS, NUMBERS , SPECIAL CHARACTERS, IMAGES
AND VIDEOS
A-Z , A-Z , 0-9 , @#$%&*<>>,.”;’
TAKEN IN ISOLATION “DATA “ CONVEYS NO MEANING OR CONTEXT
WHAT IS DATA
“PROCESSED” DATA IS “INFORMATION”
THERE CAN BE MULTIPLE PROCESSES ON DATA TO GET THE INFORMATION
DATA + CONTEXT = INFORMATION
INFORMATION
120/80 ,130/90, 140/100 , 150 /110 IS DATA
BP I 120/80 ,130/90, 140/100 , 150 /110 IS STILL DATA
BP I DATE I TIME I NAME I 120/80 ,130/90, 140/100 , 150 /110 IS “INFORMATION”
ABOUT BLOOD PRESSURE AS CONTEXT
BP I DATE I TIME I NAME I 120/80 ,130/90, 140/100 , 150 /110 I LOW ,AVERAGE ,HIGH –
IS KNOWLEDGE
INFORMATION + RULES = KNOWLEDGE
INFORMATION & KNOWLEDGE
IN THE PREVIOUS EXAMPLES OF BP READINGS , HERE IS DECISION OF 3 DOCTORS
DECISION OF 1ST DOCTOR ON BP READING –TAKE REST
DECISION OF 2ND DOCTOR ON BP READING –TAKE MEDICINES
DECISION OF 3RD DOCTOR ON BP READING – GET HOSPITALIZED
KNOWLEDGE + EXPERIENCE = WISDOM
KNOWLEDGE & WISDOM
DATA IS CONSIDERED THE NEW “OIL” BUT IS “USELESS” OR IS LIKE “CRUDE OIL” (WHAT
IS THIS LIQUID ?)
INSIGHTS AND INFORMATION PROCESSED FROM DATA IS “REFINED OIL” (WHATS TO BE
DONE TO CONVERT TO DIESEL/PETROL )
WHERE TO USE THE OIL IS KNOWLEDGE (APPLICATION OF OIL- AUTOMOBILES,
AVIATION, INDUSTRY)
WHETHER TO USE THE OIL , CONSERVE OR SELL IS WISDOM ( PREDICTION /FUTURE
FORECAST-OPEC MODEL )
DIKW MODEL
DIKW Model
Corporate Pyramid mapped to
DIKW
Information Systems Pyramid
mapped to DIKW/Corp Pyramid
Definitrmri
on
Vision
Knowledge
Info
Data
EIS
DSS
MIS
TPS
CEO
Sr Mgmt
Middle Mgmt
Executive
Information System (IS)
mapped to DIKW Model
IS = TPS+MIS+DSS+EIS
DIKW IS Hierarchy Corp Pyramid
Decision making Pyramid
CHAPTER 2 : TYPES OF INFORMATION
SYSTEMS - TPS, MIS
DSS & EIS
DEFINITION OF “SYSTEM” - A SYSTEM IS A SET OF RULES, AN ARRANGEMENT OF
THINGS, OR A GROUP OF RELATED THINGS THAT WORK TOWARDS A COMMON GOAL
SYSTEM IS A GENERAL SET OF PARTS, STEPS, OR COMPONENTS THAT ARE CONNECTED
TO FORM A MORE COMPLEX WHOLE.
WHAT IS SYSTEM
HARDWARE – PHYSICAL DEVICES –COMPUTERS , TABLETS , MOBILE PHONES
SOFTWARE – TELLS THE HARDWARE WHAT TO DO
DATA –INFORMATION MANIPULATED BY SOFTWARE
PEOPLE –USERS , PROGRAMMERS ,ANALYSTS , IT DEP'T
PROCESS- STEPS TO ACCOMPLISH A GOAL
TELECOMMUNICATIONS /NETWORKING
FIVE COMPONENTS OF – INFORMATION SYSTEM
(IS)
Information Systems
Information Systems
layout
User Interface
Appl s/w
(Logic)
Database
Hardware
Telecom/ Internet
(Network)
IS = TPS+MIS+DSS+EIS
Users- Executive , Middle Mgmt , Sr Mgmt & CEO
MANAGEMENT INFORMATION SYSTEM
WHAT IS MIS
Difference between IT and IS
• Information Technology (IT) deals with Technology
• - Hardware
• -Software
• - Networking
while
• Information Systems (IS) deals with
• -Technology
• People
• -Process
• IS Relates to Business using Technology
IT and IS
Information System vs Information Technology
Information Technology
 Hardware
 Software
 Database
 Network
Information
System
Are used to
build
Marketing System
Customer Service
Payroll System
Inventory System
Types of Information Systems
• Information Systems can be broadly divided into following four categories:
• TPS – Transaction Processing System
• MIS – Management Information System
• DSS – Decision Support System
• EIS – Executive Information System
Types of Business Information
Systems
• Operations Support – Provided by TPS
• Management Support – Provided by MIS , DSS & EIS
• Other Business Support Systems
 GDSS ( Group Decision Support System )- Communications (Chat/Mail ) ,
Conferencing ( Audio/Video Conferencing ) and Collaboration ( Workflow)
 Knowledge Management
 Expert Systems
Types of Decisions
• Structured – Inventory Re order Decision
• Semi Structured – Which product lines to add in next 1 year
• Structured – Which business to be in next 5 years
Transaction Processing System (TPS)
• Captures daily transactions like POS (Point of Sale ) data in Store
• Helps in Operational Level of Management ( lower Management)
• Online (POS) or Batch Processing
• Pre defined transactions
• No decision making
• Structured problems
• Follows ACID Mode
ACID Principle of TPS
• All TPS model follow ACID Principle
• A – Atomicity – Transaction is Full or None
• C – Consistency – All transactions within defined boundary ex ATM limit of 10K
cash withdraw per transaction
• I – Integrity – All Credits and Debits will be done simultaneously
• D- Durability – Maintain Log Reports of who used the system , when
TPS Classifier -ACID Test for TPS
• A – Atomicity- TPS is complete in full or not
• C-Consistency- set of operating rules and constraints of Database Mgmt.
• I – Isolation – Each TPS is different even if they are at same time
• D –Durability – TPS once done cannot be undone
Five Stages of TPS
Use Case : Point of Sale
Data Entry
• Barcode
• Manual
Transaction Process
 Batch
 Online/Real time
Document
&
Report generation
Database
3
2 3
5
Inquiry Processing
Online Queries
(Pre defines)
Routine Query
Payroll System as TPS
MIS Reports
Payroll
System
D/B
Employee Data
Name
Address
Salary
DOJ
Tax
Online Queries
(Pre defined)
Employee Pay check
Pre defined Output
Example :Employees earning > Rs 2,00,000/Month – will come from MIS not TPS
Management Information System
(MIS)
• Captures data from TPS
• Summarizes TPS Data
• Provides “Organization Performance Reports”
• Mostly Structured –Pre Defined decision making
• Little Analytics
• Example : Grade Sheet of Class Term Result is MIS (Performance of Class)
4 Types of MIS Reports
1. Periodic and Scheduled Reports – provided on regular basis – daily
/weekly/fortnightly/monthly ex Sales Reports ,Production & Inventory Reports
2. Exceptional Reports – Only in exceptional conditions , may be periodic and non
periodic. Periodic to decrease info overload , non periodic ex exceeding Credit limit
3.Demand and Response –Available on demand – Customized Reports , Web Based ,
RDBMS query
4.Push Reports – Automatically pushed on desktops ex Newsfeeds of competition,
stock prices
TYPICAL MIS REPORTS
2015 Ticket Sales
Movie Genre January February March April May June July August
Septembe
r October November December TOTAL
Comedy 49,832 47,232 40,002 37,283 32,910 33,829 30,102 32,111 34,921 30,293 28,392 24,192 421,099
Thriller 12,839 16,828 15,839 18,082 24,932 30,462 34,240 42,718 41,128 39,382 36,621 37,283 350,354
Documentary 9,118 9,907 7,257 7,838 6,372 5,992 5,773 5,993 6,302 8,103 9,100 9,278 91,033
Romance 14,381 14,651 11,969 14,602 13,046 14,411 13,871 14,184 13,033 14,625 12,196 13,081 164,050
TOTAL 86,170 88,618 75,067 77,805 77,260 84,694 83,986 95,006 95,384 92,403 86,309 83,834
TYPICAL MIS VISUALIZATION
0
10,000
20,000
30,000
40,000
50,000
60,000
1 2 3 4 5 6 7 8 9 10 11 12
Column Chart
Comedy Thriller Documentary Romance
Decision Support System (DSS)
• Non Routine Decisions
• Semi Structured Decisions – 50/50
• 2 Categories
-Model Based
- Data Based
• Used infrequently only when problems /opportunity analysis
DSS
• Model Based – Use of Statistical Models – result is know , arrive at correlation
between 2 variables – ex behavioural analysis – Cross and Up Sell in E Commerce
• Data Based – Use Data from TPS /MIS to slice /dice/ consolidate /replicate and
arrive at new knowledge which was not known
ex Yield Management System ( Dynamic ticket pricing of Airlines ) based on
optimization model
Components of DSS
S/W Web Browser Other S/W
User Interface (UI)
Model Management Function
• Analytical Model
• Statistical Model
Data Management Function
Data Extraction, Validation, Consolidation & Replication
Operational
Data
Market
Data
Sales
Data
Customer
Data
Data Marts & Other Databases
Executive Information System (EIS)
• Decisions taken at Top level
• Totally unstructured decisions based on data , insights, intuition and experience
• Data is 2 types
- Internal Data – From DSS
- External Data – Sensex , Standard and Poor type reports , Govt Policies , Industry
Reports
• Dashboard is Graphical /Charts
CHAPTER 3 : DECISION THEORY
WITH EXAMPLES
DECISION THEORY IS A STATISTICAL TOOL OR TECHNIQUE WHICH IS USED TO
SELECT THE BEST WAY OF DOING WORK, HELPS IN DECISION BY SELECTING THE
BEST OUTCOME OUT OF MANY ALTERNATIVES USING DATA
DECISION THEORY
1. ACTIONS / ACTS /ALTERNATIVES /STRATEGIES – CHOOSE 1 OUT OF 2 OR MORE
ALTERNATIVES .USUALLY REPRESENTED AT ACTS AND REPRESENTED BY ALPHABETS A,B
,C ,D …..IN A TABLE ACTS ARE USUALLY REPRESENTED IN “COLUMNS”
2.STATES OF NATURE – MUTUALLY EXCLUSIVE AND EXHAUSTIVE CHANCE EVENTS. AT A
TIME ONLY 1 CHANCE EVENT WILL HAPPEN OUT OF FINITE NUMBER OF EXHAUSTIVE
EVENTS. IN A TABLE , STATES OF NATURE USUALLY ARE REPRESENTED AS “ ROWS”
ACTS OR ALTERNATIVES ARE UNDER OUR CONTROL WHILE STATES OF NATURE ARE NOT
UNDER OUR CONTROL
EXAMPLE – “ STOCK” IS ALTERNATIVE WHILE “DEMAND” IS STATE OF NATURE
3. OUTCOME /RESULTS – THE SET OF CONSEQUENCES RESULTING FROM ALL ACTS &
STATES OF NATURE
4. OBJECTIVE VARIABLES – QUANTITY USED TO MEASURE AND EXPRESS THE RESULT OF
A DECISION PROBLEM LIKE “PROFIT “ , “ LOSS”
THE 4 ELEMENTS ARE REPRESENTED IN A TABLE CALLED PAY OFF TABLE ( PROFIT) OR
OPPORTUNITY LOSS ( OR REGRET ) TABLE
FOUR ELEMENTS OF DECISION THEORY
DECISION MAKING IS OF TWO TYPES
1. DECISION UNDER UNCERTAINTY- HERE PROBABILITY IS NOT USED
2. DECISION UNDER RISK –HERE PROBABILITY IS USED
METHODS OF DECISION
NON PROBABLITY METHOD
DETERMINE THE DIFFERENT ALTERNATIVES
DETERMINE THE DIFFERENT STATES OF NATURE ( SCENARIOS) FOR EACH ALTERNATIVE
ARRANGE ALTERNATIVES & SCENARIOS IN A TABLE – CALLED PAY OFF MATRIX / REGRET
MATRIX
ALTERNATIVES ARE USUALLY IN COLUMNS AS A,B,C,D..
STATES OF NATURE ARE USUALLY IN ROWS AS P,Q,R
CELLS OF TABLE CONTAIN THE PROFIT (IN PAY OFF ) OR OPPURTUNITY LOSS ( IN REGRET )
TABLE
DECISION UNDER UNCERTAINTY
THREE TYPES ARE MOSTLY USED FOR ANALYZING THE PAY OFF TABLE TO CHOOSE STRATEGY..
1. MAXIMAX – MAXIMIZE THE MAXIMUM POSSIBLE OUTCOME . ATTITUDE IS TO TAKE RISK –
OPTIMISTIC APPROACH .PICK THE HIGHEST OUTCOME (RESULTS) OF EACH ALTERNATIVE
AND THEN PICK THE BEST OUT OF THE BEST OUTCOMES ACROSS ALTERNATIVES
2. MAXIMIN – MAXIMISE THE MINIMUM POSSIBLE OUTCOME – AVOID RISK – PESSIMISTIC
APPROACH. PICK THE LOWEST OUTCOME OF EACH ALTERNATIVE AND THEN PICK THE
HIGHEST AMONG THE CHOSEN ACROSS ALTERNATIVES MINMAX REGRET
IN BOTH THESE APPROACHES , ONLY COLUMNS ( ACTS ) ARE COMPARED TO GET THE
MAXIMUM OR MINIMUM OUTCOMES
TRICK OF ANALYSIS : BREAK THE WORD IN 2 PARTS AND GO FROM BACKWARD TO FORWARD
ANALYSIS OF TABLE .EXAMPLE MAXIMAX IS MAXI (FORWARD ) AND MAX (BACKWARD) MAXI
I MAX
FIRST FIND THE MAXIMUM VALUE OF EACH COLUMN AND THEN FIND THE MAXIMUM OF
THOSE VALUES.
SIMILARLY MAXIMIN IS MAXI I MIN . FIRST FIND “ MIN ‘’ OF EACH COLUMN AND THEN FIND
“MAX” OR MAXIMUM OF THOSE VALUES
STATES OF NATURE ( ROWS ) ARE NOT CONSIDERED FOR MAXIMAX AND MAXIMIN ANALYSIS
DECISION UNDER UNCERTAINTY
3. MINIMAX REGRET CRITERIA – A REALISTIC APPROACH , TAKING CALCULATED RISK ,
WEIGHING BOTH PROFIT AND LOSS .
- IN THIS ANALYSIS, FIRST ROWS ( STATES OF NATURE) ARE COMPARED .THE HIGHEST
VALUE (OUTCOME) IS CHOSEN IN THE ROW AND EACH VALUE IN THE ROW IS
SUBTRACTED FROM THE HIGHEST VALUE .THE RESULT IS REGRET OR OPPORTUNITY LOSS
VALUE .THIS EXERCISE IS DONE FOR EACH ROW
- THEN THE SAME PROCESS AS MAXIMAX /MINIMAX IS APPLIED . IN MINIMAX USING
BACKWARD/FORWARD RULE , FIRST THE MAXIMUM VALUE OF EACH COLUMN ( EACH
STRATEGY INDIVIDUALLY ACROSS STATES OF NATURE) IS FOUND , AND THEN GOING
FORWARD , THE MINIMUM VALUE IS CHOSEN AS THE STRATEGY
DECISION UNDER UNCERTAINITY
NOW LETS SEE THE WORKING OF CHOOSING STRATEGY USING MAXIMAX /MAXIMIN
AND MINIMAX REGRET USING PROFIT PAY OFF AND OPPORTUNITY LOSS TABLES IN THE
NEXT SLIDES
ALTERNATIVES ARE REPRESENTED AS A,B,C AND D WHILE STATES OF NATURE ARE
REPRESENTED AS P,Q,R AND S
WE HAVE TO FIND THE ALTERNATIVE (A,B,C OR D) UNDER MAXIMAX , MAXIMIN AND
MINIMAX REGRET CRITERIA
THE NEXT 3 SLIDES SHOW THE WORKING OF THE EXAMPLE
EXAMPLE OF DECISION UNDER
UNCERTAINITY
MAXIMAX
States of
Nature
A B C D
P 8 13 21 18
Q 7 12 6 11
R 14 13 12 16
S 27 22 18 8
1) Maximax- Optimistic
Rule a) Maxi Max
Front Back
Rule b) Top down column wise (Alternatives)
Pay off Matrix (Profit) Act
Acts Pay off
A 27
B 22
C 21
D 18
Answer -A
MAXIMIN
Acts Pay off
A 7
B 12
C 6
D 8
Maxi Min
P B
Answer-B
3) Mini Max Regret -----
 Here we consider both row wise (State of Nature) & also column wise (Alternatives)
 Start with Row wise
 Regret –loss/Give up
 Convert Profit Matrix to Opportunity Loss Table by following steps
 Pick the Max value Row wise
 Subtract that value from each column row
(that value is regret value)
 Best option is 0 regret which is Max value in row
MINMAX REGRET
States of
nature
A B C D
P 21-8=13 21-13=8 21-21=0 21-18=3
Q 12-7=5 12-12=0 12-6=6 12-11=1
R 16-14=2 16-13=3 16-12=4 16-16=0
S 27-27=0 27-22=5 27-18=9 27-8=19
Acts
Regret Table (Opp Loss)
A B C D
P 13 8 0 3
Q 5 0 6 1
R 2 3 4 0
S 0 5 9 19
Acts Pay off
A 13
B 8
C 9
D 19
Steps->Choose MaxMin
Answer-B
DECISION MAKING UNDER RISK WILL ASSIGN PROBABLITY VALUE TO EACH OF THE
STATES OF NATURE FOR VARIOUS ALTERNATIVES
PROBABLITY IS POSSIBILITY OF THE CHANCE EVENT (RISK OF NATURE ) HAPPENING
EMV – EXPECTED MONETARY VALUE IS CALCULATED MY MULTIPLYING THE PROBABLITY
WITH RESPECTIVE ALTERNATIVE OUTCOME AND ADDING ALL THE OUTCOMES IN ONE
COLUMN ( FOR EACH ALTERNATIVE)
SAME STEP IS TAKEN FOR ALL THE COLUMNS (ACTS)
HIGHEST VALUE IS CHOSEN UNDER PROFIT PAY OFF TABLE
SIMILARLY EOL (EXPECTED OPPORTUNITY LOSS ) IS CALCULATED BY CREATING A
OPPORTUNITY LOSS TABLE FROM PROFIT MATRIX AND FOLLOWING THE ABOVE STEPS
APPLYING PROBABLITY
LOWEST VALUE OF EOL IS CHOSEN AS THE ALTERNATIVE
DECISION MAKING UNDER RISK
THE FOLLOWING SLIDE SHOWS THE WORKING OF THE EXAMPLE ON HOW TO
CALCULATE THE EMV AND EOL
PROBABLITY P IS ASSIGNED TO EACH OF THE STATES OF NATURE
EXAMPLE OF DECISION MAKING
UNDER RISK
Example
1. Convert Profit Matrix to Opp Loss matrix
2. Calculate EMV & EOL of each alternative
Pay offs of three Acts/Strategies-ABC
States of Nature are P,Q & R
Probability is given for each State of Nature
Solution:
Acts----
States
of
Natur
e
Pro
b
A B C
P 0.5 -50 100 -80
Q 0.3 150 -
220
190
R 0.2 600 200 350
Q) Which Act can be chosen as the best
EMV for A = (-50X0.5)+ (150X0.3)+(600X0.2)=140
EMV for B= (100X0.5)+(-220X0.3)+(200X0.2)=24
EMV FOR C=(-80X0.5)+(190X0.3)+(350X0.2)=87
Answer is A Alternative or Act as it has highest EMV
EOL : Create a Regret or Opportunity Loss Table and
using similar steps as above choose lowest EOL as
Alternative /Strategy
Example
1. Convert Previous Profit Matrix to Opp Loss matrix
2. Calculate EOL of each alternative
Pay offs of three Acts/Strategies-ABC
States of Nature are P,Q & R
Probability is given for each State of Nature
Solution: Acts----
States
of
Natur
e
Pro
b
A B C
P 0.5 150 0 180
Q 0.3 40 410 0
R 0.2 0 400 250
Q) Which Act can be chosen as the best act?
Answer ) EOL A = 87 , EOL B=203 , EOL C=140
Choose A (Lowest EOL)
Example
1. Convert Profit Matrix to Opp Loss matrix
2. Calculate EOL of each alternative
Pay offs of three Acts/Strategies-ABC
States of Nature are P,Q & R
Probability is given for each State of Nature
Solution: Acts----
States of
Nature
Prob A B C
P 0.5 -50 100 -80
Q 0.3 150 -220 190
R 0.2 600 200 350
Q) Which Act can be chosen as the best act?
CHAPTER 4 : KNOWLEDGE
MANAGEMENT SYSTEMS
Topics:
• Understand concept of Knowledge
• Hierarchy of Knowledge
• Types of Knowledge – Explicit & Tacit
• Knowledge Types conversions
• Value of Knowledge
• Organizational Knowledge – Single & Double loop
• Use of Information Technology in Knowledge
• Introduction to AI – Expert Systems
• Expert Systems – Forward and Backward Chaining
Knowledge Management Systems
What is Knowledge
• Knowledge is
- Knowhow
- Applied Information
- Information with Judgment
- Capacity for effective action
Value of Knowledge
• In knowledge economy , Knowledge has “money “ value – Valuations of Startups in
determined by their Innovation (Knowledge).This knowledge has to be
continuously stored in Knowledge Management System
• Newspapers /Websites provide information and not knowledge .They in turn earn
money from “ Ads” which is giving someone else’s information
• Knowledge creates wealth in today's economy and is the greatest asset of any
organization
• Lets understand the Hierarchy of Knowledge with reference to manufacturing of
some product using a machine in factory
• Here each level of personnel has a different knowledge know how with context to
his role
Hierarchy of Knowledge
Example: Understand Hierarchy of knowledge in a factory where machine is used to
produce a good say bottle in a factory
Common
Knowledge
Knowledge to
take decision
Domain Expert
Knowledge
Deeper
Knowledge
CASE
WHY
HOW
WHY
WHAT
Understand the social context
Stakeholders- People, customers, factory, other
external factors in addition to machine
Understand the working of machine
in details to produce the bottle
Understand what good the
machine is producing-Bottle
How to operate a machine
Types of Knowledge
Knowledge basically is of two types
1 . Explicit Knowledge – Can be expressed in words and figures , essentially this
knowledge can be documented
2.Tacit – This knowledge cannot be documented
For organization to grow by continuous innovation, Tacit knowledge has to be
continuously converted to Explicit knowledge
Knowledge Types Conversions
• Tacit to Explicit – for continuous innovation , Ex Expert Systems
• Explicit to Tacit – Ex PhD Research –Start with Literature review , find gaps and to
tacit research for further innovation
• Explicit – Explicit – Organizations copy best knowledge practices from each other ,
ex use of same type of Payroll System
• Tacit –Tacit –Two subject matter experts talk to each other to increase the Tacit
knowledge of each other .
Organizational Knowledge
• Organizational Learning Strategy is different for different organizations .It creates
new standards for operating processes
• There are two types of Organizational learning
1. Single Loop – Get into deeper understanding of “Cause” in the “Cause and Effect “
theory.Ex Earthquakes kill people .Here you will get into understanding of Cause of
Earthquake and find solution
2.Double loop –You challenge the “ Cause “ . Ex Earthquakes don’t kill people , Falling
buildings do . Earthquakes don’t kill people in Japan and US , but they still do in
Indonesia and other countries
Information Technology in Knowledge
Management
Technology is used in Knowledge Management in 4 ways
1. Create Knowledge – Use simulation and design tools like CAD/CAM software ,
Virtual Reality
2.Capture & Codify (Automate ) knowledge by using Artificial Intelligence (AI) like
Expert Systems
3. Share Knowledge – Use of GDSS ( Groupware Software ) to share and increase
knowledge
4.Distribute Knowledge – Using Office Automation Systems , Intranets etc
Points 3 & 4 are part of all Information Systems
Point 1 & 2 are specific to Knowledge Management Information System
Components of Knowledge Management System
Web User
Enterprise Knowledge Person
ERP CRM SCM
Web
Internet
Intranet
Extranet
email
Enterprise
Knowledge
Base
Structured Data Source Unstructured Data Source Enterprise Knowledge
CHAPTER 5: EXPERT SYSTEMS
Expert System
• The process of transfer of human expert knowledge to a computer and thereafter
taking inputs of the expert advice from the computer is called Expert System
• The components of Expert System as described in next slides are
- Knowledge Base
- Inference Engine
- User Interface
Expert System - Conversion of Expert
Knowledge for Automatic Distribution
of Advice to users
Expert System Components
Organizations using Expert System
• Medical Diagnosis – ex WebMD , www.easydiagnosis.com
• Games –Chess /Cards – www.chess.com
• Coding
• Filing Income Tax Returns
Components of Expert Systems
• Inference Engine – Use of “Rules “ , “ What if Analysis “ – This is “brain” of Expert
System. Apart from Rules , its other function is to “Search “ the Knowledge Base.
• Knowledge Base – Domain Experts (ex Doctor) provides knowledge to Knowledge
(Data) Engineer who codifies the knowledge in Knowledge Base
• UI – Uses web , Text to Speech and Speech to Text to get the expert advice to non
expert user
Forward and Backward Chaining in
Inference Engine
• Inference Engine uses Forward and Backward Chaining techniques for framing
Rules and Search from Knowledge Base
• Forward Engine – Starts with known facts and asserts new facts
• Backward Chaining – Starts with goals and works backwards to determine what
facts must be asserted so that goals can be achieved . It essentially does
hypothesis testing
Forward and Backward Chaining
Example
• A is initial condition – No one is in Management Institute today
• A->B ( A implies B ) – Rule – If no one is in Institute today , it must be holiday
• B (Result ) – It is holiday today
Forward Chaining – Given A and A->B , find B
Backward Chaining – Given B and A->B , find A

MIS.pptx

  • 1.
  • 2.
    INTRODUCTION TO INFORMATIONSYSTEMS IS WRITTEN PREDOMINANTLY KEEPING IN MIND THE FIRST FORAY INTO THE WORLD OF IT (INFORMATION TECHNOLOGY) FOR NON TECHNOLOGY BACKGROUND STUDENTS PURSUING MBA /PGDM COURSES THE STYLE IS DELIBERATELY KEPT SIMPLE PRESENTATION TYPES WITH BULLET POINTS APPROACH TO ENSURE THAT KEY CONCEPTS CAN BE QUICKLY ASSIMILATED THE EFFORT IS TO ENCOURAGE STUDENTS WITH NON TECHNOLOGY BACKGROUND TO TAKE UP IT & BUSINESS ANALYTICS COURSES AS NEXT STEP THE E BOOK HAS 5 CHAPTERS STARTING FROM RAW DATA AND ENDING WITH INTRODUCTION TO EXPERT SYSTEMS (ARTIFICIAL INTELLIGENCE ) CONCEPTS ARE EXPLAINED WITH DIAGRAMS AND NUMERICAL EXAMPLES WHEREVER APPLICABLE COPYRIGHTS WITH DR SAUMENDRA MOHANTY PREFACE
  • 3.
    TABLE OF CONTENTS CHAPTER1 : DIKW MODEL MAPPED TO INFORMATION SYSTEMS CHAPTER 2 : TYPES OF INFORMATION SYSTEMS TPS, MIS ,DSS & EIS CHAPTER 3 : DECISION THEORY WITH EXAMPLES CHAPTER 4 : KNOWLEDGE MANAGEMENT SYSTEMS CHAPTER 5: EXPERT SYSTEMS
  • 4.
    CHAPTER 1 :DIKW MODEL MAPPED TO INFORMATION SYSTEMS
  • 5.
    DATA INFORMATION KNOWLEDGE WISDOM DIKW MODEL PYRAMID CORPORATEPYRAMID INFORMATION SYSTEMS PYRAMID DECISION MAKING TYPES PYRAMID KEY CONCEPTS
  • 6.
    230975 IS DATA 23/09/75IS DATA – IT COULD BE ANYONE’S DOB DOB 23/09/76 SURESH – DATA – COULD BE ANY SURESH IN THE WORLD DOB 23/09/76 SURESH S/O OF RAMESH – DATA –COULD BE ANY SURESH S/O OF RAMESH DOB 23/09/76 SURESH S/O RAMESH R/O OF ……. IS INFORMATION NOW AS THERE IS “CONTEXT “ TO DATA WHAT IS DATA
  • 7.
    DATA IS COLLECTIONOF RAW FACTS AND FIGURES DATA CAN BE REPRESENTED BY ALPHABETS, NUMBERS , SPECIAL CHARACTERS, IMAGES AND VIDEOS A-Z , A-Z , 0-9 , @#$%&*<>>,.”;’ TAKEN IN ISOLATION “DATA “ CONVEYS NO MEANING OR CONTEXT WHAT IS DATA
  • 8.
    “PROCESSED” DATA IS“INFORMATION” THERE CAN BE MULTIPLE PROCESSES ON DATA TO GET THE INFORMATION DATA + CONTEXT = INFORMATION INFORMATION
  • 9.
    120/80 ,130/90, 140/100, 150 /110 IS DATA BP I 120/80 ,130/90, 140/100 , 150 /110 IS STILL DATA BP I DATE I TIME I NAME I 120/80 ,130/90, 140/100 , 150 /110 IS “INFORMATION” ABOUT BLOOD PRESSURE AS CONTEXT BP I DATE I TIME I NAME I 120/80 ,130/90, 140/100 , 150 /110 I LOW ,AVERAGE ,HIGH – IS KNOWLEDGE INFORMATION + RULES = KNOWLEDGE INFORMATION & KNOWLEDGE
  • 10.
    IN THE PREVIOUSEXAMPLES OF BP READINGS , HERE IS DECISION OF 3 DOCTORS DECISION OF 1ST DOCTOR ON BP READING –TAKE REST DECISION OF 2ND DOCTOR ON BP READING –TAKE MEDICINES DECISION OF 3RD DOCTOR ON BP READING – GET HOSPITALIZED KNOWLEDGE + EXPERIENCE = WISDOM KNOWLEDGE & WISDOM
  • 11.
    DATA IS CONSIDEREDTHE NEW “OIL” BUT IS “USELESS” OR IS LIKE “CRUDE OIL” (WHAT IS THIS LIQUID ?) INSIGHTS AND INFORMATION PROCESSED FROM DATA IS “REFINED OIL” (WHATS TO BE DONE TO CONVERT TO DIESEL/PETROL ) WHERE TO USE THE OIL IS KNOWLEDGE (APPLICATION OF OIL- AUTOMOBILES, AVIATION, INDUSTRY) WHETHER TO USE THE OIL , CONSERVE OR SELL IS WISDOM ( PREDICTION /FUTURE FORECAST-OPEC MODEL ) DIKW MODEL
  • 12.
  • 13.
  • 14.
  • 15.
    Definitrmri on Vision Knowledge Info Data EIS DSS MIS TPS CEO Sr Mgmt Middle Mgmt Executive InformationSystem (IS) mapped to DIKW Model IS = TPS+MIS+DSS+EIS DIKW IS Hierarchy Corp Pyramid
  • 16.
  • 17.
    CHAPTER 2 :TYPES OF INFORMATION SYSTEMS - TPS, MIS DSS & EIS
  • 18.
    DEFINITION OF “SYSTEM”- A SYSTEM IS A SET OF RULES, AN ARRANGEMENT OF THINGS, OR A GROUP OF RELATED THINGS THAT WORK TOWARDS A COMMON GOAL SYSTEM IS A GENERAL SET OF PARTS, STEPS, OR COMPONENTS THAT ARE CONNECTED TO FORM A MORE COMPLEX WHOLE. WHAT IS SYSTEM
  • 19.
    HARDWARE – PHYSICALDEVICES –COMPUTERS , TABLETS , MOBILE PHONES SOFTWARE – TELLS THE HARDWARE WHAT TO DO DATA –INFORMATION MANIPULATED BY SOFTWARE PEOPLE –USERS , PROGRAMMERS ,ANALYSTS , IT DEP'T PROCESS- STEPS TO ACCOMPLISH A GOAL TELECOMMUNICATIONS /NETWORKING FIVE COMPONENTS OF – INFORMATION SYSTEM (IS)
  • 20.
  • 21.
    Information Systems layout User Interface Appls/w (Logic) Database Hardware Telecom/ Internet (Network) IS = TPS+MIS+DSS+EIS Users- Executive , Middle Mgmt , Sr Mgmt & CEO
  • 22.
  • 23.
    Difference between ITand IS • Information Technology (IT) deals with Technology • - Hardware • -Software • - Networking while • Information Systems (IS) deals with • -Technology • People • -Process • IS Relates to Business using Technology
  • 24.
    IT and IS InformationSystem vs Information Technology Information Technology  Hardware  Software  Database  Network Information System Are used to build Marketing System Customer Service Payroll System Inventory System
  • 25.
    Types of InformationSystems • Information Systems can be broadly divided into following four categories: • TPS – Transaction Processing System • MIS – Management Information System • DSS – Decision Support System • EIS – Executive Information System
  • 26.
    Types of BusinessInformation Systems • Operations Support – Provided by TPS • Management Support – Provided by MIS , DSS & EIS • Other Business Support Systems  GDSS ( Group Decision Support System )- Communications (Chat/Mail ) , Conferencing ( Audio/Video Conferencing ) and Collaboration ( Workflow)  Knowledge Management  Expert Systems
  • 27.
    Types of Decisions •Structured – Inventory Re order Decision • Semi Structured – Which product lines to add in next 1 year • Structured – Which business to be in next 5 years
  • 28.
    Transaction Processing System(TPS) • Captures daily transactions like POS (Point of Sale ) data in Store • Helps in Operational Level of Management ( lower Management) • Online (POS) or Batch Processing • Pre defined transactions • No decision making • Structured problems • Follows ACID Mode
  • 29.
    ACID Principle ofTPS • All TPS model follow ACID Principle • A – Atomicity – Transaction is Full or None • C – Consistency – All transactions within defined boundary ex ATM limit of 10K cash withdraw per transaction • I – Integrity – All Credits and Debits will be done simultaneously • D- Durability – Maintain Log Reports of who used the system , when
  • 30.
    TPS Classifier -ACIDTest for TPS • A – Atomicity- TPS is complete in full or not • C-Consistency- set of operating rules and constraints of Database Mgmt. • I – Isolation – Each TPS is different even if they are at same time • D –Durability – TPS once done cannot be undone
  • 31.
    Five Stages ofTPS Use Case : Point of Sale Data Entry • Barcode • Manual Transaction Process  Batch  Online/Real time Document & Report generation Database 3 2 3 5 Inquiry Processing Online Queries (Pre defines) Routine Query
  • 32.
    Payroll System asTPS MIS Reports Payroll System D/B Employee Data Name Address Salary DOJ Tax Online Queries (Pre defined) Employee Pay check Pre defined Output Example :Employees earning > Rs 2,00,000/Month – will come from MIS not TPS
  • 33.
    Management Information System (MIS) •Captures data from TPS • Summarizes TPS Data • Provides “Organization Performance Reports” • Mostly Structured –Pre Defined decision making • Little Analytics • Example : Grade Sheet of Class Term Result is MIS (Performance of Class)
  • 34.
    4 Types ofMIS Reports 1. Periodic and Scheduled Reports – provided on regular basis – daily /weekly/fortnightly/monthly ex Sales Reports ,Production & Inventory Reports 2. Exceptional Reports – Only in exceptional conditions , may be periodic and non periodic. Periodic to decrease info overload , non periodic ex exceeding Credit limit 3.Demand and Response –Available on demand – Customized Reports , Web Based , RDBMS query 4.Push Reports – Automatically pushed on desktops ex Newsfeeds of competition, stock prices
  • 35.
    TYPICAL MIS REPORTS 2015Ticket Sales Movie Genre January February March April May June July August Septembe r October November December TOTAL Comedy 49,832 47,232 40,002 37,283 32,910 33,829 30,102 32,111 34,921 30,293 28,392 24,192 421,099 Thriller 12,839 16,828 15,839 18,082 24,932 30,462 34,240 42,718 41,128 39,382 36,621 37,283 350,354 Documentary 9,118 9,907 7,257 7,838 6,372 5,992 5,773 5,993 6,302 8,103 9,100 9,278 91,033 Romance 14,381 14,651 11,969 14,602 13,046 14,411 13,871 14,184 13,033 14,625 12,196 13,081 164,050 TOTAL 86,170 88,618 75,067 77,805 77,260 84,694 83,986 95,006 95,384 92,403 86,309 83,834
  • 36.
    TYPICAL MIS VISUALIZATION 0 10,000 20,000 30,000 40,000 50,000 60,000 12 3 4 5 6 7 8 9 10 11 12 Column Chart Comedy Thriller Documentary Romance
  • 37.
    Decision Support System(DSS) • Non Routine Decisions • Semi Structured Decisions – 50/50 • 2 Categories -Model Based - Data Based • Used infrequently only when problems /opportunity analysis
  • 38.
    DSS • Model Based– Use of Statistical Models – result is know , arrive at correlation between 2 variables – ex behavioural analysis – Cross and Up Sell in E Commerce • Data Based – Use Data from TPS /MIS to slice /dice/ consolidate /replicate and arrive at new knowledge which was not known ex Yield Management System ( Dynamic ticket pricing of Airlines ) based on optimization model
  • 39.
    Components of DSS S/WWeb Browser Other S/W User Interface (UI) Model Management Function • Analytical Model • Statistical Model Data Management Function Data Extraction, Validation, Consolidation & Replication Operational Data Market Data Sales Data Customer Data Data Marts & Other Databases
  • 40.
    Executive Information System(EIS) • Decisions taken at Top level • Totally unstructured decisions based on data , insights, intuition and experience • Data is 2 types - Internal Data – From DSS - External Data – Sensex , Standard and Poor type reports , Govt Policies , Industry Reports • Dashboard is Graphical /Charts
  • 42.
    CHAPTER 3 :DECISION THEORY WITH EXAMPLES
  • 43.
    DECISION THEORY ISA STATISTICAL TOOL OR TECHNIQUE WHICH IS USED TO SELECT THE BEST WAY OF DOING WORK, HELPS IN DECISION BY SELECTING THE BEST OUTCOME OUT OF MANY ALTERNATIVES USING DATA DECISION THEORY
  • 44.
    1. ACTIONS /ACTS /ALTERNATIVES /STRATEGIES – CHOOSE 1 OUT OF 2 OR MORE ALTERNATIVES .USUALLY REPRESENTED AT ACTS AND REPRESENTED BY ALPHABETS A,B ,C ,D …..IN A TABLE ACTS ARE USUALLY REPRESENTED IN “COLUMNS” 2.STATES OF NATURE – MUTUALLY EXCLUSIVE AND EXHAUSTIVE CHANCE EVENTS. AT A TIME ONLY 1 CHANCE EVENT WILL HAPPEN OUT OF FINITE NUMBER OF EXHAUSTIVE EVENTS. IN A TABLE , STATES OF NATURE USUALLY ARE REPRESENTED AS “ ROWS” ACTS OR ALTERNATIVES ARE UNDER OUR CONTROL WHILE STATES OF NATURE ARE NOT UNDER OUR CONTROL EXAMPLE – “ STOCK” IS ALTERNATIVE WHILE “DEMAND” IS STATE OF NATURE 3. OUTCOME /RESULTS – THE SET OF CONSEQUENCES RESULTING FROM ALL ACTS & STATES OF NATURE 4. OBJECTIVE VARIABLES – QUANTITY USED TO MEASURE AND EXPRESS THE RESULT OF A DECISION PROBLEM LIKE “PROFIT “ , “ LOSS” THE 4 ELEMENTS ARE REPRESENTED IN A TABLE CALLED PAY OFF TABLE ( PROFIT) OR OPPORTUNITY LOSS ( OR REGRET ) TABLE FOUR ELEMENTS OF DECISION THEORY
  • 45.
    DECISION MAKING ISOF TWO TYPES 1. DECISION UNDER UNCERTAINTY- HERE PROBABILITY IS NOT USED 2. DECISION UNDER RISK –HERE PROBABILITY IS USED METHODS OF DECISION
  • 46.
    NON PROBABLITY METHOD DETERMINETHE DIFFERENT ALTERNATIVES DETERMINE THE DIFFERENT STATES OF NATURE ( SCENARIOS) FOR EACH ALTERNATIVE ARRANGE ALTERNATIVES & SCENARIOS IN A TABLE – CALLED PAY OFF MATRIX / REGRET MATRIX ALTERNATIVES ARE USUALLY IN COLUMNS AS A,B,C,D.. STATES OF NATURE ARE USUALLY IN ROWS AS P,Q,R CELLS OF TABLE CONTAIN THE PROFIT (IN PAY OFF ) OR OPPURTUNITY LOSS ( IN REGRET ) TABLE DECISION UNDER UNCERTAINTY
  • 47.
    THREE TYPES AREMOSTLY USED FOR ANALYZING THE PAY OFF TABLE TO CHOOSE STRATEGY.. 1. MAXIMAX – MAXIMIZE THE MAXIMUM POSSIBLE OUTCOME . ATTITUDE IS TO TAKE RISK – OPTIMISTIC APPROACH .PICK THE HIGHEST OUTCOME (RESULTS) OF EACH ALTERNATIVE AND THEN PICK THE BEST OUT OF THE BEST OUTCOMES ACROSS ALTERNATIVES 2. MAXIMIN – MAXIMISE THE MINIMUM POSSIBLE OUTCOME – AVOID RISK – PESSIMISTIC APPROACH. PICK THE LOWEST OUTCOME OF EACH ALTERNATIVE AND THEN PICK THE HIGHEST AMONG THE CHOSEN ACROSS ALTERNATIVES MINMAX REGRET IN BOTH THESE APPROACHES , ONLY COLUMNS ( ACTS ) ARE COMPARED TO GET THE MAXIMUM OR MINIMUM OUTCOMES TRICK OF ANALYSIS : BREAK THE WORD IN 2 PARTS AND GO FROM BACKWARD TO FORWARD ANALYSIS OF TABLE .EXAMPLE MAXIMAX IS MAXI (FORWARD ) AND MAX (BACKWARD) MAXI I MAX FIRST FIND THE MAXIMUM VALUE OF EACH COLUMN AND THEN FIND THE MAXIMUM OF THOSE VALUES. SIMILARLY MAXIMIN IS MAXI I MIN . FIRST FIND “ MIN ‘’ OF EACH COLUMN AND THEN FIND “MAX” OR MAXIMUM OF THOSE VALUES STATES OF NATURE ( ROWS ) ARE NOT CONSIDERED FOR MAXIMAX AND MAXIMIN ANALYSIS DECISION UNDER UNCERTAINTY
  • 48.
    3. MINIMAX REGRETCRITERIA – A REALISTIC APPROACH , TAKING CALCULATED RISK , WEIGHING BOTH PROFIT AND LOSS . - IN THIS ANALYSIS, FIRST ROWS ( STATES OF NATURE) ARE COMPARED .THE HIGHEST VALUE (OUTCOME) IS CHOSEN IN THE ROW AND EACH VALUE IN THE ROW IS SUBTRACTED FROM THE HIGHEST VALUE .THE RESULT IS REGRET OR OPPORTUNITY LOSS VALUE .THIS EXERCISE IS DONE FOR EACH ROW - THEN THE SAME PROCESS AS MAXIMAX /MINIMAX IS APPLIED . IN MINIMAX USING BACKWARD/FORWARD RULE , FIRST THE MAXIMUM VALUE OF EACH COLUMN ( EACH STRATEGY INDIVIDUALLY ACROSS STATES OF NATURE) IS FOUND , AND THEN GOING FORWARD , THE MINIMUM VALUE IS CHOSEN AS THE STRATEGY DECISION UNDER UNCERTAINITY
  • 49.
    NOW LETS SEETHE WORKING OF CHOOSING STRATEGY USING MAXIMAX /MAXIMIN AND MINIMAX REGRET USING PROFIT PAY OFF AND OPPORTUNITY LOSS TABLES IN THE NEXT SLIDES ALTERNATIVES ARE REPRESENTED AS A,B,C AND D WHILE STATES OF NATURE ARE REPRESENTED AS P,Q,R AND S WE HAVE TO FIND THE ALTERNATIVE (A,B,C OR D) UNDER MAXIMAX , MAXIMIN AND MINIMAX REGRET CRITERIA THE NEXT 3 SLIDES SHOW THE WORKING OF THE EXAMPLE EXAMPLE OF DECISION UNDER UNCERTAINITY
  • 50.
    MAXIMAX States of Nature A BC D P 8 13 21 18 Q 7 12 6 11 R 14 13 12 16 S 27 22 18 8 1) Maximax- Optimistic Rule a) Maxi Max Front Back Rule b) Top down column wise (Alternatives) Pay off Matrix (Profit) Act Acts Pay off A 27 B 22 C 21 D 18 Answer -A
  • 51.
    MAXIMIN Acts Pay off A7 B 12 C 6 D 8 Maxi Min P B Answer-B 3) Mini Max Regret -----  Here we consider both row wise (State of Nature) & also column wise (Alternatives)  Start with Row wise  Regret –loss/Give up  Convert Profit Matrix to Opportunity Loss Table by following steps  Pick the Max value Row wise  Subtract that value from each column row (that value is regret value)  Best option is 0 regret which is Max value in row
  • 52.
    MINMAX REGRET States of nature AB C D P 21-8=13 21-13=8 21-21=0 21-18=3 Q 12-7=5 12-12=0 12-6=6 12-11=1 R 16-14=2 16-13=3 16-12=4 16-16=0 S 27-27=0 27-22=5 27-18=9 27-8=19 Acts Regret Table (Opp Loss) A B C D P 13 8 0 3 Q 5 0 6 1 R 2 3 4 0 S 0 5 9 19 Acts Pay off A 13 B 8 C 9 D 19 Steps->Choose MaxMin Answer-B
  • 53.
    DECISION MAKING UNDERRISK WILL ASSIGN PROBABLITY VALUE TO EACH OF THE STATES OF NATURE FOR VARIOUS ALTERNATIVES PROBABLITY IS POSSIBILITY OF THE CHANCE EVENT (RISK OF NATURE ) HAPPENING EMV – EXPECTED MONETARY VALUE IS CALCULATED MY MULTIPLYING THE PROBABLITY WITH RESPECTIVE ALTERNATIVE OUTCOME AND ADDING ALL THE OUTCOMES IN ONE COLUMN ( FOR EACH ALTERNATIVE) SAME STEP IS TAKEN FOR ALL THE COLUMNS (ACTS) HIGHEST VALUE IS CHOSEN UNDER PROFIT PAY OFF TABLE SIMILARLY EOL (EXPECTED OPPORTUNITY LOSS ) IS CALCULATED BY CREATING A OPPORTUNITY LOSS TABLE FROM PROFIT MATRIX AND FOLLOWING THE ABOVE STEPS APPLYING PROBABLITY LOWEST VALUE OF EOL IS CHOSEN AS THE ALTERNATIVE DECISION MAKING UNDER RISK
  • 54.
    THE FOLLOWING SLIDESHOWS THE WORKING OF THE EXAMPLE ON HOW TO CALCULATE THE EMV AND EOL PROBABLITY P IS ASSIGNED TO EACH OF THE STATES OF NATURE EXAMPLE OF DECISION MAKING UNDER RISK
  • 55.
    Example 1. Convert ProfitMatrix to Opp Loss matrix 2. Calculate EMV & EOL of each alternative Pay offs of three Acts/Strategies-ABC States of Nature are P,Q & R Probability is given for each State of Nature Solution: Acts---- States of Natur e Pro b A B C P 0.5 -50 100 -80 Q 0.3 150 - 220 190 R 0.2 600 200 350 Q) Which Act can be chosen as the best
  • 56.
    EMV for A= (-50X0.5)+ (150X0.3)+(600X0.2)=140 EMV for B= (100X0.5)+(-220X0.3)+(200X0.2)=24 EMV FOR C=(-80X0.5)+(190X0.3)+(350X0.2)=87 Answer is A Alternative or Act as it has highest EMV EOL : Create a Regret or Opportunity Loss Table and using similar steps as above choose lowest EOL as Alternative /Strategy
  • 57.
    Example 1. Convert PreviousProfit Matrix to Opp Loss matrix 2. Calculate EOL of each alternative Pay offs of three Acts/Strategies-ABC States of Nature are P,Q & R Probability is given for each State of Nature Solution: Acts---- States of Natur e Pro b A B C P 0.5 150 0 180 Q 0.3 40 410 0 R 0.2 0 400 250 Q) Which Act can be chosen as the best act? Answer ) EOL A = 87 , EOL B=203 , EOL C=140 Choose A (Lowest EOL)
  • 58.
    Example 1. Convert ProfitMatrix to Opp Loss matrix 2. Calculate EOL of each alternative Pay offs of three Acts/Strategies-ABC States of Nature are P,Q & R Probability is given for each State of Nature Solution: Acts---- States of Nature Prob A B C P 0.5 -50 100 -80 Q 0.3 150 -220 190 R 0.2 600 200 350 Q) Which Act can be chosen as the best act?
  • 59.
    CHAPTER 4 :KNOWLEDGE MANAGEMENT SYSTEMS
  • 60.
    Topics: • Understand conceptof Knowledge • Hierarchy of Knowledge • Types of Knowledge – Explicit & Tacit • Knowledge Types conversions • Value of Knowledge • Organizational Knowledge – Single & Double loop • Use of Information Technology in Knowledge • Introduction to AI – Expert Systems • Expert Systems – Forward and Backward Chaining Knowledge Management Systems
  • 61.
    What is Knowledge •Knowledge is - Knowhow - Applied Information - Information with Judgment - Capacity for effective action
  • 62.
    Value of Knowledge •In knowledge economy , Knowledge has “money “ value – Valuations of Startups in determined by their Innovation (Knowledge).This knowledge has to be continuously stored in Knowledge Management System • Newspapers /Websites provide information and not knowledge .They in turn earn money from “ Ads” which is giving someone else’s information • Knowledge creates wealth in today's economy and is the greatest asset of any organization
  • 63.
    • Lets understandthe Hierarchy of Knowledge with reference to manufacturing of some product using a machine in factory • Here each level of personnel has a different knowledge know how with context to his role
  • 64.
    Hierarchy of Knowledge Example:Understand Hierarchy of knowledge in a factory where machine is used to produce a good say bottle in a factory Common Knowledge Knowledge to take decision Domain Expert Knowledge Deeper Knowledge CASE WHY HOW WHY WHAT Understand the social context Stakeholders- People, customers, factory, other external factors in addition to machine Understand the working of machine in details to produce the bottle Understand what good the machine is producing-Bottle How to operate a machine
  • 65.
    Types of Knowledge Knowledgebasically is of two types 1 . Explicit Knowledge – Can be expressed in words and figures , essentially this knowledge can be documented 2.Tacit – This knowledge cannot be documented For organization to grow by continuous innovation, Tacit knowledge has to be continuously converted to Explicit knowledge
  • 66.
    Knowledge Types Conversions •Tacit to Explicit – for continuous innovation , Ex Expert Systems • Explicit to Tacit – Ex PhD Research –Start with Literature review , find gaps and to tacit research for further innovation • Explicit – Explicit – Organizations copy best knowledge practices from each other , ex use of same type of Payroll System • Tacit –Tacit –Two subject matter experts talk to each other to increase the Tacit knowledge of each other .
  • 67.
    Organizational Knowledge • OrganizationalLearning Strategy is different for different organizations .It creates new standards for operating processes • There are two types of Organizational learning 1. Single Loop – Get into deeper understanding of “Cause” in the “Cause and Effect “ theory.Ex Earthquakes kill people .Here you will get into understanding of Cause of Earthquake and find solution 2.Double loop –You challenge the “ Cause “ . Ex Earthquakes don’t kill people , Falling buildings do . Earthquakes don’t kill people in Japan and US , but they still do in Indonesia and other countries
  • 68.
    Information Technology inKnowledge Management Technology is used in Knowledge Management in 4 ways 1. Create Knowledge – Use simulation and design tools like CAD/CAM software , Virtual Reality 2.Capture & Codify (Automate ) knowledge by using Artificial Intelligence (AI) like Expert Systems 3. Share Knowledge – Use of GDSS ( Groupware Software ) to share and increase knowledge 4.Distribute Knowledge – Using Office Automation Systems , Intranets etc Points 3 & 4 are part of all Information Systems Point 1 & 2 are specific to Knowledge Management Information System
  • 69.
    Components of KnowledgeManagement System Web User Enterprise Knowledge Person ERP CRM SCM Web Internet Intranet Extranet email Enterprise Knowledge Base Structured Data Source Unstructured Data Source Enterprise Knowledge
  • 70.
  • 71.
    Expert System • Theprocess of transfer of human expert knowledge to a computer and thereafter taking inputs of the expert advice from the computer is called Expert System • The components of Expert System as described in next slides are - Knowledge Base - Inference Engine - User Interface
  • 72.
    Expert System -Conversion of Expert Knowledge for Automatic Distribution of Advice to users
  • 73.
  • 74.
    Organizations using ExpertSystem • Medical Diagnosis – ex WebMD , www.easydiagnosis.com • Games –Chess /Cards – www.chess.com • Coding • Filing Income Tax Returns
  • 75.
    Components of ExpertSystems • Inference Engine – Use of “Rules “ , “ What if Analysis “ – This is “brain” of Expert System. Apart from Rules , its other function is to “Search “ the Knowledge Base. • Knowledge Base – Domain Experts (ex Doctor) provides knowledge to Knowledge (Data) Engineer who codifies the knowledge in Knowledge Base • UI – Uses web , Text to Speech and Speech to Text to get the expert advice to non expert user
  • 76.
    Forward and BackwardChaining in Inference Engine • Inference Engine uses Forward and Backward Chaining techniques for framing Rules and Search from Knowledge Base • Forward Engine – Starts with known facts and asserts new facts • Backward Chaining – Starts with goals and works backwards to determine what facts must be asserted so that goals can be achieved . It essentially does hypothesis testing
  • 77.
    Forward and BackwardChaining Example • A is initial condition – No one is in Management Institute today • A->B ( A implies B ) – Rule – If no one is in Institute today , it must be holiday • B (Result ) – It is holiday today Forward Chaining – Given A and A->B , find B Backward Chaining – Given B and A->B , find A