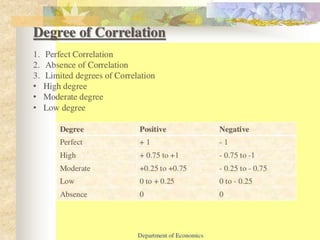
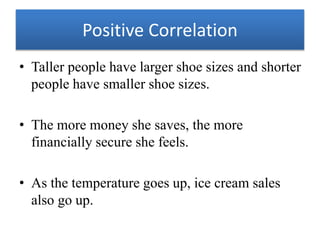
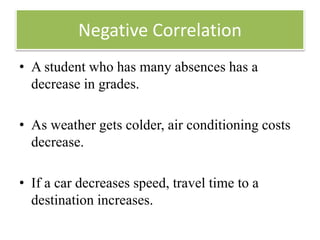
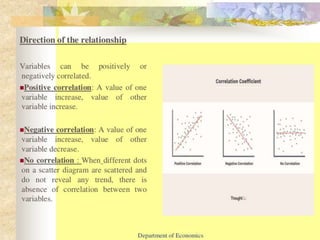
CORRELATION
Positive Correlation
• Taller people have larger shoe sizes and shorter
people have smaller shoe sizes.
• The more money she saves, the more
financially secure she feels.
• As the temperature goes up, ice cream sales
also go up.
Negative Correlation
• A student who has many absences has a
decrease in grades.
• As weather gets colder, air conditioning costs
decrease.
• If a car decreases speed, travel time to a
destination increases.
Example
• You are analyzing accident patterns on a highway.
You select the two variables, motor speed and the
number of accidents, and draw the diagram.
• Once the diagram is complete, you notice that as
the speed of vehicles increases, the number of
accidents goes up. This shows the relationship
between the two.
• Since this diagram shows you the correlation
between the variables, many experts call it a
correlation chart.
Correlation (theory)

Correlation (theory)

  • 1.
  • 6.
    Positive Correlation • Tallerpeople have larger shoe sizes and shorter people have smaller shoe sizes. • The more money she saves, the more financially secure she feels. • As the temperature goes up, ice cream sales also go up.
  • 7.
    Negative Correlation • Astudent who has many absences has a decrease in grades. • As weather gets colder, air conditioning costs decrease. • If a car decreases speed, travel time to a destination increases.
  • 13.
    Example • You areanalyzing accident patterns on a highway. You select the two variables, motor speed and the number of accidents, and draw the diagram. • Once the diagram is complete, you notice that as the speed of vehicles increases, the number of accidents goes up. This shows the relationship between the two. • Since this diagram shows you the correlation between the variables, many experts call it a correlation chart.