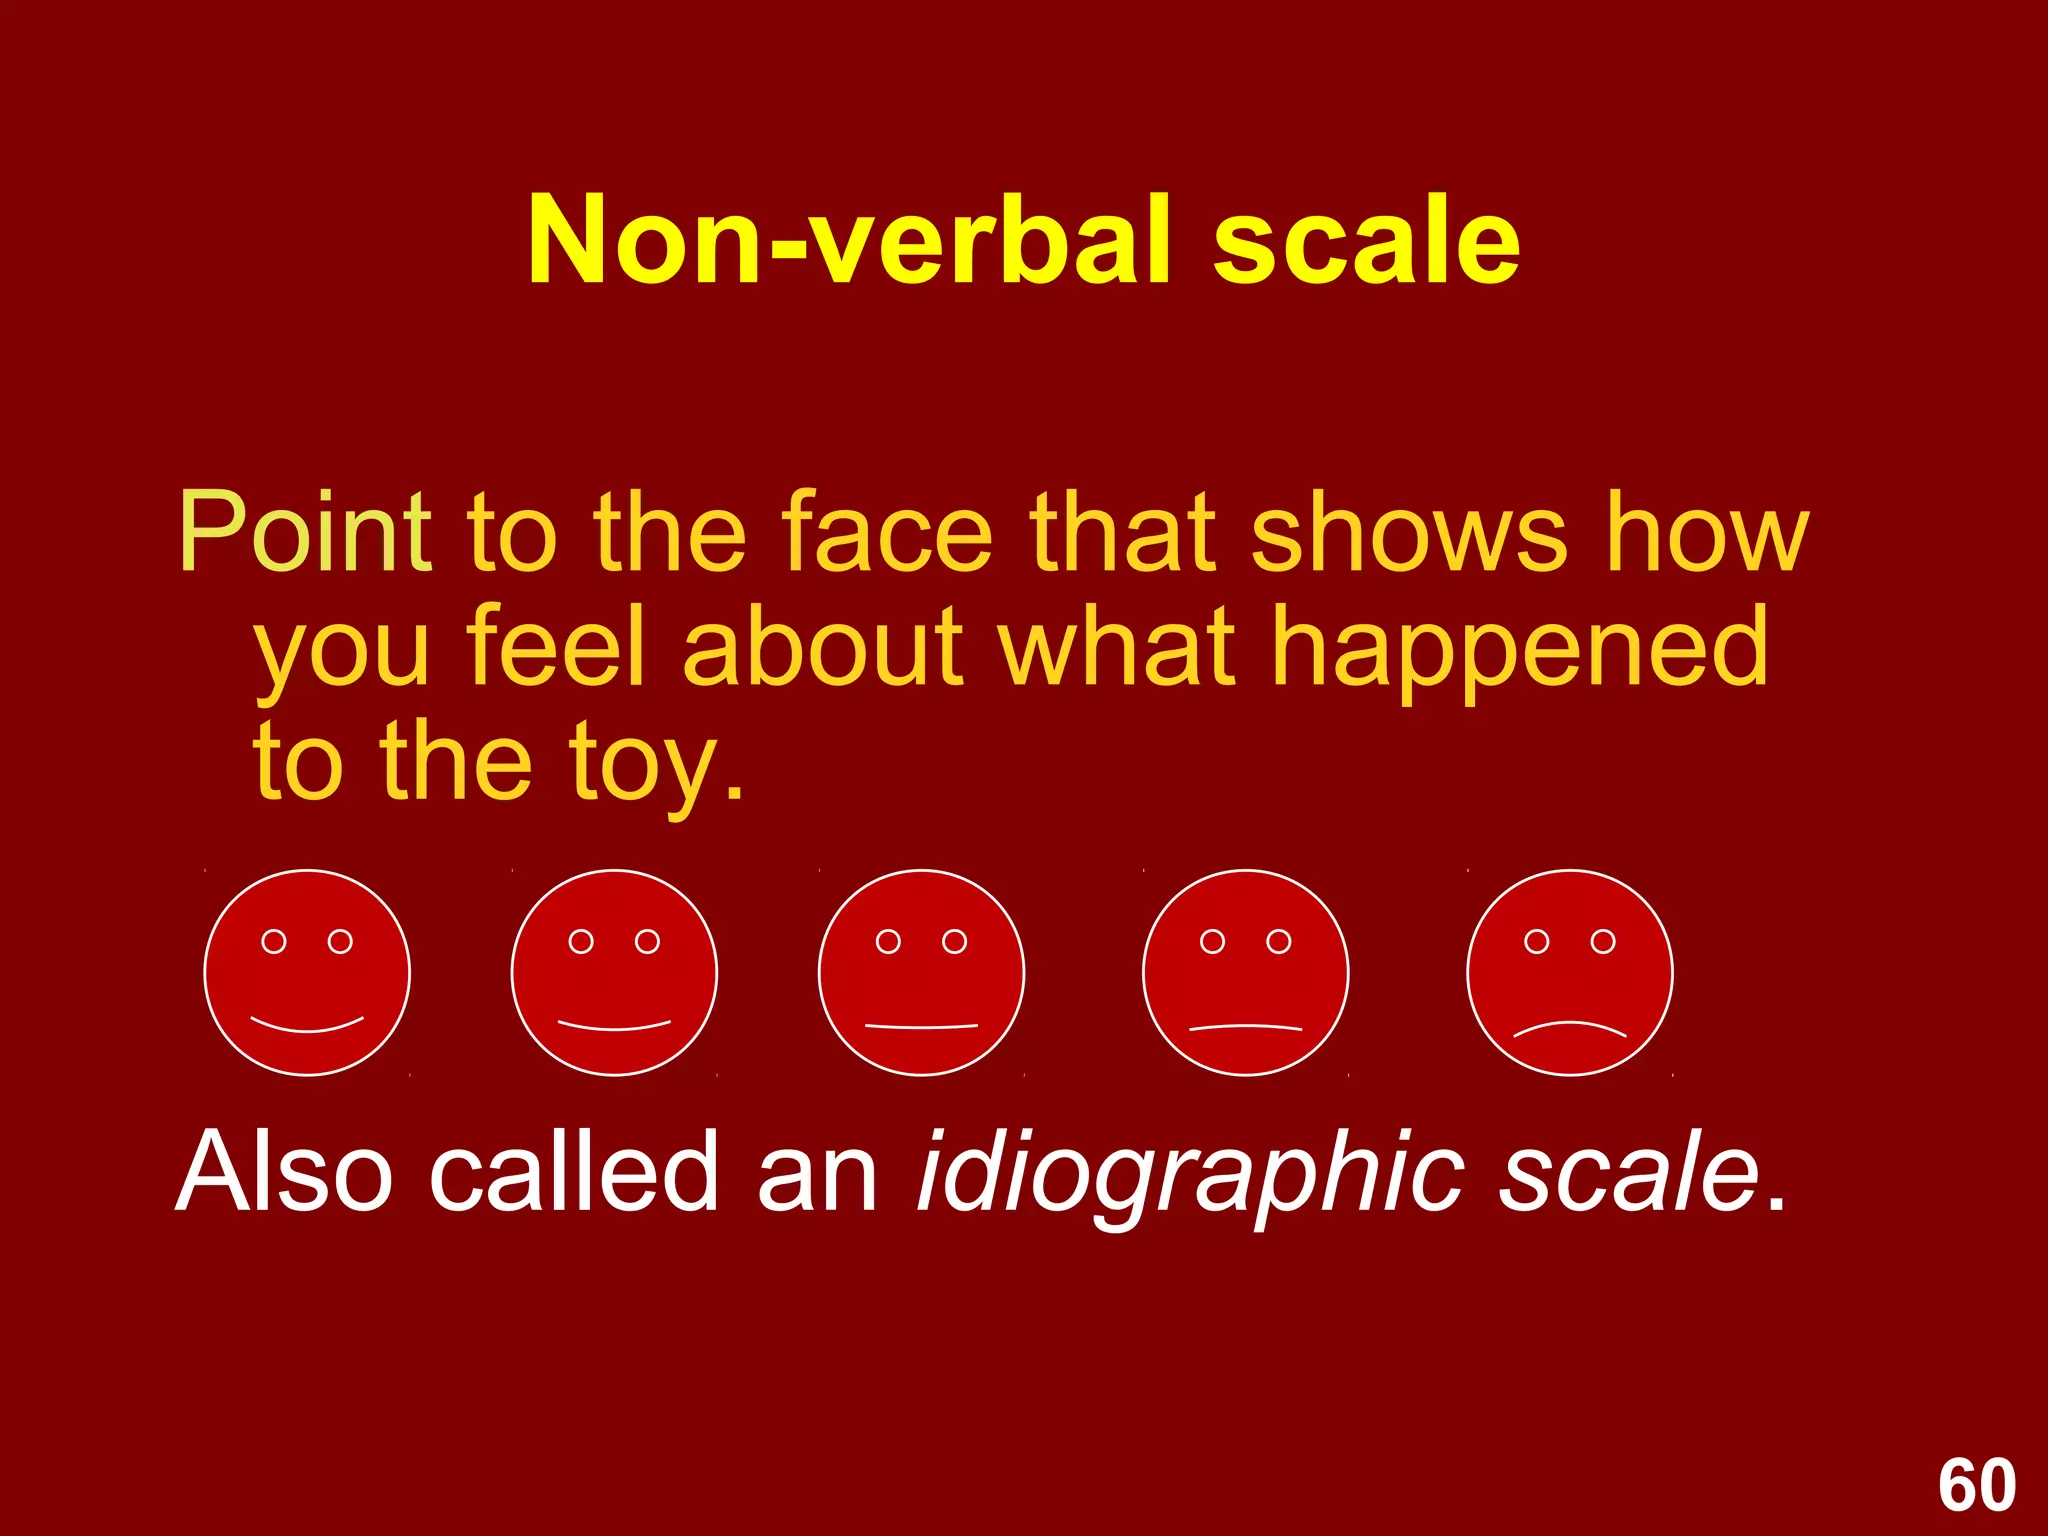
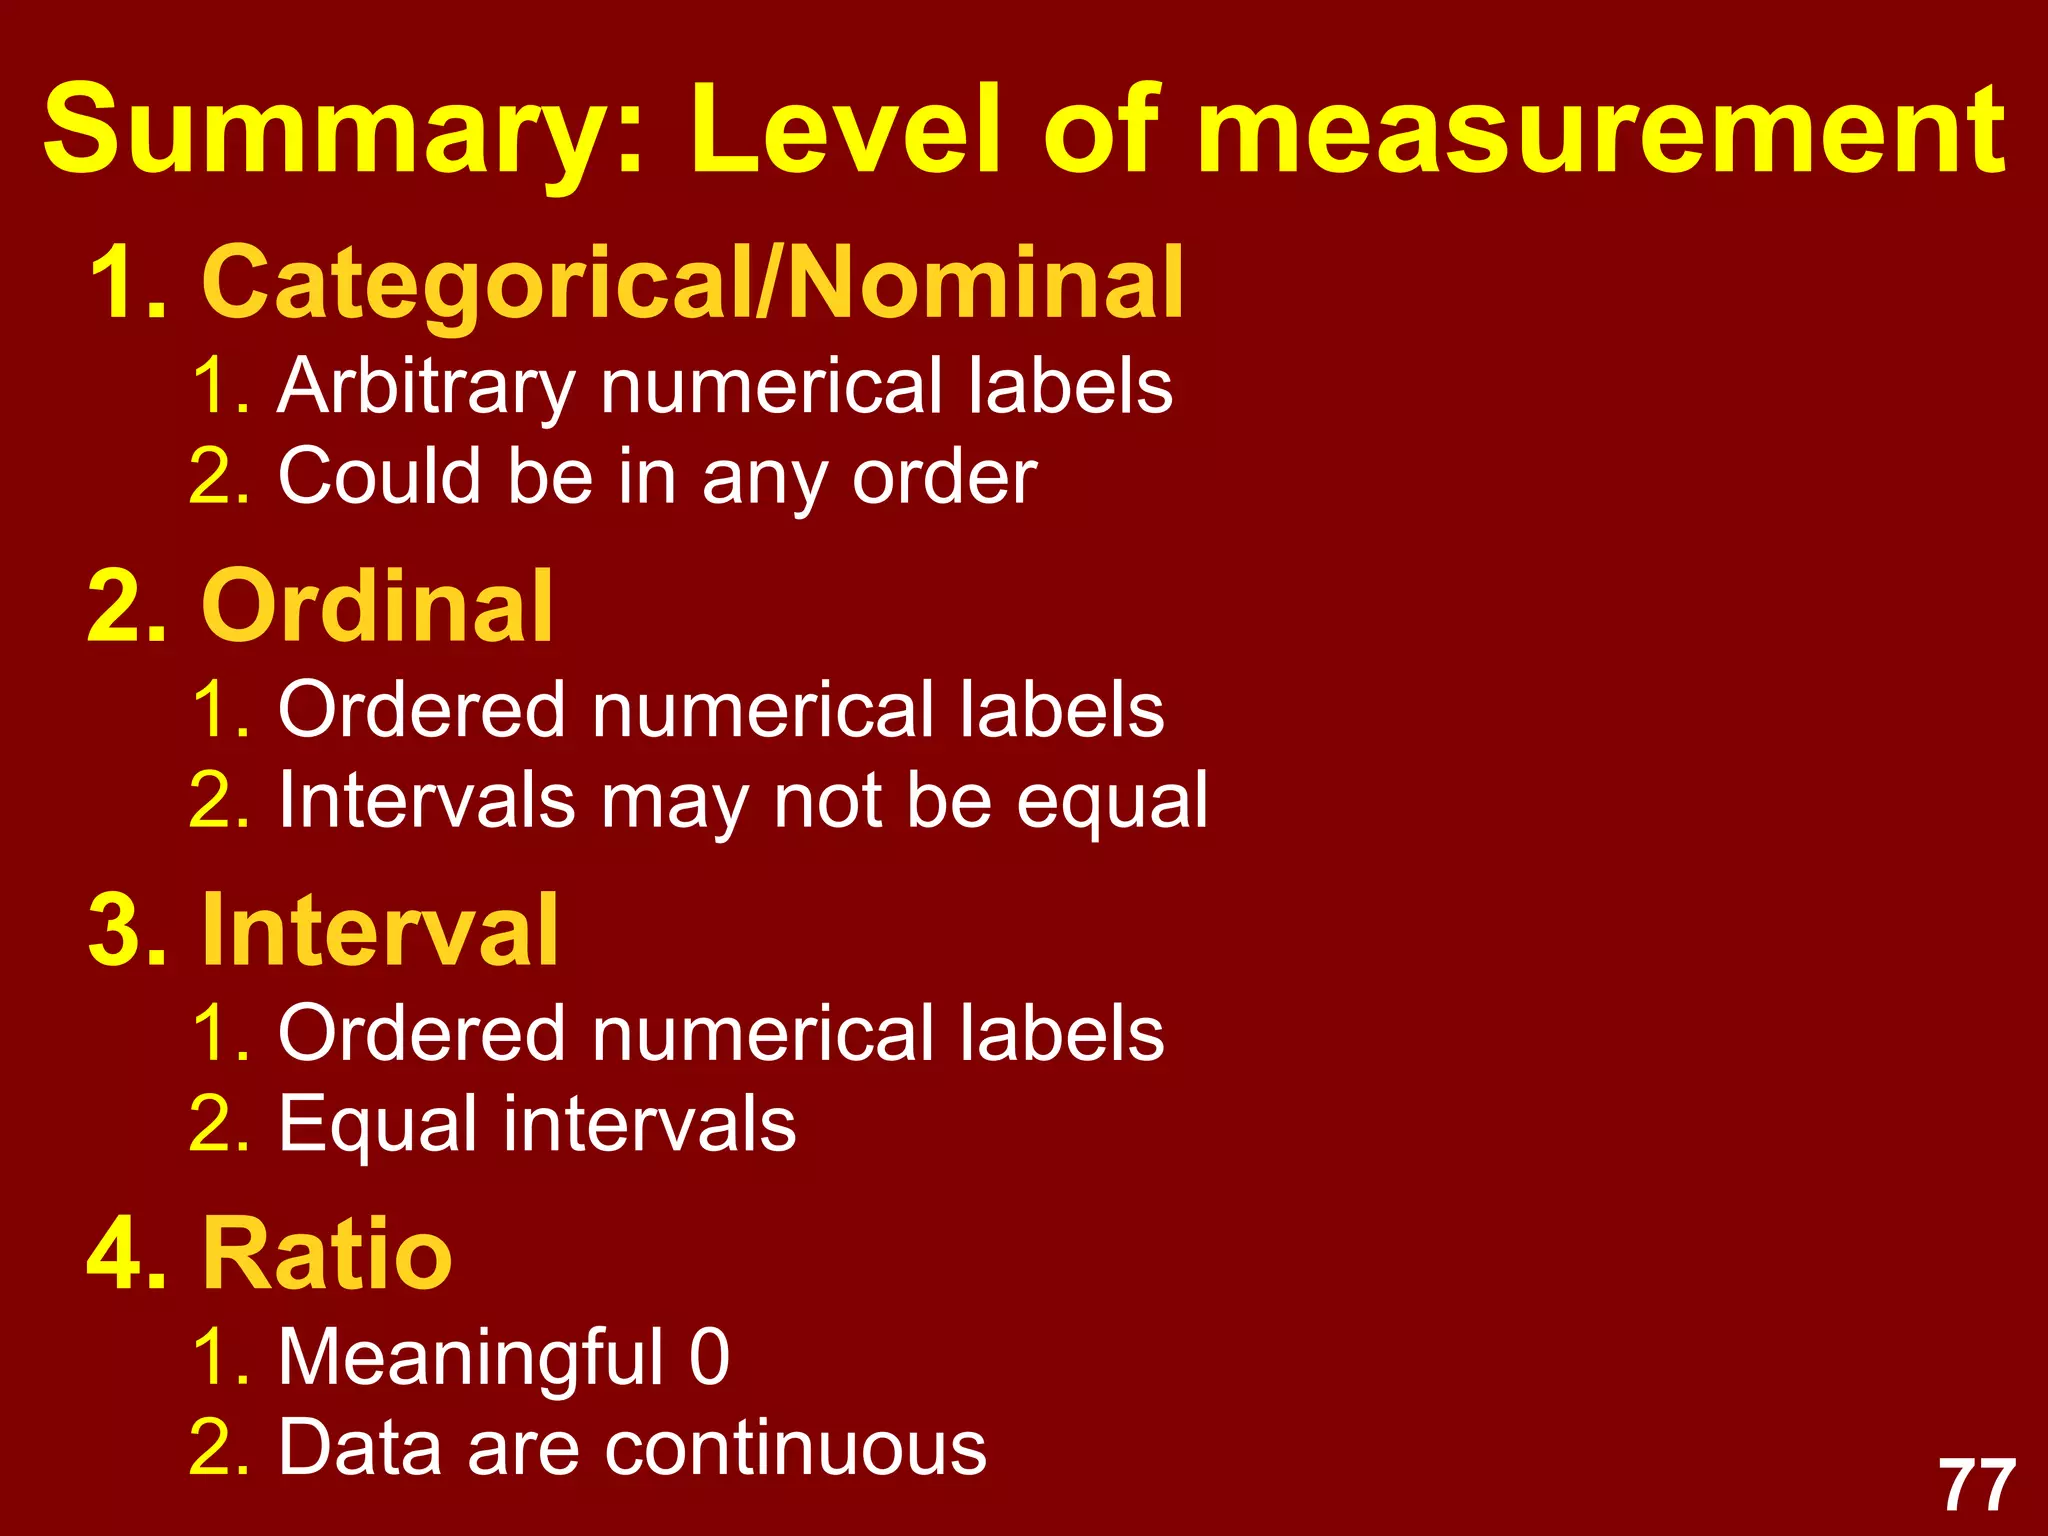
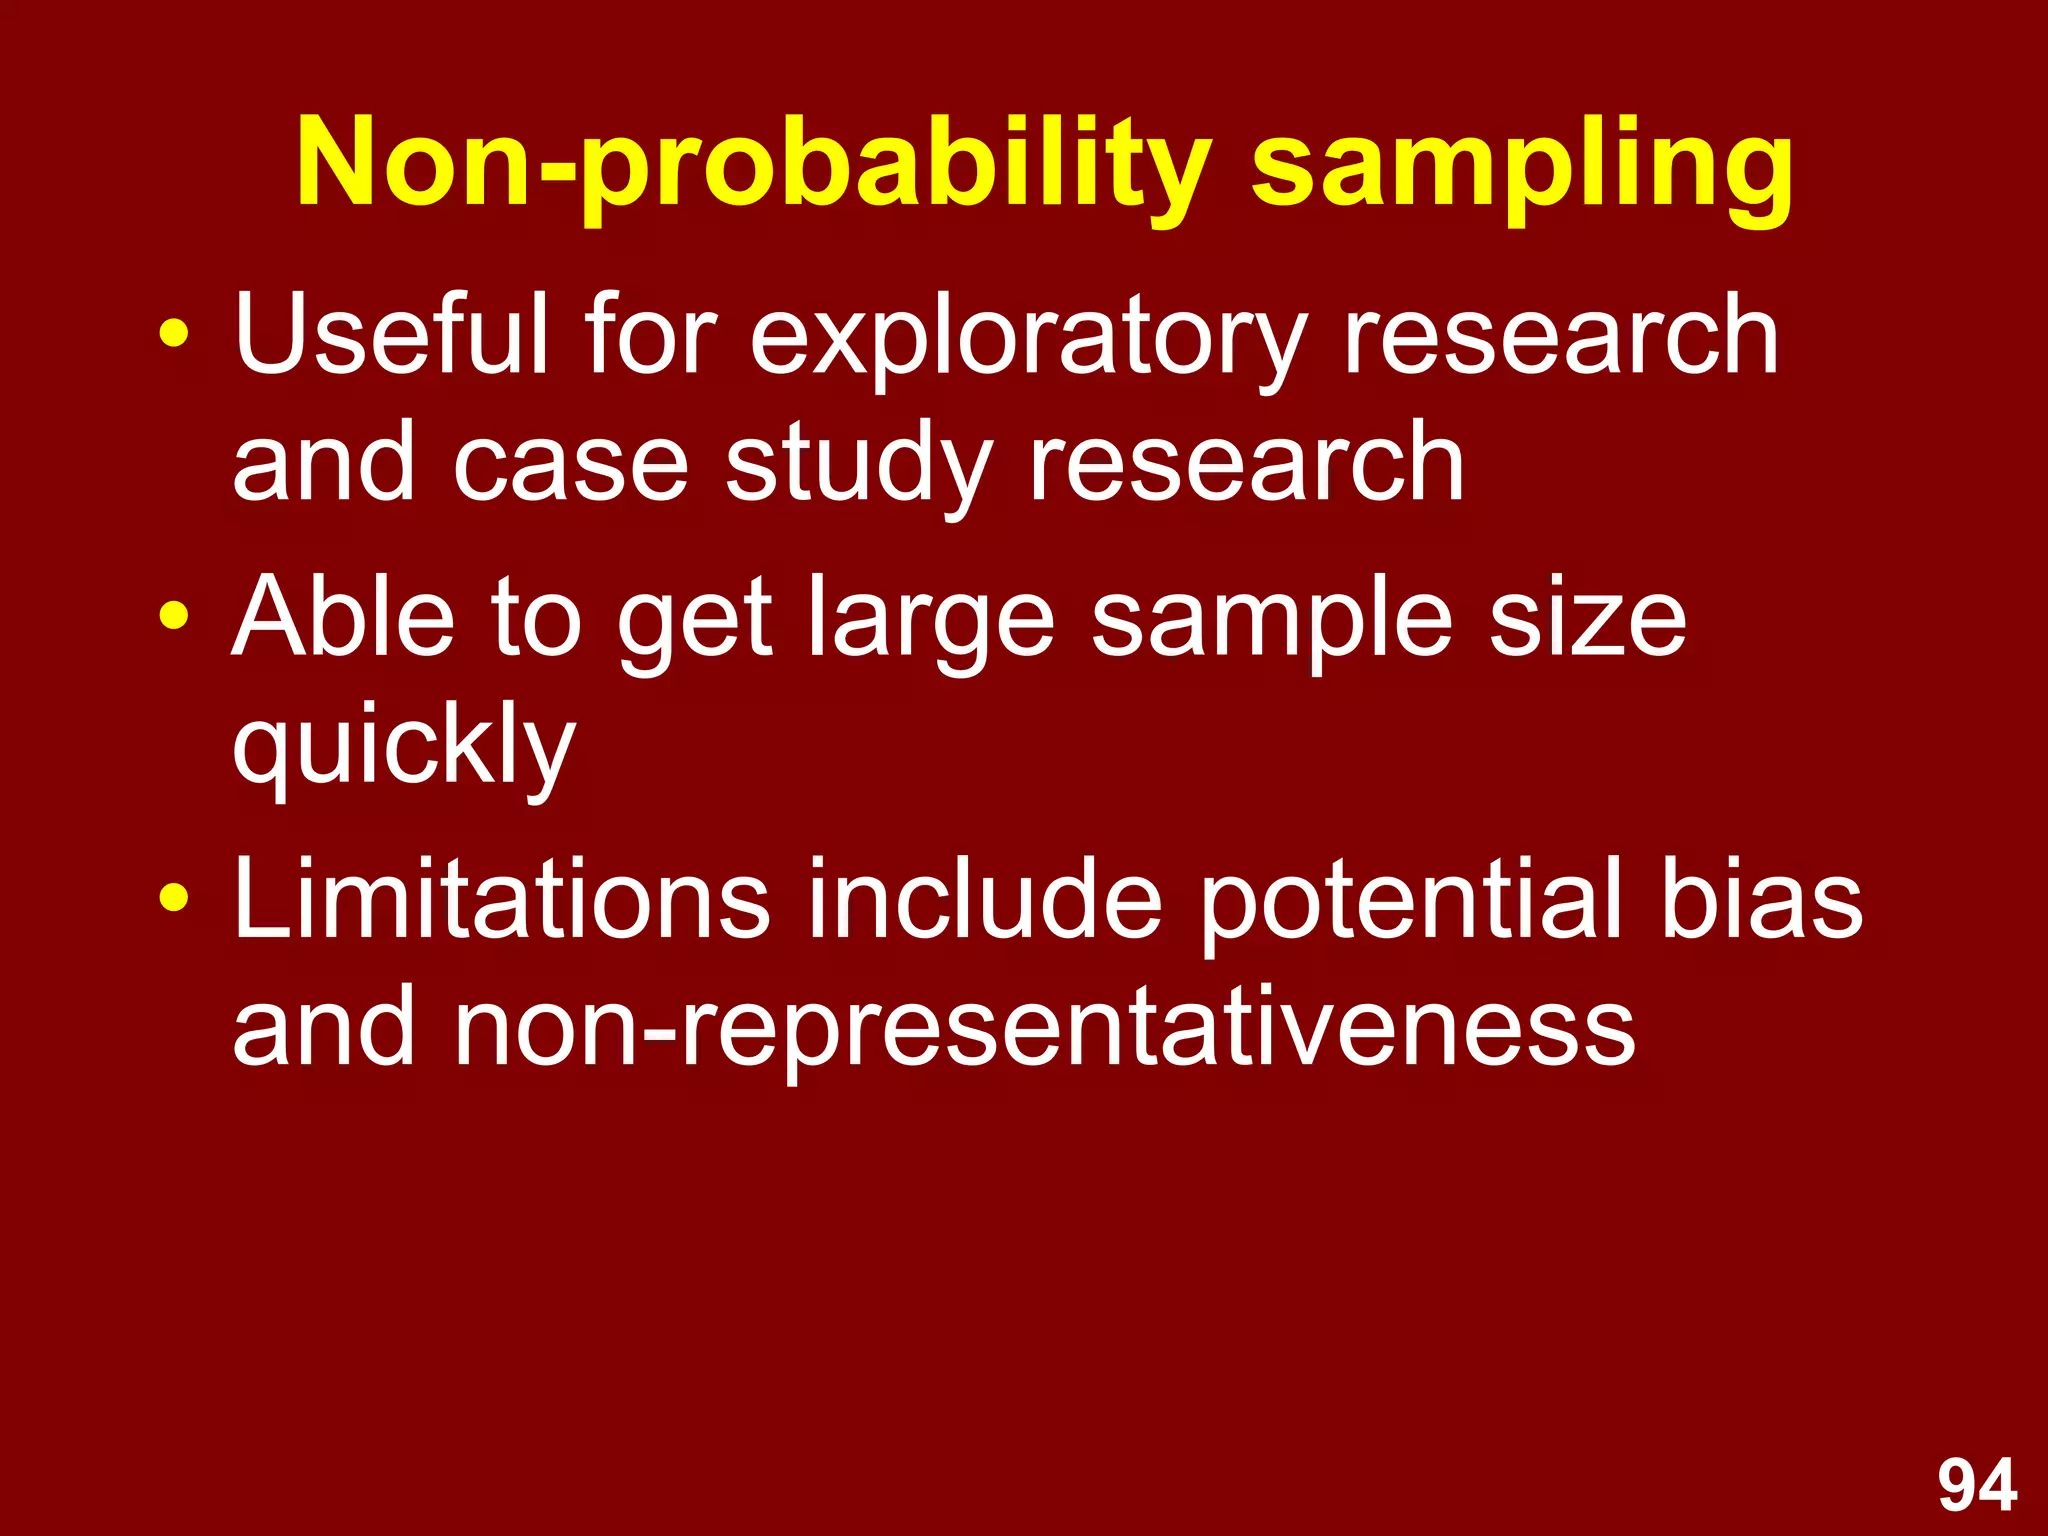
Downloaded 2,076 times


![47
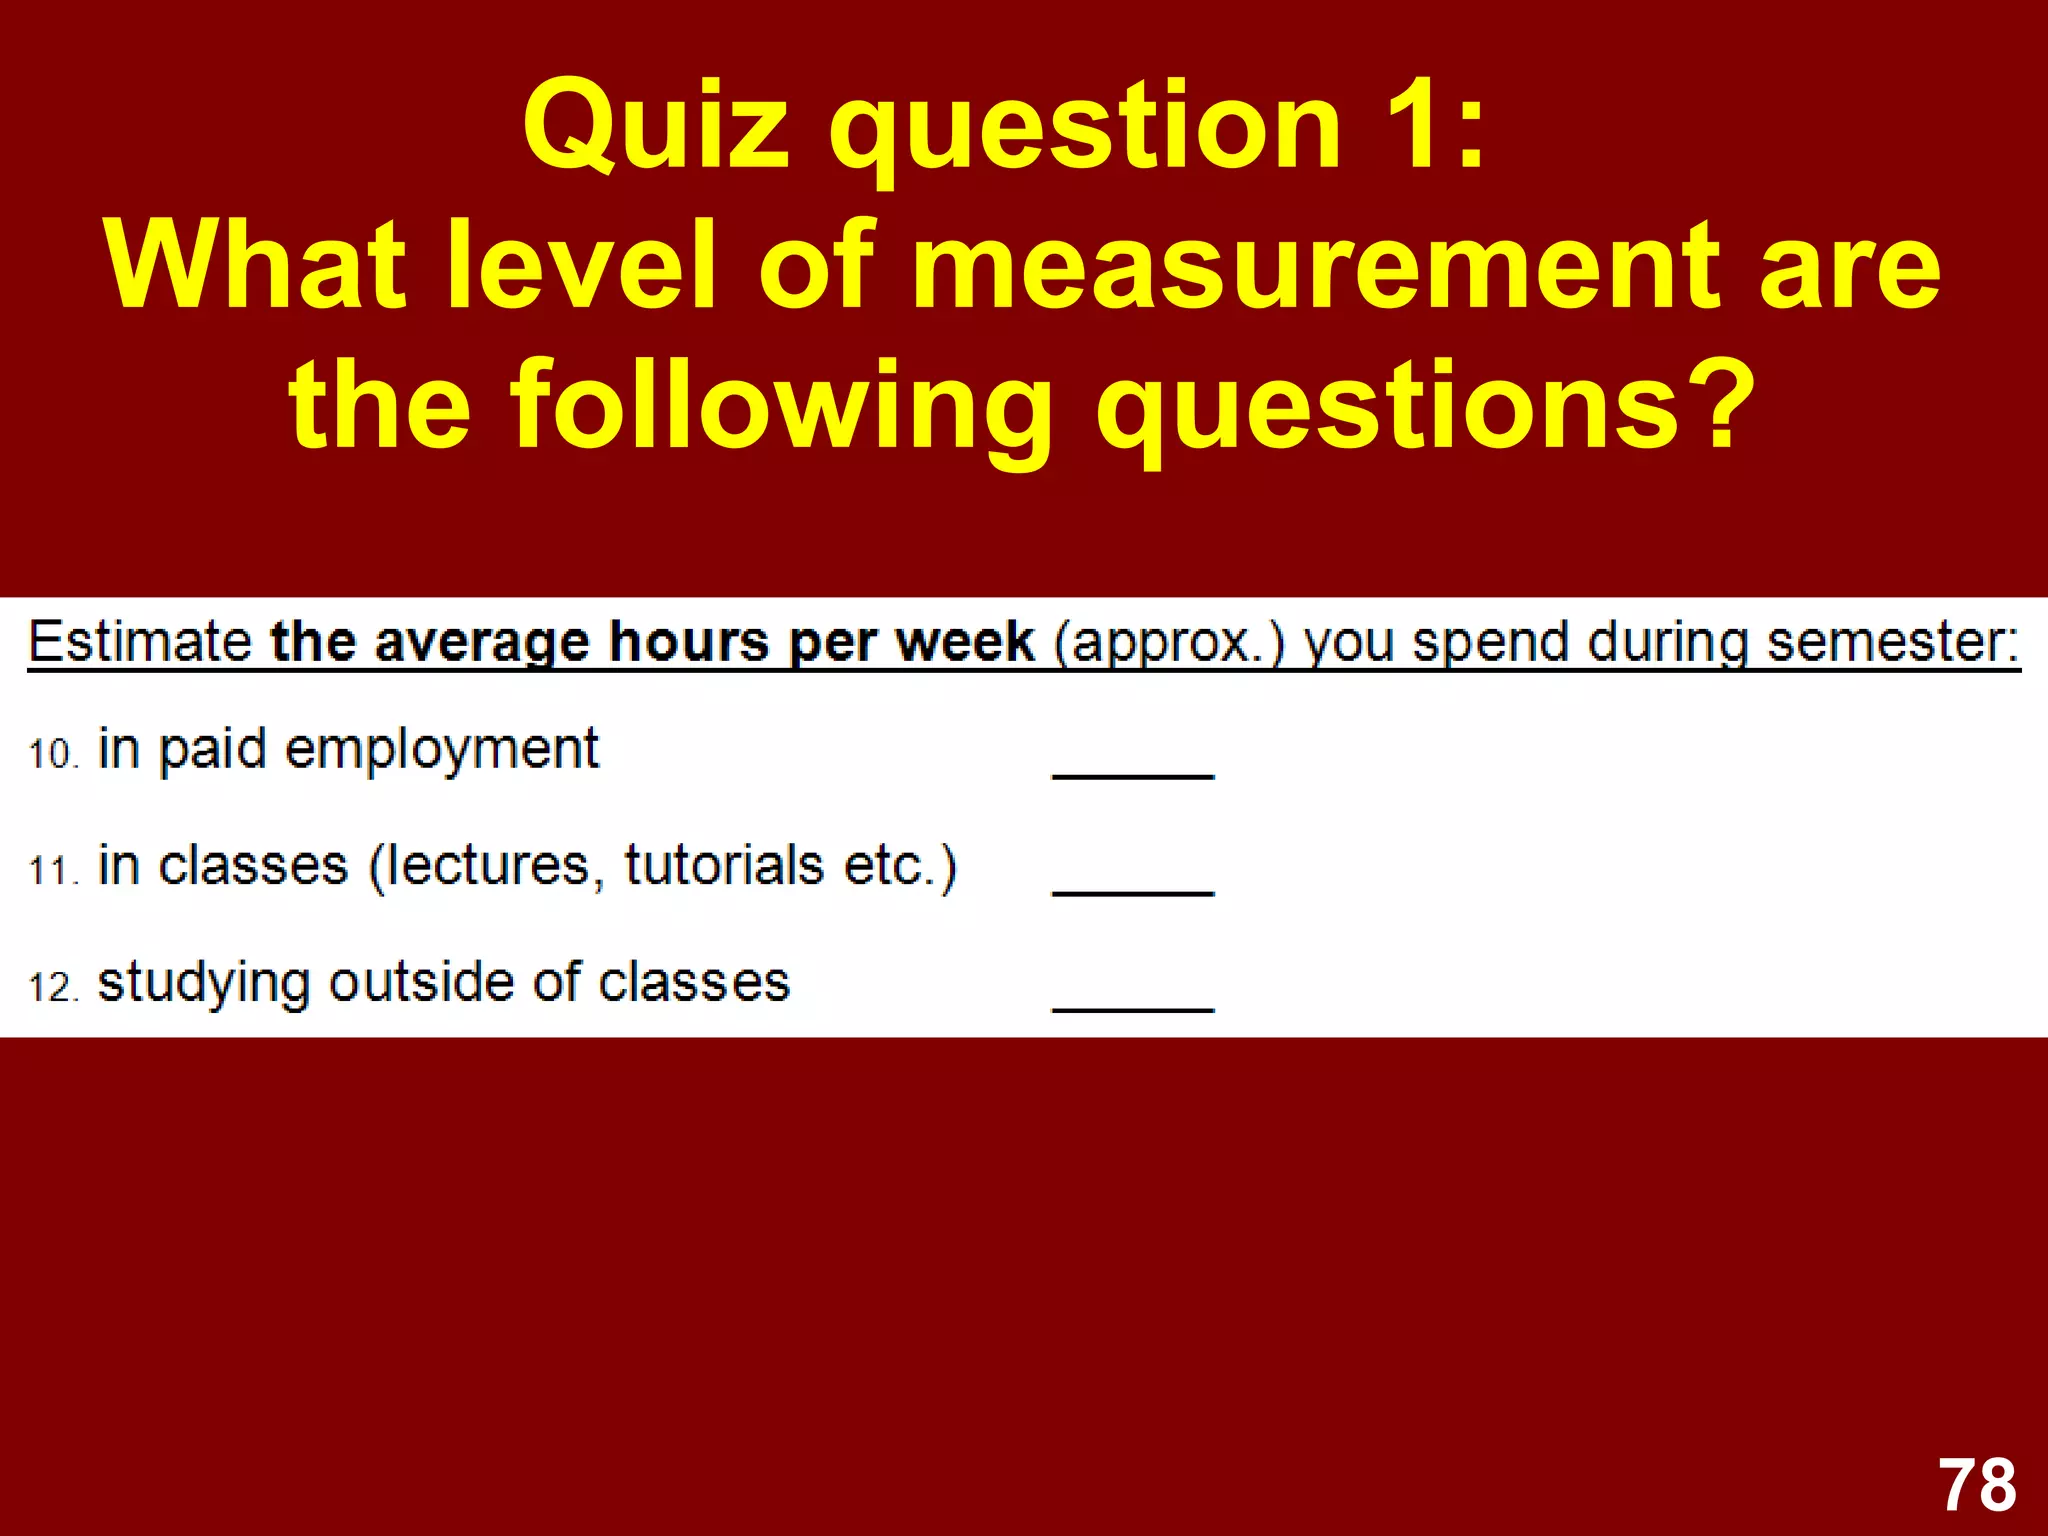
Verbal frequency scale
Over the last [period of time], how
often have you argued with your
intimate partner? (circle one)
1. All the time
2. Fairly often
3. Occasionally
4. Never
5. Doesn’t apply to me at the moment](https://image.slidesharecdn.com/survey-design-ii-1204634497987472-5/75/Survey-Design-47-2048.jpg)


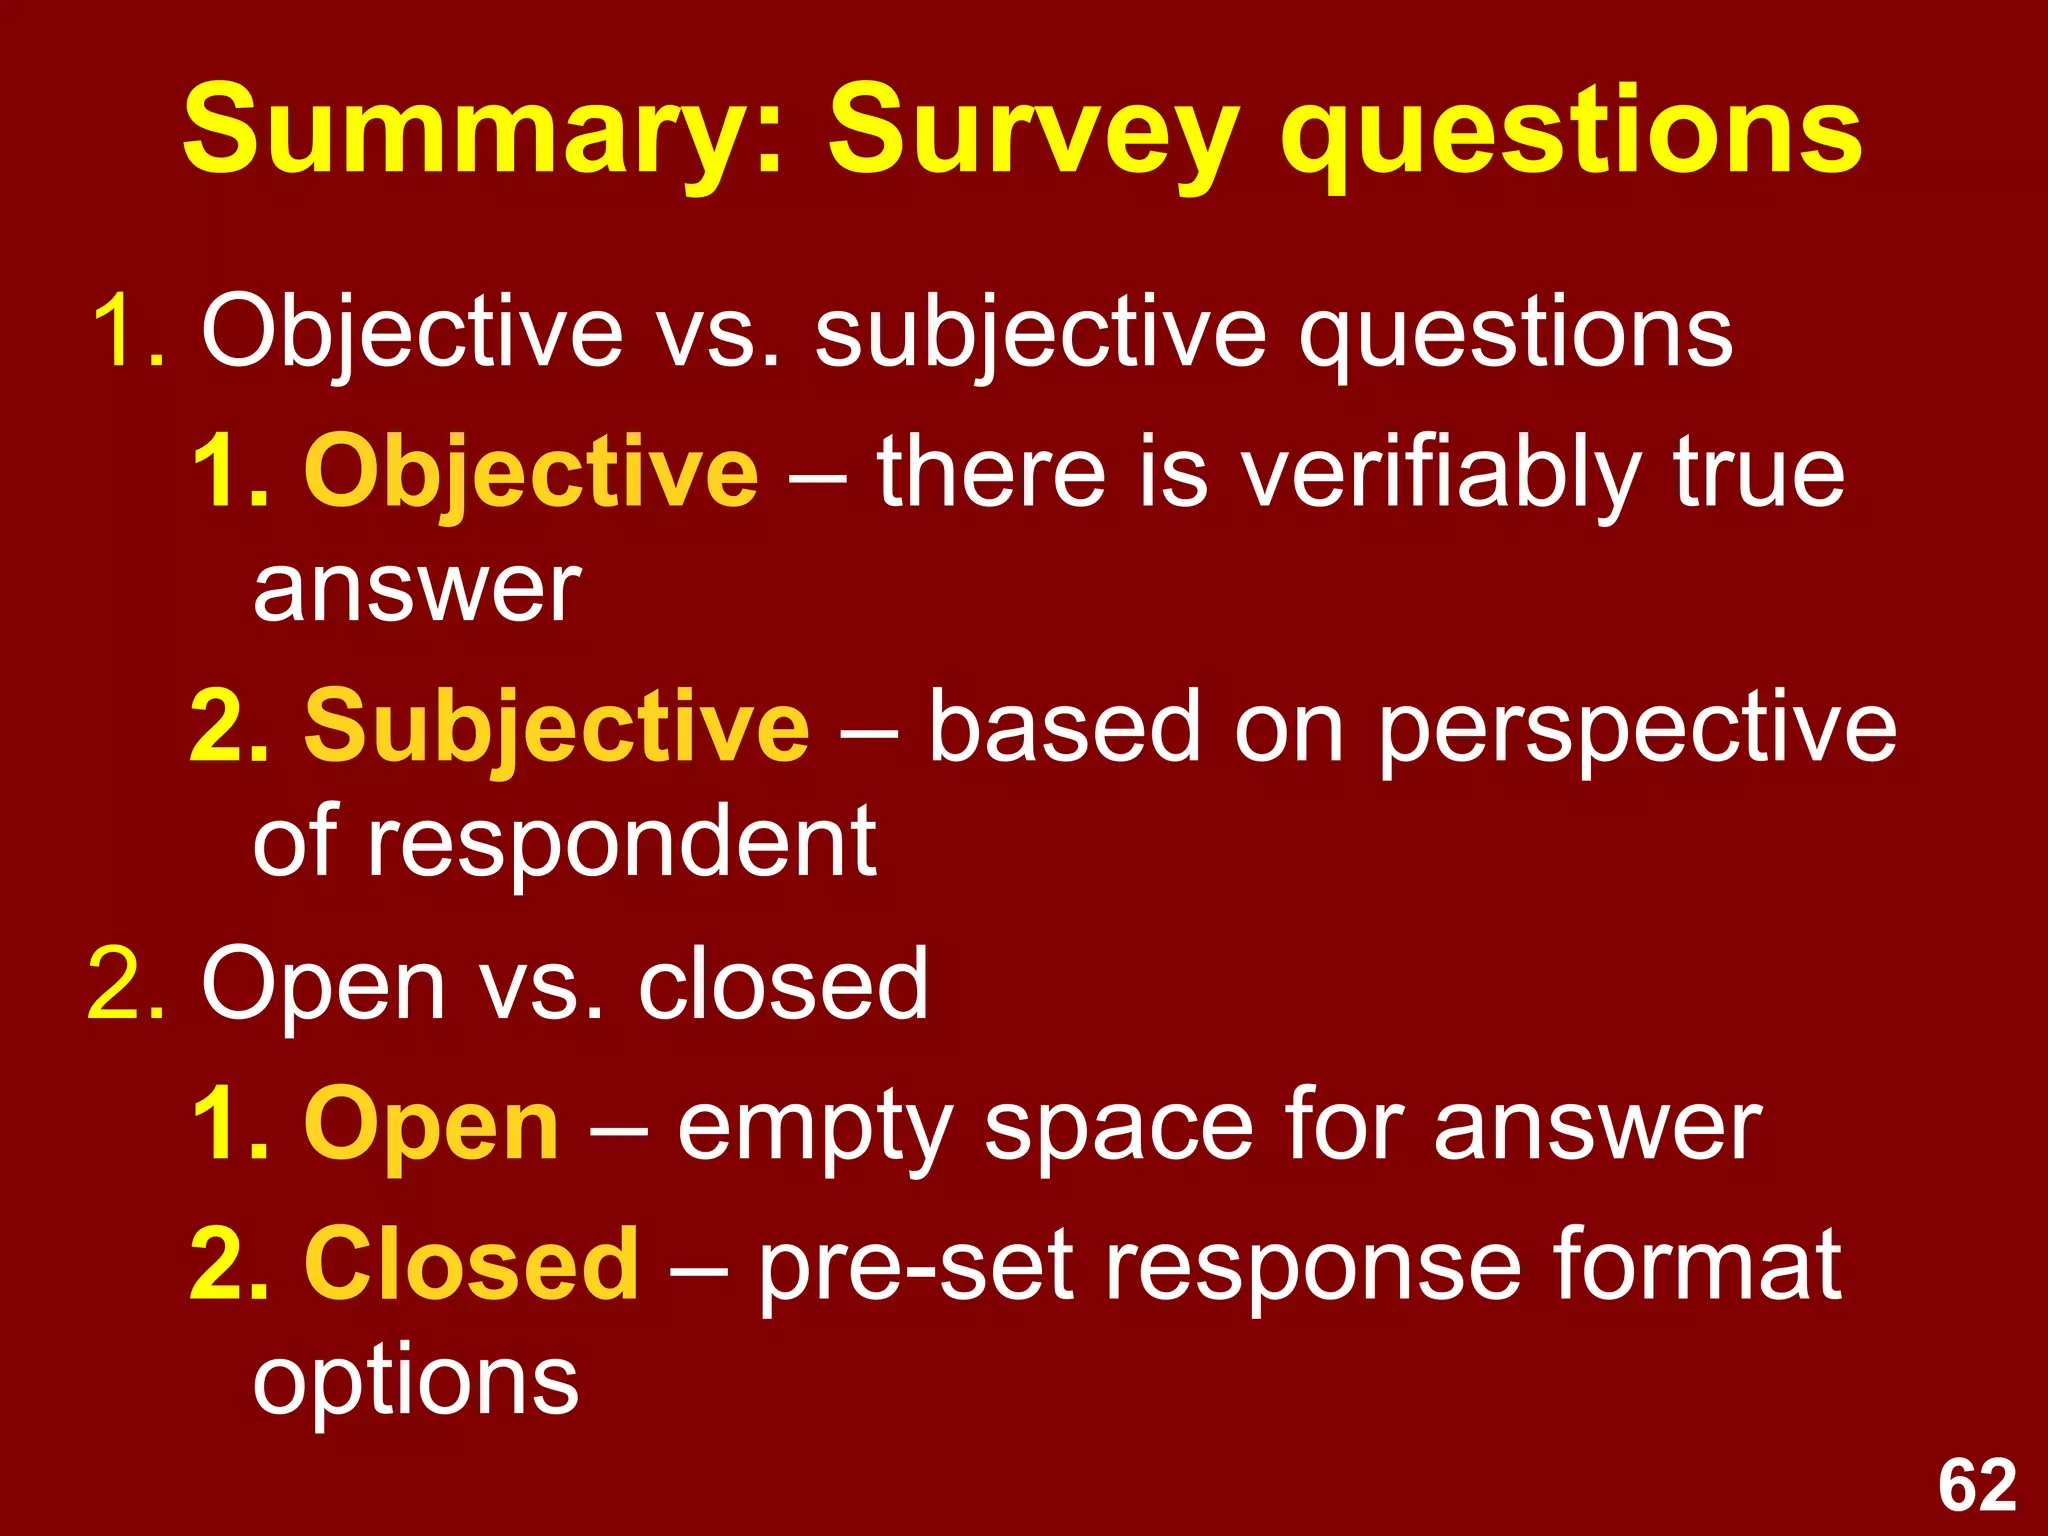


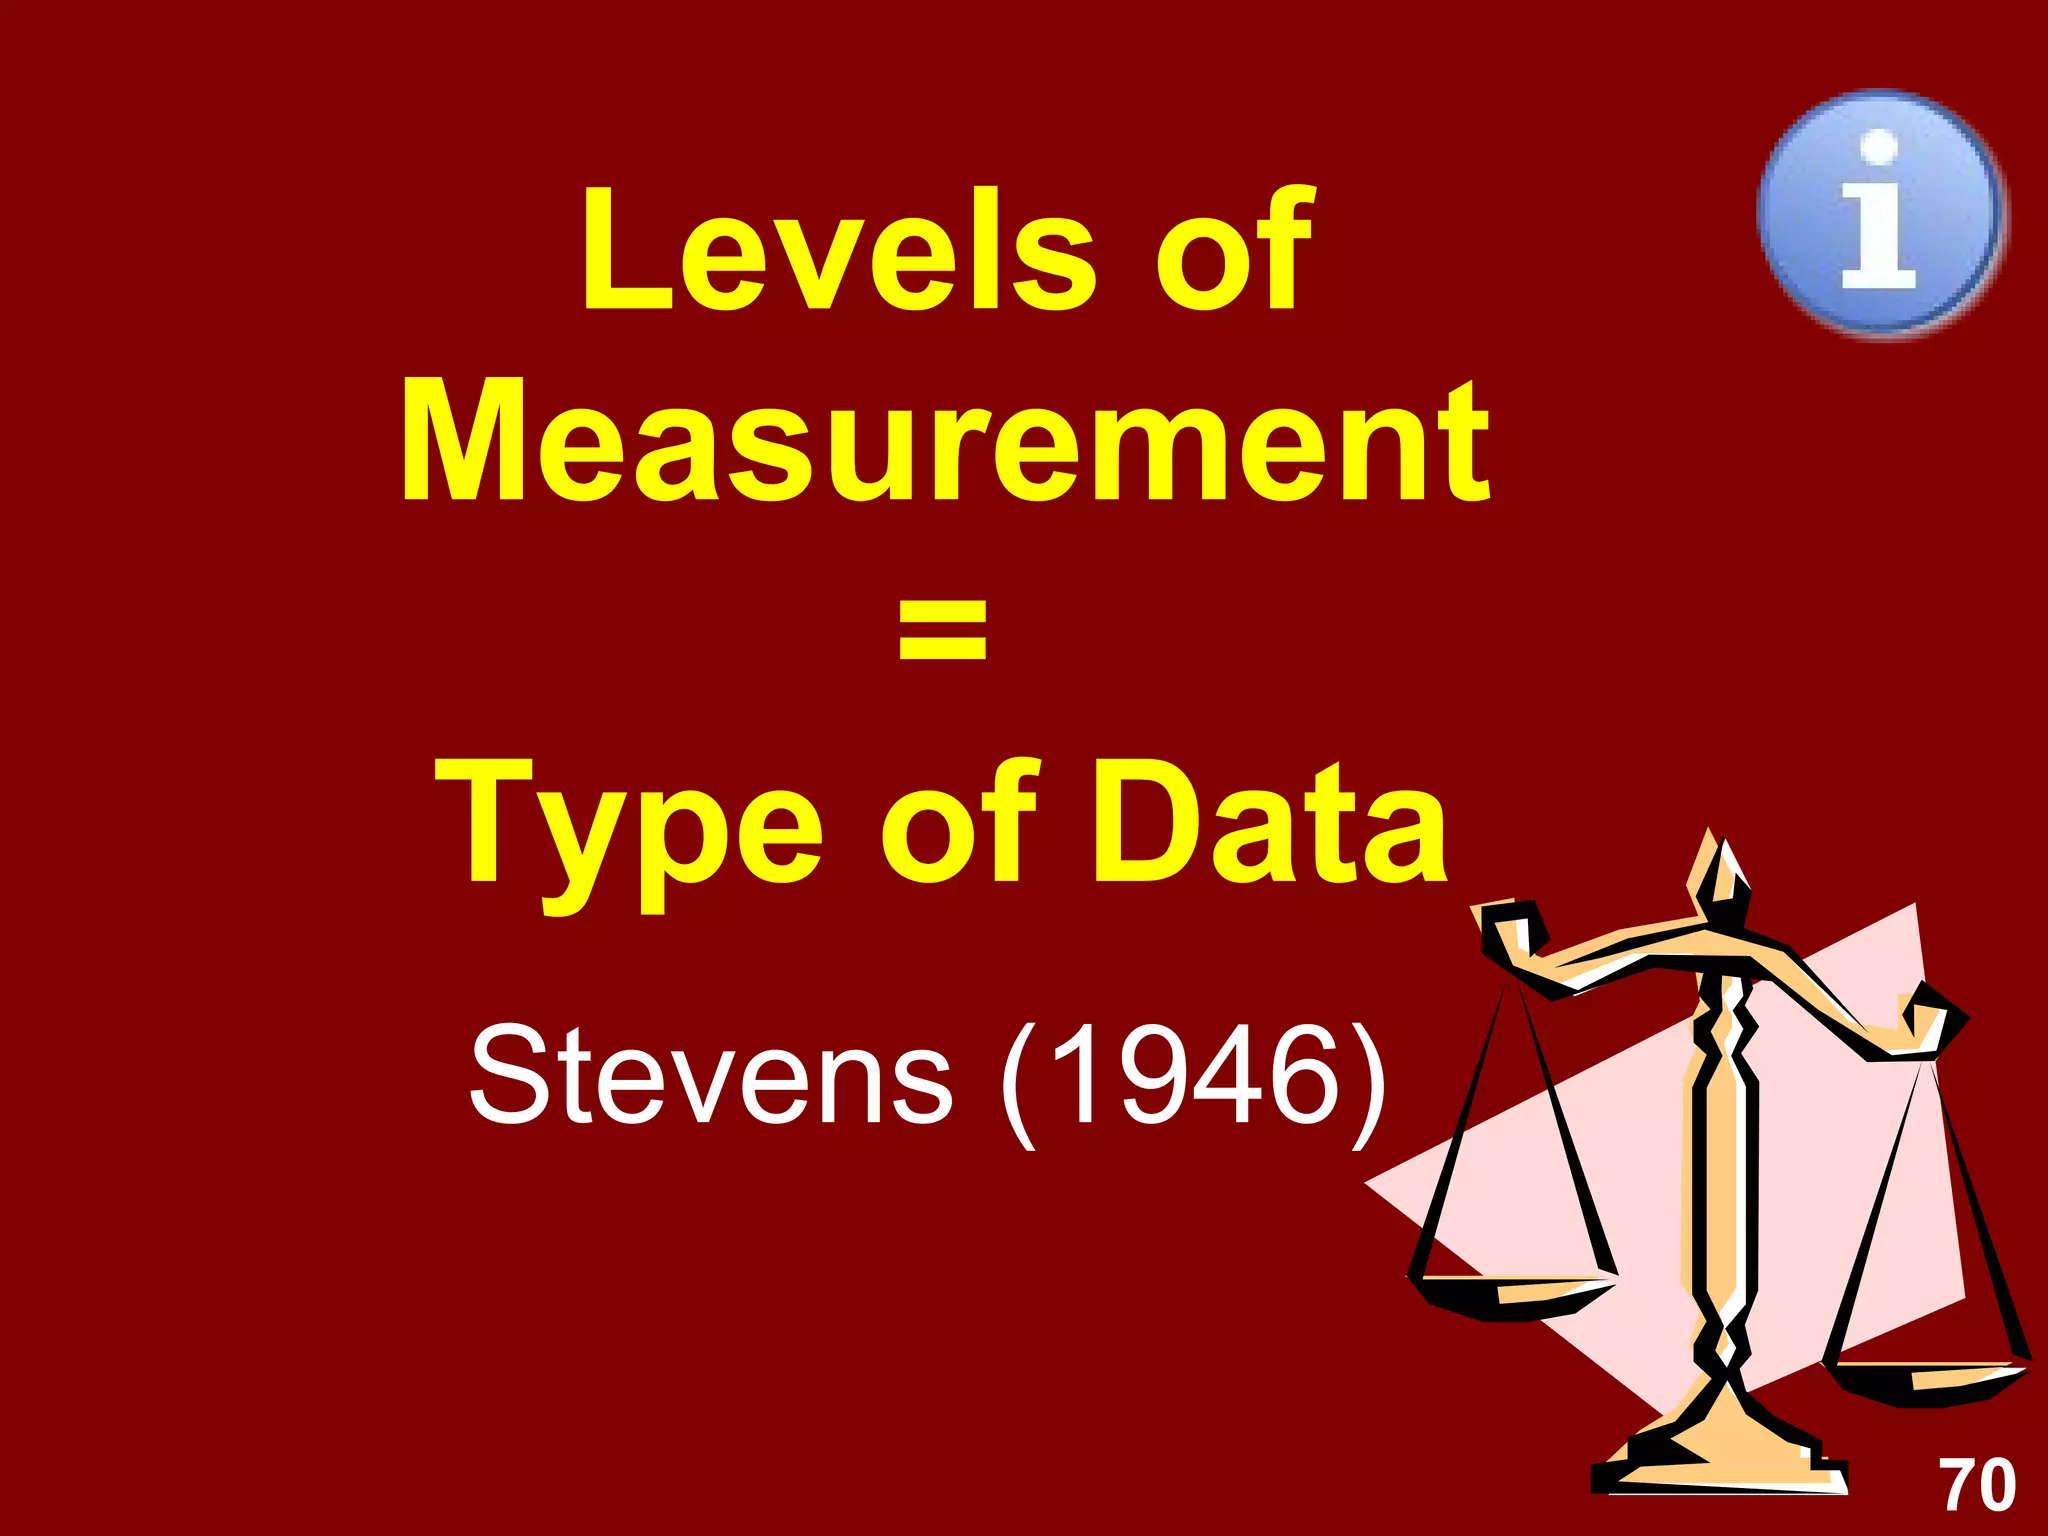
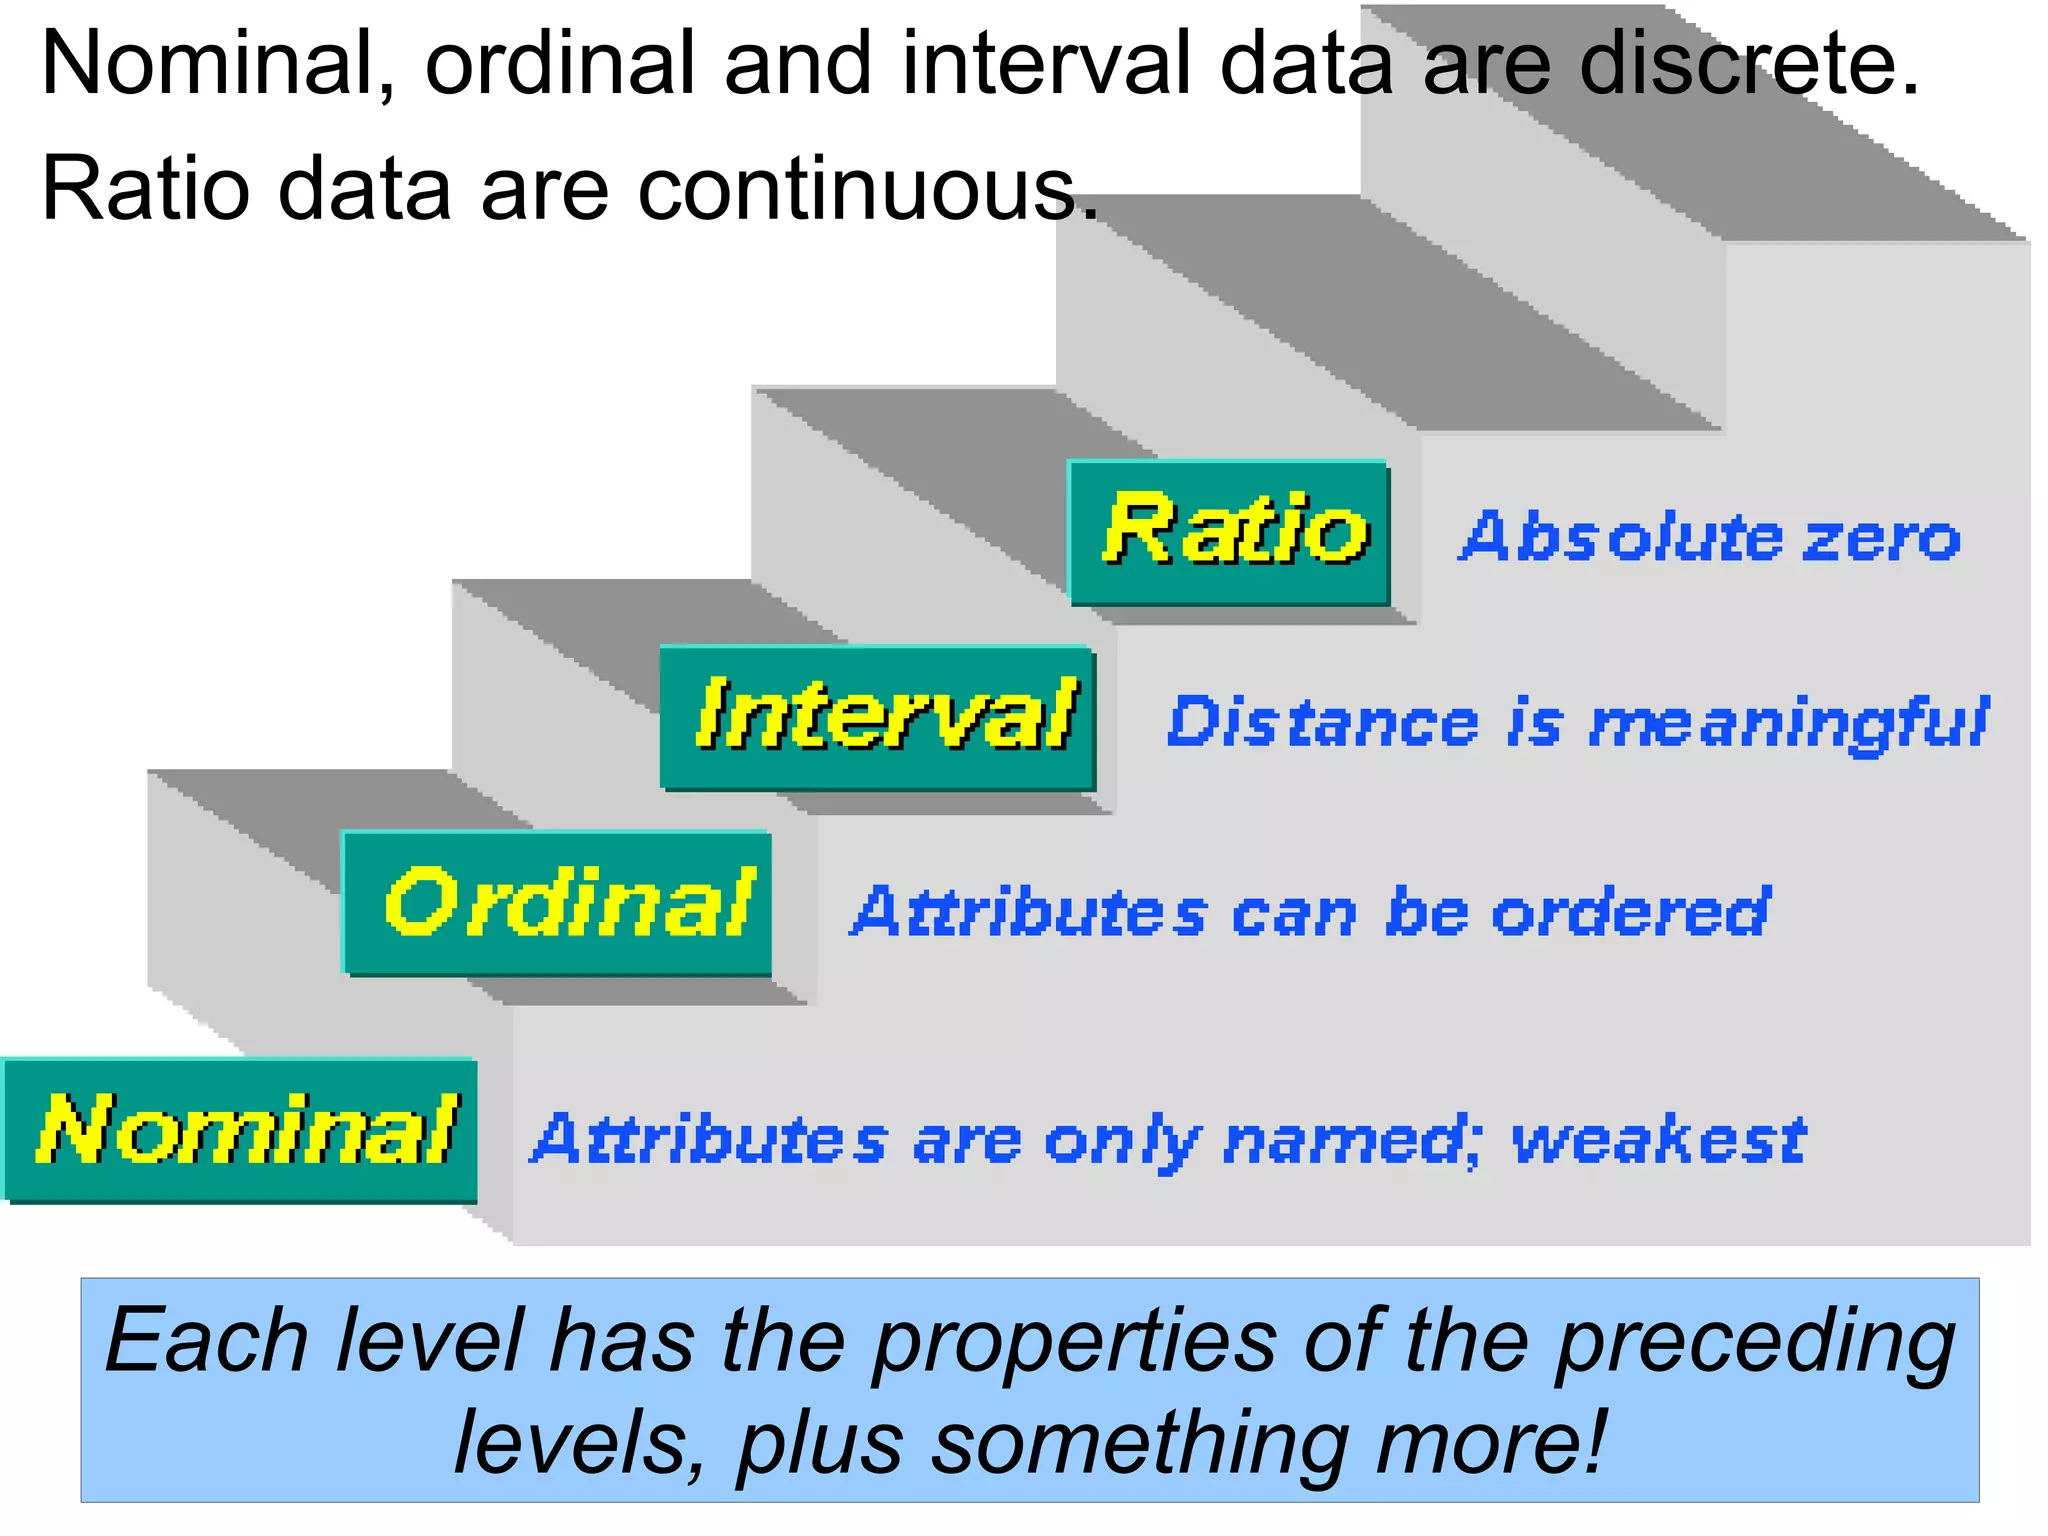


This document provides an overview and summary of key concepts related to survey research and design in psychology. It discusses survey administration methods like interviews versus self-administered surveys. Important considerations for survey construction are covered, like question styles, response formats, and reducing biases. The document also examines sampling techniques and different levels of measurement used in surveys.


![Survey design-workshop-1234170716539145-3[1]](https://cdn.slidesharecdn.com/ss_thumbnails/survey-design-workshop-1234170716539145-31-120721053559-phpapp02-thumbnail.jpg?width=640&height=640&fit=bounds)


