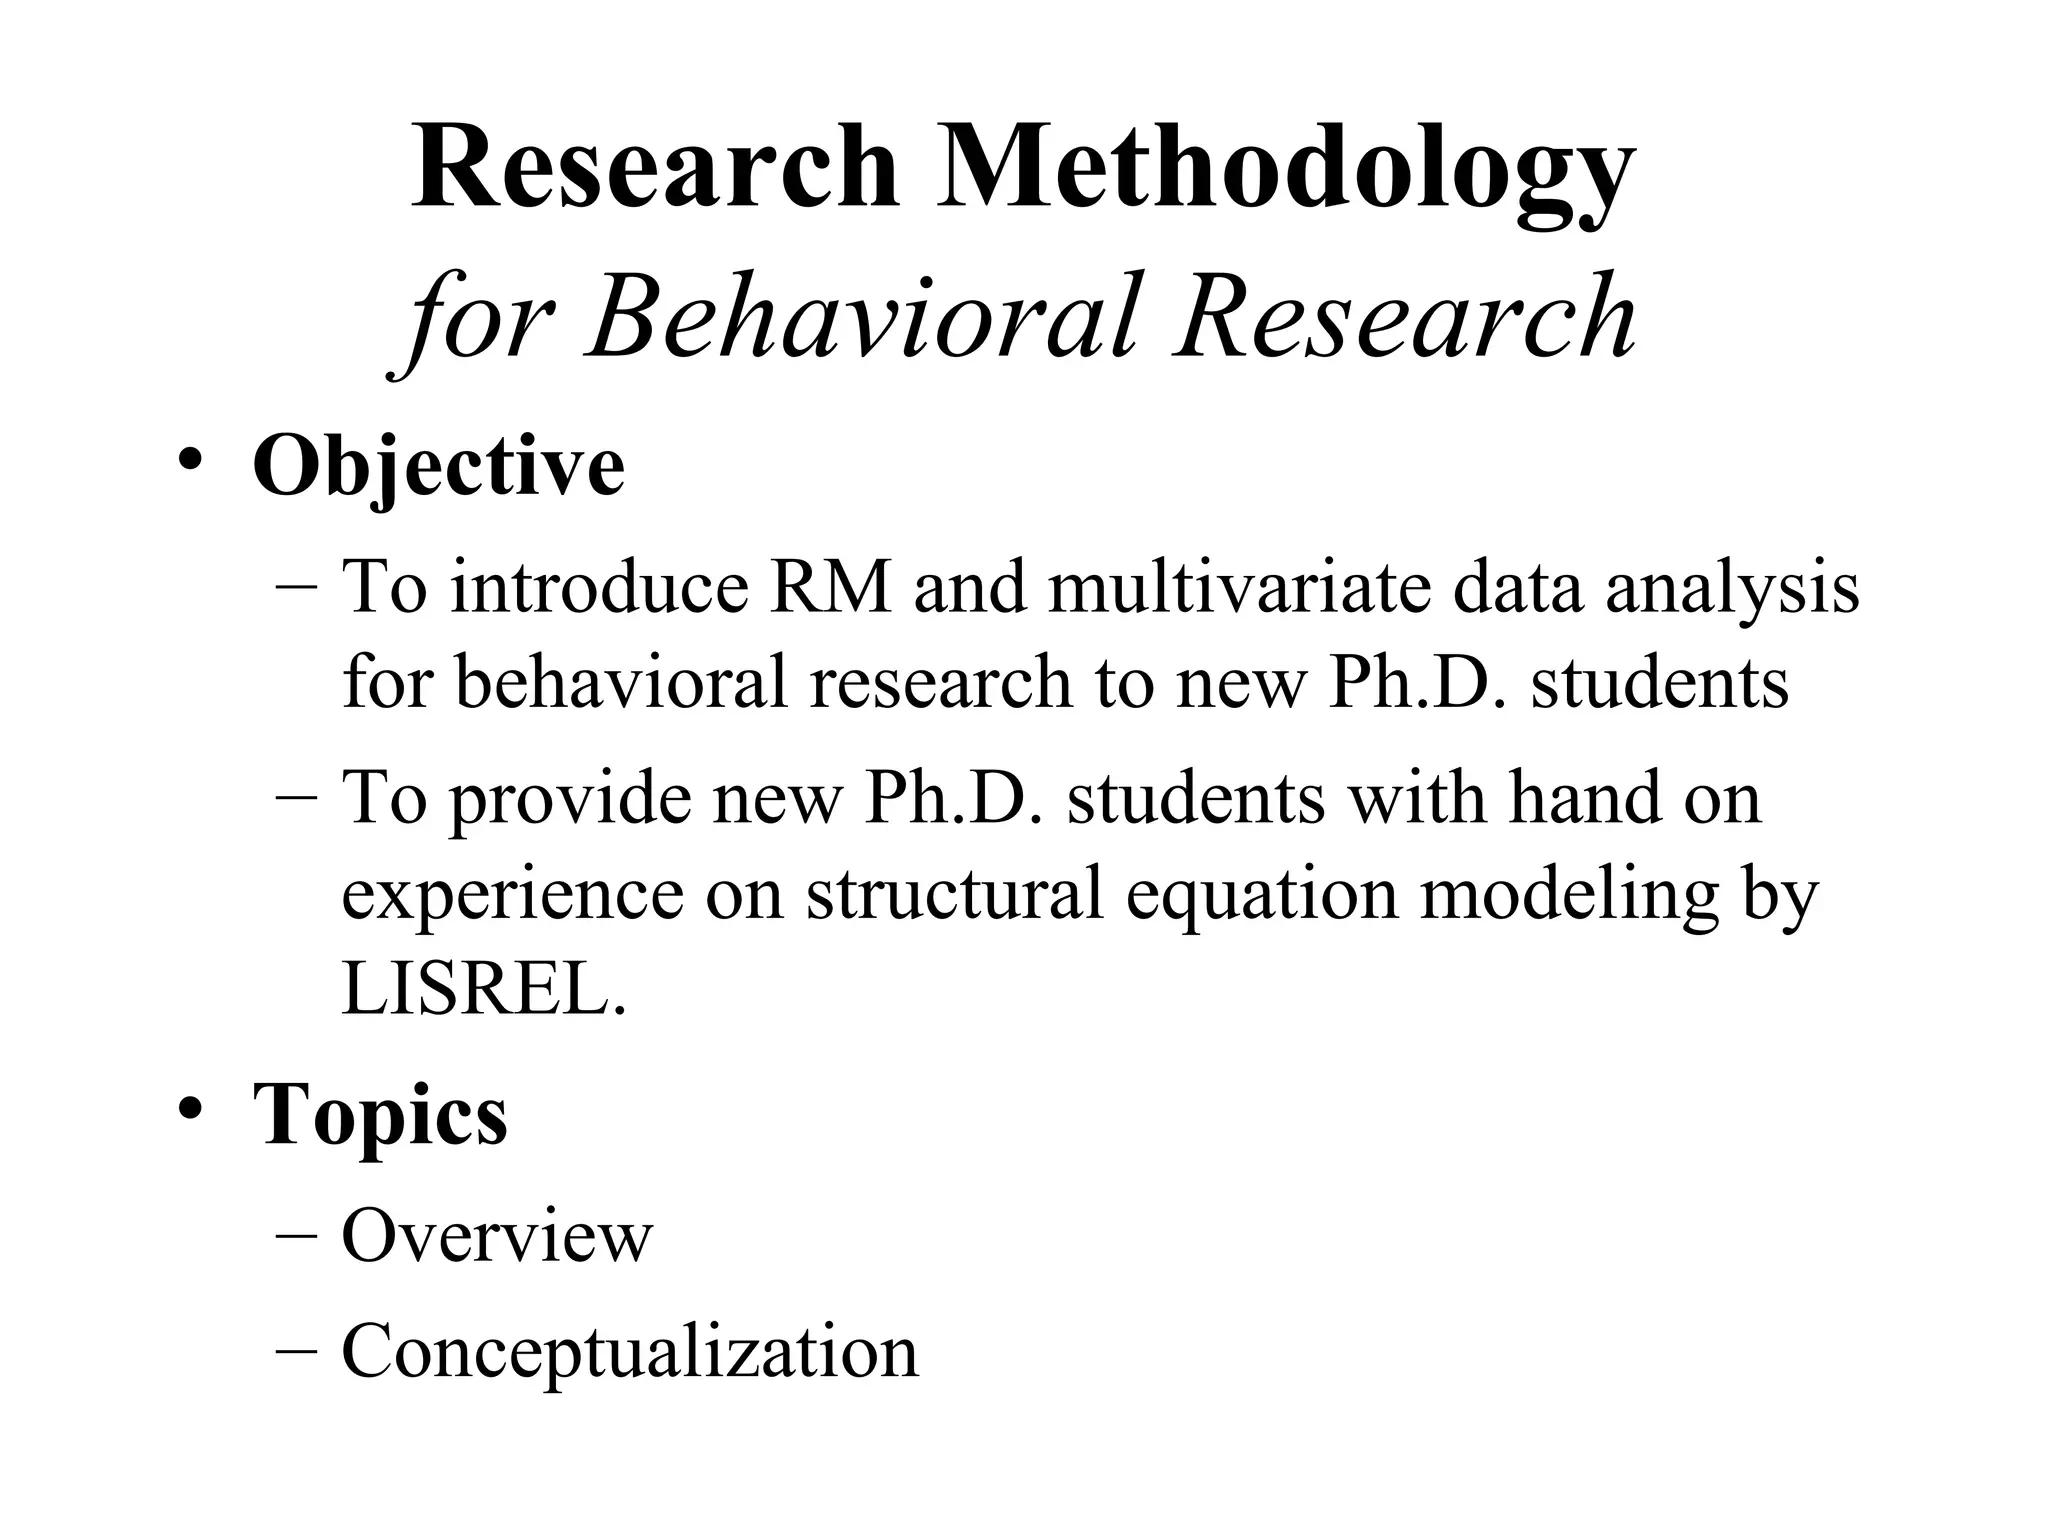
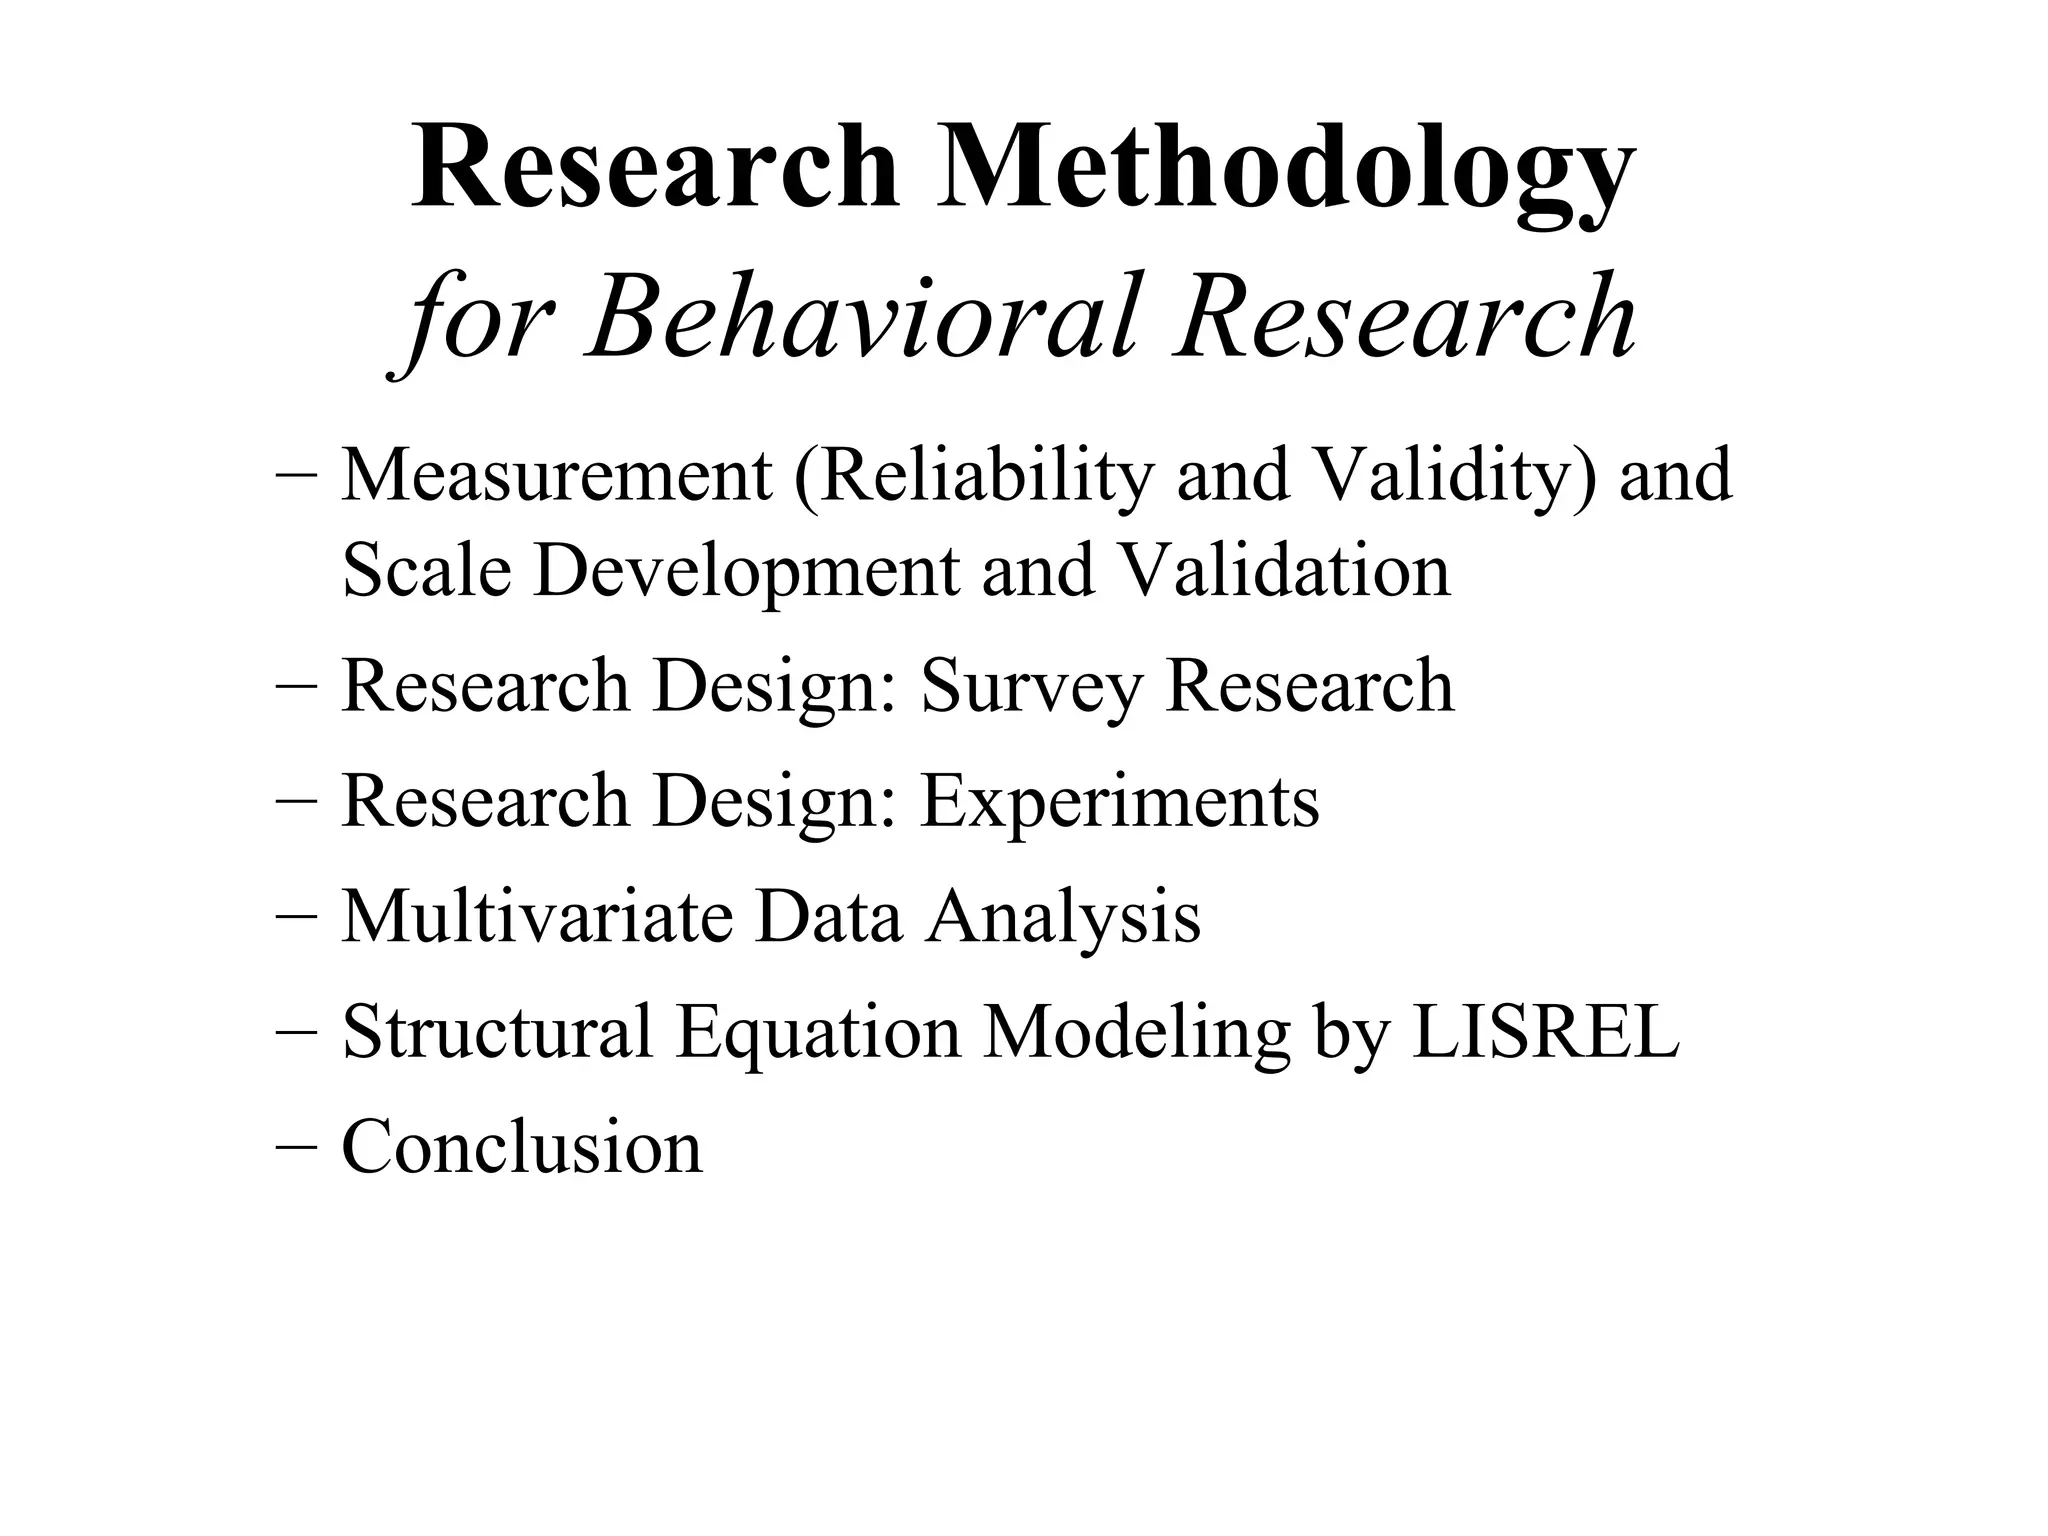
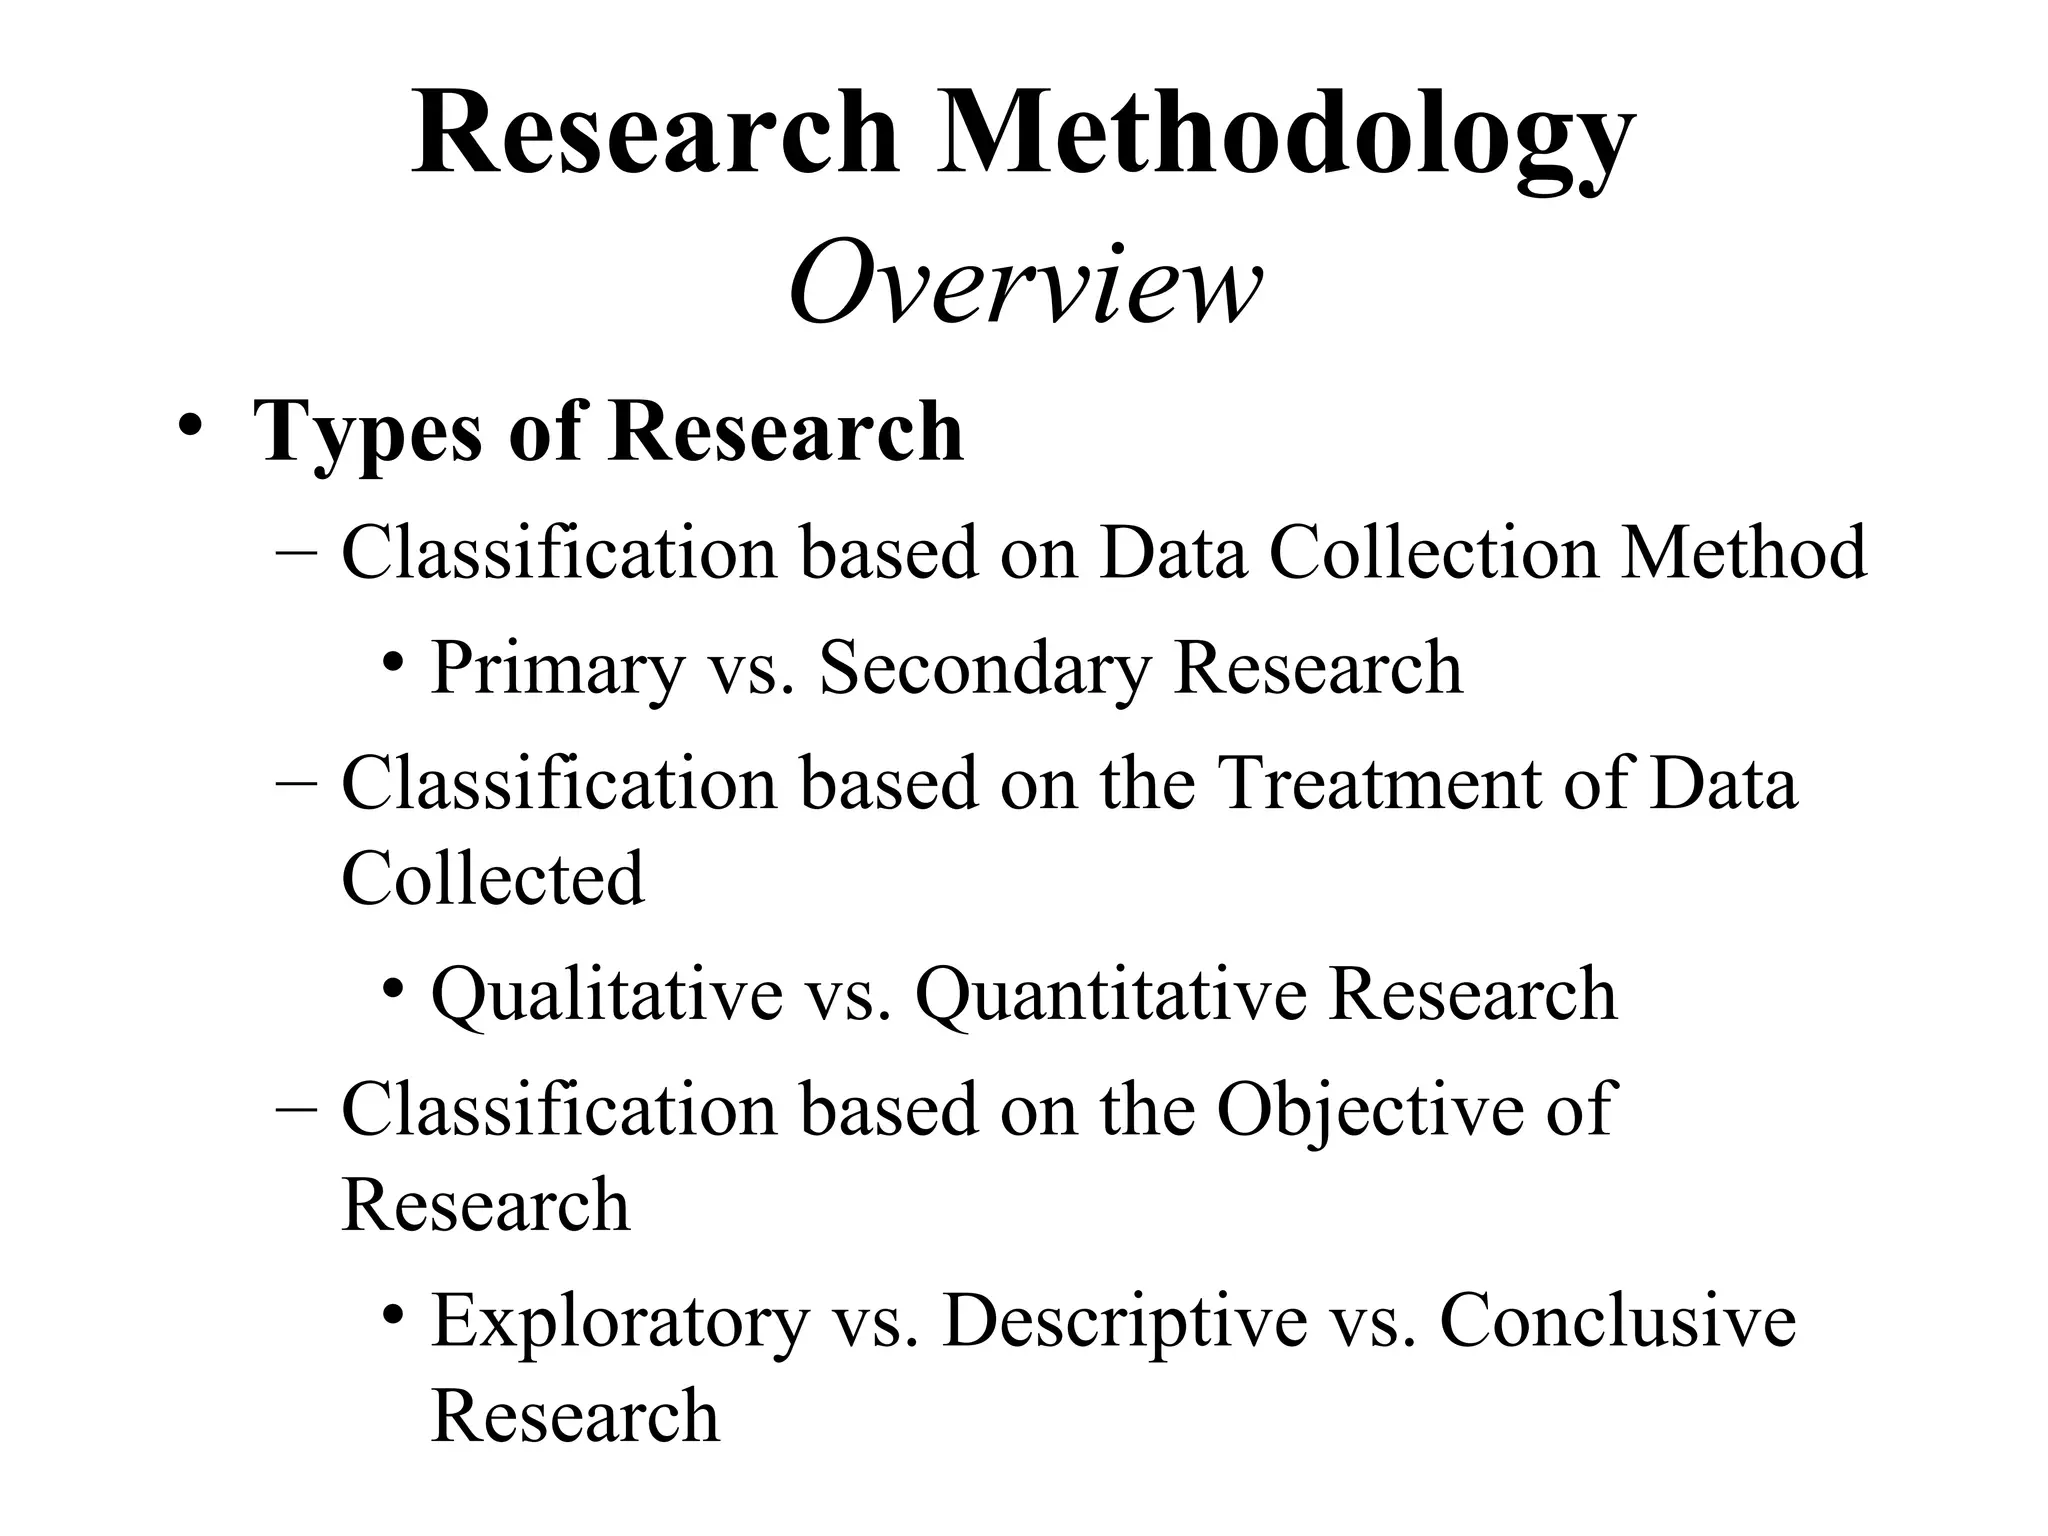
The document provides an overview of research methodology for behavioral research. It aims to introduce research methodology and multivariate data analysis to new Ph.D. students. Topics covered include conceptualization, measurement, research design, multivariate analysis, and structural equation modeling. The goal is to provide hands-on experience with techniques like LISREL for analyzing behavioral research questions.
2. Research Methodology
for Behavioral Research
• Objective
– To introduce RM and multivariate data analysis
for behavioral research to new Ph.D. students
– To provide new Ph.D. students with hand on
experience on structural equation modeling by
LISREL.
• Topics
– Overview
– Conceptualization
3. Research Methodology
for Behavioral Research
– Measurement (Reliability and Validity) and
Scale Development and Validation
– Research Design: Survey Research
– Research Design: Experiments
– Multivariate Data Analysis
– Structural Equation Modeling by LISREL
– Conclusion
5. Research Methodology
Overview
• Types of Research
– Classification based on Data Collection Method
• Primary vs. Secondary Research
– Classification based on the Treatment of Data
Collected
• Qualitative vs. Quantitative Research
– Classification based on the Objective of
Research
• Exploratory vs. Descriptive vs. Conclusive
Research
6. Research
Secondary research
Primary research
(Literature review)
Qualitative Research Quantitative Research
Conclusive/Causal
Exploratory Research Descriptive Research
Research
7. Research Methodology
Overview
• Steps in Research Methodology
– Step 1: Problem formulation
– Step 2: Hypothesis formulation
– Step 3: Research design
– Step 4: Sample and sampling
– Step 5: Data collection
– Step 6: Data analysis
– Step 7: Manuscript Writing
8. Research Methodology
Overview
• Important Concepts
– Concepts
– Constructs
– Variables
– Relationships among concepts, constructs, and
variables
– The role of concepts, constructs, and variables
in research methodology
9. Research Methodology
Overview
• Concepts
– Concepts are abstractions from partciculars.
– Concepts have constitutive definitions. So
concepts are rich in meaning but cannot be
measured directly.
– Many things we want to study in behavioral
research are concepts, e.g., quality, satisfaction,
attitude, leadership.
– In research methodology, concepts are used in
the step of problem and hypothesis formulation.
10. Research Methodology
Overview
• Constructs
– Constructs are concepts that are measurable.
– Constructs are measurable because they have
additional definitions, operational definitions.
– Operationalization of concepts into constructs
concern with the concept of validity and
reliability.
– After operationalization, each concept becomes
a construct. In the measurement instrument
(e.g., questionnaire), each construct becomes a
measurement scale.
11. Research Methodology
Overview
– A measurement scale can be a single-item or
multiple-item scale.
– In research methodology, constructs are used in
the step of designing the measurement
instrument (operationalization of concepts).
• Variables (or Observed Variables)
– After using the measurement scales to collect
the responses from the subjects, each response
to each measurement of the scales is then coded
into “number”.
12. Research Methodology
Overview
– After “number” being assigned to each
measurement item of the scales, each item
becomes an observed variable.
• Relationships among Concepts,
Constructs, and Variables
– 1 concept 1 construct 1 scale 1 or
more observed variables
13. Research Methodology
Overview
• Step 1: Problem Formulation
– Qualitative research (e.g., focus group, in-depth
interviews) can be used to help formulate
problems.
– Characteristics of a good problem statement:
• It is in interrogative form.
• It specifies relations between two or more
constructs.
• It implies testability.
14. Research Methodology
Overview
• Step 2: Hypotheses Formulation
– Hypotheses are answers to problem statements.
– Qualitative research can be used to provide
hypotheses.
– Characteristics of a good hypothesis:
• It is in a conjecture form.
• It specifies relations between two or more
constructs.
• It implies testability.
15. Research Methodology
Overview
• Step 3: Research Design
– Research design is a research plan that will
guide the research process.
– Three basic research designs for social sciences
are sample surveys, experiments, and field
studies.
– Three desirable characteristics of research
design are precision/control, generalizability,
and existential realism.
16. Research Methodology
Overview
– There is no perfect research design; different
research designs have different strengths and
weaknesses.
• Sample surveys are high in generalizability but low
in precision/control and realism.
• Experiments are high in precision/control but low in
generalizability and realism.
• Field studies are high in realism but low in precision
and control and generalizability.
17. Sample
Surveys Experiments Field Studies
Generalizability High Low Low
Precision &
Control Low High Low
Existential
Realism Low Low High
18. Research Methodology
Overview
– From hypotheses, research design can be
derived:
• If data are collected by the communication method
and if both the dependent and independent
constructs are measurable, the research design will
be a sample survey.
• If the data are collected by communication method
and if the dependent constructs are measurable
while the independent variables are manipulable, the
research design will be an experiment.
• If the data are collected by observation in the field,
the research design will be a field study.
19. Research Methodology
Overview
• Step 4: Sample and Sampling
– Two types of sampling: probability and non-
probability sampling.
– Types of probability sampling:
• Simple random sampling
• Stratified sampling
• Cluster sampling
• Systematic sampling
• Area sampling
20. Research Methodology
Overview
– Types of non-probability sampling:
• Convenient sampling
• Judgmental sampling
• Quota sampling
• Snowball sampling
• Step 5: Data Collection
– Two types of data collection method:
• Communication method
• Observation
21. Research Methodology
Overview
– Design of measurement instruments (e.g.,
questionnaires)
• Uni-dimensional vs multi-dimensional constructs
• Single-item vs multiple-item constructs
• Relationships between constructs, measurement
scales, measurement items, and observed variables
– Questionnaire formats: open-ended vs closed-
ended questions
– Types of closed-ended questions:
• Dichotomous questions
• Multiple-choice questions
22. Research Methodology
Overview
• Scaled-response questions (e.g., Likert scale,
semantic differential scale)
– An important issue in designing measurement
instrument is the measurement property of the
instrument, which includes reliability and
validity.
• Reliability is the accuracy or precision of a
measurement instrument: the extent that the
instrument is free of error variance.
• Reliability is the internal consistency of a test.
23. Research Methodology
Overview
• Validity addresses the question “Are we measuring
what we want we want to measure?”
• Validity is the extent that the measurement
instrument free of systematic variance and error
variance.
• Step 6: Data Analysis
– Statistical analyses for experiments
• ANOVA/MANOVA
• ANCOVA/MANCOVA
– Statistical analyses for surveys/field studies:
dependence vs interdependence techniques
25. Research Methodology
Overview
• Step 7: Manuscript Writing
– Title page
– The Abstract
– The Text
• Introduction
• Literature Review
• Methodology
• Results and Discussion
• Conclusion: Managerial Implication, Limitations, and Future
Research Direction
– References
– Appendices
27. Research Methodology
Conceptualization
• What is Conceptualization?
– See Granzin’s (1985) article on
Conceptualization of Research Projects
– For a research project to be successful, it must
be properly conceptualized before the empirical
portion of the research can be designed, and the
data collected and analyzed.
– Conceptualization is the stage in the research
project where researchers must think at an
abstract level. Researcher must work with
concepts and the relationships among them.
28. Research Methodology
Conceptualization
– Conceptualization is the process by which
researchers, through vigorous literature review,
create a conceptual model to explain a
phenomenon.
– As such, conceptual model or conceptual
scheme consists of a logically related set of
propositions, which are stated relationships
among variables.
– The most difficult part of conceptualization is
how to find a good topic.
29. Research Methodology
Conceptualization
• Sources of Research Ideas
– Literature review in the area of interest
• What is/are the main concept/concepts?
• What are the antecedents and consequences of the
main concept? Can there be any mediator between
the antecedents, the main concept, and the
consequences?
• Is there any conflicting result between studies on
the main concept? Can there be any moderator
affecting the relationships?
• Is there any chance for further research extension?
• Example: Zaichkowsky’s (1986) article on
involvement
32. Research Methodology
Conceptualization
– Literature review of basic social sciences
• What is the main concept from basic social sciences
literature?
• Is the concept applicable to your field of study?
• Example: Paharia and Deshpande’s (2009) working
paper on consumers buying products made from
sweatshop labor based on the concept of “moral
disengagement” by Bundura (1991, 1999).
– Observation of existing phenomena
• What is the nature of the phenomenon observed? Is
it an antecedent of something? Is it a consequence
of something?
33. Research Methodology
Conceptualization
• Is there any existing literature/studies on the
phenomenon in your field? If yes, review literature
thoroughly to see if you can extend existing
knowledge by adding mediator, moderator, etc. If
no, review literature in basic social sciences to find
a proper conceptual framework for studying the
phenomenon.
• Example: Oberholzer-Gee’s (2006) wrote a paper
on the market for time when he observed waiting
lines at the airport.
– Calls for Papers
• Special issues of journals
34. Research Methodology
Conceptualization
• Sample Readings
– Building conceptual models
• Zeithaml, Valarie A. (1988), “Consumer Perceptions of Price,
Quality, and Value: A Means-End Model and Synthesis of
Evidence,” Journal of Marketing, 52 (July), 2-22.
• Moorthy, K. Sridhar (1993), “Theoretical Modeling in
Marketing”, Journal of Marketing, 57 (April), 92-106.
– Solving conflicting results
• Hui, Michael K., Mrugank V. Thakor, and Ravi Gill (1998),
“The Effect of Delay Type and Service Stage on Consumers’
Reactions to Waiting,” Journal of Consumer Research, 24
(March), 469-479.
35. Research Methodology
Conceptualization
• Hui, Michael K., Xiande Zhao, Xiucheng Fan, and Kevin Au
(2004), “When Does the Service Process Matter? A Test of
Two Competing Theories,” Journal of Consumer Research, 31
(September), 465-475.
– Testing mediators and moderators
• Hui, Michael K. and David K. Tse (1996), “What to Tell
Consumers in Waits of Different Lengths: An Integrative
Model of Service Evaluation,” Journal of Marketing, 60
(April), 81-90.
– Reexamination and extension
• Powpaka, Samart (2008), “Empowering Chinese Service
Employees: Reexamination and Extension”, Journal of Global
Marketing, 21 (4), 271-291.
36. Research Methodology
Conceptualization
– Ideas from basic social sciences
• Paharia, Neeru and Rohit Deshpande (2009), “Sweatshop
Labor is Wrong Unless the Jeans are Cute: Motivated Moral
Disengagement”, Working Paper #09-079, Harvard Business
School.
– Ideas from observation
• Oberholzer-Gee, Felix (2006), “A Market for Time: Fairness
and Efficiency in Waiting Lines”, KYKLOS, 59 (3), 427-440.
37. Research Methodology
Conceptualization
• Criteria for Good Research Ideas
– Correspondence with reality
• Good research ideas highly agree with what is
accepted as true.
• Beware of “phantoms” (or invalid accepted truths)
– Coherence and parsimony
• Coherence refers to whether the idea “sticks
together”.
• Parsimony means a research idea should not be any
more complicated than necessary.
– Falsifiabilility
• Good research ideas, if incorrect, can be falsified
by a finite set of observations.
39. Research Methodology
Measurement
• Measurement in Business Research
– The Measurement Process
• In business research, the measurement process
involves using numbers to represent the business
phenomena under investigation.
• The empirical system includes business phenomena
while the abstract system includes the numbers
used to represent the business phenomena.
• Measurement process is concerned with developing
a correspondence between the empirical system
(e.g., preference)and the abstract system (e.g.,
numbers).
40. Research Methodology
Measurement
– Definition of Measurement
• Measurement is defined as the assignment of
numbers to characteristics of objects or events
according to rules.
• The nature of the relationships existing in the
empirical system determines the type of numerical
manipulations permissible.
– Number System Characteristics
• four characteristics (of ratio scales)
– Types of Scales
• There are four types of scales: nominal, ordinal,
interval, and ration scales.
41. Research Methodology
Measurement
• Difficulty of Measurement
– Why is measurement so difficult in business
research?
• Measurement is so difficult in marketing because
the phenomena of interest are typically behavioral
in nature. As such, current measuring devices (e.g.,
questionnaires) are subject to substantial
measurement error.
• Other factors of interest are concepts or constructs
that are not observable. So researchers must first
operationally defined the constructs and then devise
a means by which they can be measured.
42. Research Methodology
Measurement
• Concepts of Validity and Reliability
– Measurement Error
• Measurement error is minimized when a direct
correspondence exists between the number system
and the marketing phenomena being measured.
• In this case (idealized situations), the numbers
accurately represent the characteristics being
measured and nothing else.
• Most measurements possess some degree of error in
that the numerical scale does not exactly represent
the marketing phenomenon under investigation.
• The total error of measurement consists of two
components: systematic error and random error.
43. Research Methodology
Measurement
– Validity and Reliability Defined
• Validity of a measure refers to the extent to which
the measurement process is free from both
systematic and random error.
• Reliability of a measure refers to the extent to
which the measurement process is free from
random errors.
• Validity is concerned with the question: Are we
measuring what we think we are measuring.
Reliability, on the other hand, is concerned with the
consistency, accuracy, and predictability of the
research findings.
• For a measure to be valid, it must be reliable.
44. Research Methodology
Measurement
• Types of Reliability
– Test-retest reliability
• Test-retest reliability refers to the ability of the
same instrument to produce consistent results
when used a second time under conditions as
nearly the same as possible.
• Method: Use the same instrument a second time
under nearly the same conditions as possible.
– Equivalent-form reliability or alternative-form
reliability
• Equivalent form reliability refers to the ability to
produce similar results using two instruments as
similar as possible to measure the same object.
45. Research Methodology
Measurement
• Method: Use two instruments that are as similar as
possible to measure the same object during the same
period of time.
– Internal-consistency reliability
• Internal consistency reliability assesses the ability to
produce the similar results using different samples to
measure a phenomenon during the same period.
– Split-half reliability
• Split-half reliability is a method of assessing the
reliability of a scale by dividing into two the total set
of measurement items and correlating the results.
46. Research Methodology
Measurement
– Cronbach Alpha
• This technique computes the mean reliability
coefficient estimates for all possible ways of
splitting a set of items in half.
• A lack of correlation of an item with other items in
the scale is evidence that the item does not belong
in the scale and should be omitted.
• Types of Validity
– Face validity
• Face validity is concerned with the degree to which
a measurement seems to measure what it is
supposed to measure.
47. Research Methodology
Measurement
• Researchers judge the degree to which a
measurement instrument seems to measure what is
supposed to.
– Content validity
• Content validity refers to the degree to which a
measurement instrument represent the universe of
the concept under study.
• Content validity is the representativeness or
sampling adequacy of the content of the
measurement instrument.
• Content validity is ultimately a judgmental matter.
48. Research Methodology
Measurement
– Criterion-related validity
• Criterion -related validity refers to the degree to
which a measurement instrument can predict a
variable that is designated a criterion.
• Two subcategories of criterion-related validity are
predictive validity and concurrent validity.
• Predictive validity is the extent to which a future
level of a criterion variable can be predicted by a
current measurement (predictor variable) on a scale.
• Concurrent validity is the extent to which a criterion
variable measured at the same point in time as the
variable of interest can be predicted by the
measurement instrument (predictor variable).
49. Research Methodology
Measurement
– Construct validity
• Construct validity is the degree to which a
measurement instrument represents and logically
connects, via the underlying theory, the observed
phenomenon to the construct.
• Two statistical approaches for assessing construct
validity are convergent and discriminant validity.
• Convergent validity is the degree of association
among different measurement instruments that
purport to measure the same concept.
• Discriminant validity is the lack of, or low
correlation among, constructs that are supposed to
be different.
50. Research Methodology
Measurement
• Relevant Literature in Measurement
– Churchill, Gilbert A., Jr. (1979), “A Paradigm for Developing
Better Measures of Marketing Constructs,” Journal of Marketing
Research, 16 (February), 64-73.
– Gerbing, David W. and James C. Anderson (1988), “An Updated
Paradigm for Scale Development and Incorporating
Unidimensionality and Its Assessment,” Journal of Marketing
Research, 25 (May), 186-192.
– Fornell, Claes and David F. Larcker (1981), “Evaluating Structural
Equation Models with Unobserved Variables and Measurement
Error,” Journal of Marketing Research, 18 (February), 39-50.
53. Research Methodology
Scale Development & Validation
• Steps in Scale Development & Validation
(Churchill 1979)
– Step 1: Specify domain of the construct
• Conduct literature review to determining exactly
what is included and what is excluded in the
definition of the construct.
– Step 2: Generate sample of items
• Use literature review and qualitative research (e.g.,
depth interview, focus group interview) techniques
to generate items that capture the domain (i.e.,
dimensions of the construct) as specified in Step 1.
54. Research Methodology
Scale Development & Validation
– Step 3: Purify the measure
• After the item pool in Step 2 is carefully edited,
actual data are collected to purify the items.
• The collected data are analyzed by (exploratory)
factor analysis to determine the number of
dimensions and to identify inappropriate items and
by coefficient alpha to determine reliability and to
identify inappropriate items.
– Step 4: Assess reliability with new data
• Step 3 should result in face and content validity.
• After inappropriate items are deleted, data are
collected for the purified items.
55. Research Methodology
Scale Development & Validation
• Coefficient alpha or Cronbach alpha (Cronbach
1951) is the basic statistic for determining the
reliability of a measure based on internal
consistency.
• Other tests of reliability except test-retest reliability
can also be used.
– Step 5: Assess construct validity
• A new set of data is collected to establish the
construct validity (convergent and discriminant
validity) and the criterion-related validity
(concurrent validity and predictive validity) of the
construct.
– Step 6: Developing norms
• Establish the mean and SD and other statistics.
56. Research Methodology
Scale Development & Validation
• An Updated Paradigm for Scale
Development (Gerbing and Anderson 1988)
– Gerbing and Anderson’s (1988) paradigm
supplements Churchill’s (1979) paradigm by
adding confirmatory factor analysis (CFA) into
the scale development and validation process.
– Steps in assessing the unidimensionality of the
scale: exploratory factor analysis (EFA)
coefficient alpha and reliability confirmatory
factor analysis (CFA)
57. Research Methodology
Scale Development & Validation
• Assessing Construct Validity of a
Construct by SEM (Fornell and Larcker
1981)
– Step 1: Determine if the measures have
satisfactory psychometric properties (i.e.,
reliability, averaged variance extracted, and
discriminant validity).
– Step 2: Examine the chi square value and
determine its statistical significance (i.e., the
overall fit of the model).
58. Research Methodology
Scale Development & Validation
• Relevant Literature in Scale
Development & Validation
– Churchill, Gilbert A., Jr. (1979), “A Paradigm for Developing
Better Measures of Marketing Constructs,” Journal of Marketing
Research, 16 (February), 64-73.
– Gerbing, David W. and James C. Anderson (1988), “An Updated
Paradigm for Scale Development and Incorporating
Unidimensionality and Its Assessment,” Journal of Marketing
Research, 25 (May), 186-192.
– Fornell, Claes and David F. Larcker (1981), “Evaluating Structural
Equation Models with Unobserved Variables and Measurement
Error,” Journal of Marketing Research, 18 (February), 39-50.
59. Research Methodology
Scale Development & Validation
• Sample Readings
– Richins, Marsha L. and Scott Dawson (1992), “A Consumer
Values Orientation for Materialism and Its Measurement: Scale
Development and Validation,” Journal of Consumer Research, 19
(December), 303-316.
– Tian, Kelly Tepper, William O Bearden, and Gary L. Hunter
(2001), “Consumers’ Need for Uniqueness: Scale Development
and Validation,” Journal of Consumer Research, 28 (June), 50-66.
– Bearden, William O., David M. Hardesty, and Randall L. Rose
(2001), “Consumer Self-Confidence: Refinements in
Conceptualization and Measurement,” Journal of Consumer
Research, 28 (June), 121-134.
– Li, Hairong, Steven M. Edwards, and Joo-Hyun Lee (2002),
“Measuring the Intrusiveness of Advertisements: Scale
Development and Validation,” Journal of Advertising, 31 (2),
37-47.
61. Research Methodology
Surveys
• Definition
– Survey research is the use of a questionnaire to
gather facts, opinions, and attitudes. It is the
most popular way to gather primary data.
– Sample surveys are correlational studies. So
survey research can establish if constructs have
relationships but cannot establish cause-and-
effect relationships.
• Characteristics of a Good Survey
Research
– A good survey is one with minimal errors.
63. Research Methodology
Surveys
• Types of Errors in Survey Research:
– Errors in survey research include random error
(or random sampling error) and systematic
errors.
– Random error - error that results from chance
variation
– Systematic errors - error that results from the
research design (sample design error) or
execution (measurement error)
– Sample design error includes:
• Frame error - error resulting from an inaccurate or
incomplete sample frame
64. Research Methodology
Surveys
• Population specification error - error resulting from
an incorrect definition of the universe, or
population, from which the sample is chosen
• Selection error - error that results from following
incomplete or improper sampling procedures or not
following proper ones
– Measurement error includes:
• Measurement error - error that results from a
variation between the information being sought and
that actually obtained by the measurement process
• Surrogate information error - error that results from
a discrepancy between the information needed to
solve a problem and that sought by the researcher
65. Research Methodology
Surveys
• Interviewer error - error that results from conscious
or unconscious bias in the interviewer’s interaction
with the respondent
• Measurement instrument bias - error that results
from the design of the questionnaire or
measurement instrument
• Processing error - error that results from incorrect
transfer of information from the document to the
computer
• Response errors consist of nonresponse bias and
response bias
– Nonresponse bias - error that results from a systematic
difference between those who do and do not respond to
the measurement instrument
66. Research Methodology
Surveys
– Response bias - error that results from the tendency of
people to answer a question falsely, through deliberate
misrepresentation or unconscious falsification
• Types of Surveys
– Face-to-face
– Telephone interview
– Direct computer interview
– Self-administered questionnaires
– Mail surveys
– Online surveys
67. Research Methodology
Surveys
• Important Issues in Survey Research
– Data Analysis
• Structural equation modeling tends to be used to
analyze the data of survey research when the
constructs are measured by multiple items.
• In this case, pay attention to the reliability and the
construct validity (convergent and discriminant
validity) of the constructs used in the model.
– Reliability—Cronbach alpha is higher than 0.7 (Nunnally
1978)
– Convergent validity—the proportion-of-variance-
extracted index (POVEI) for each construct must be at
least 0.5
– Discriminant validity—the square of the correlation
between a pair of construct is lower than the POVEI of
both of the constructs in the pair
68. Research Methodology
Surveys
• Example: How Market Orientation Affect Female
Service Employees in Thailand (Powpaka 2006)
71. Research Methodology
Surveys
• Sample Readings
– Hartline, Michael D. and O. C. Ferrell (1996), “The Management
of Customer-Contacted Service Employees: An Empirical
Investigation,” Journal of Marketing, 60 (October), 52-70.
– Klein, Jill Gabrielle, Richard Ettenson, and Marlene D. Morris
(1998), “The Animosity Model of Foreign Product Purchase: An
Empirical Test in the People’s Republic of China,” Journal of
Marketing, 62 (January), 89-100.
– MacKenzie, Scott B., Richard J. Lutz, and George E. Belch
(1986), “The Role of Attitude Toward the Ad as a Mediator of
Advertising Effectiveness: A Test of Competing Explanations,”
Journal of Marketing Research, 23 (May), 130-143.
73. Research Methodology
Experiments
• What Is an Experiment?
– An experiment is a research approach in which
one or more variable is manipulated and the
effect on another variable(s) observed.
– Experiments are partitioned studies.
– Experimental research is often referred to as
causal research.
• It is called causal research because it is the only type
of research that has the potential to demonstrate
causation or cause-and-effect relationship between
two or more variables.
74. Research Methodology
Experiments
• To demonstrate causation, that A likely caused B,
we must be able to show three things: (1)
concomitant variation, (2) appropriate time order of
occurrence, and (3) elimination of other possible
causal factors.
• Experimental Validity
– Internal and external validity
• Validity of a measure refers to the degree to which
the measure is free from both systematic and
random error.
• In addition to the general concept of validity, in
experimentation, there are two specific kinds of
validity: internal validity and external validity.
75. Research Methodology
Experiments
• Internal validity is the extent to which competing
explanations for the experimental results observed
can be avoided.
• External validity is the extent to which causal
relationships measured in an experiment can be
generalized to outside persons, settings, and times.
– Extraneous variables: threats to experimental
validity
• History refers to any variable or event other than
those manipulated that takes place between the
beginning and end of the experiment and that might
affect the value of the dependent variable.
76. Research Methodology
Experiments
• Maturation refers to changes in subjects that take
place during the experiment that are not related to
the experiment but may affect their response to the
experimental factor.
• Instrument variation refers to any differences or
changes in measurement instruments (e.g.,
interviewers or observers) that explain differences in
measurements.
• Selection bias refers to systematic differences
between the experimental group and control group
because of a biased selection process.
• Mortality refers to the loss of test units or subjects
during the course of an experiment.
77. Research Methodology
Experiments
• Testing effect is an effect that is a by-product of the
research process and not the experimental variable.
• Regression to the mean refers to the tendency for
behavior of subjects to move toward the average for
that behavior during the course of an experiment.
• Experimentation: Summary of Basic
Concepts
– Experimental design and treatment
• Experimental design is a test in which the researcher
has control over one or more independent variables
and manipulates them.
• Treatment is the independent variable that is
manipulated.
78. Research Methodology
Experiments
• Manipulation refers to the process in which the
researcher sets the levels of the independent variable
to test a particular causal relationship.
– Experimental effects
• Experimental effect is the effect of the treatment
variable on the dependent variable.
– Control of other (extraneous) causal factors
• Extraneous causal factors are also referred to as
confounding variables.
• Four basic approaches are used to control
extraneous factors: (1) randomization, (2) physical
control (e.g., matching, mode K), (3) design control,
and (4) statistical control (e.g., ANCOVA).
79. Research Methodology
Experiments
• Types of Experimental Design
– Three pre-experimental designs
• One-shot case study
• One-group pretest-posttest design
• Static-group comparison
– Three true experimental designs
• Posttest-only control group design
• Pretest-posttest control group design
• Solomon Four-Group design
80. Research Methodology
Experiments
– Quasi-experimental designs
• Interrupted time-series design
• Multiple time-series design
• Nonequivalent control group design
• See more designs in Cook and Campbell’s (1979)
Quasi-Experimentations
• The Experimental Setting—Laboratory
or Field Experiments?
• Laboratory experiments are experiments conducted
in a controlled setting.
• Field experiments are tests conducted in an actual
market environment.
81. Research Methodology
Experiments
• Issues in Experiments
– Manipulation of the independent variables
• Realistic
– Manipulation checks
• Need manipulation-check variables
• Successful manipulation means:
– The means of the manipulation-check variable of an
independent variable under different conditions are
significantly different as required
– No confounding effect
– The effects of the interaction between the independent
variables on manipulation-check variables are not
significant
82. Research Methodology
Experiments
– Measurement
• The dependent variables are measureable (or
metric).
• Pay attention to the construct validity (convergent
and discriminant validity) of the dependent
variables.
– Data Analysis
• ANOVA/MANCOVA
• ANCOVA/MANCOVA
• ANOVA/MANCOVA/ANCOVA/MANCOVA by
structural equation model (Bagozzi and Yi 1989)
83. Research Methodology
Experiments
– Results and Interpretation
• Main Effects—the effect of each of the independent
variable on the dependent variable(s)
• Interaction Effects—the effect of an independent
variable on the dependent varible(s) depends on the
level of another dependent variable
• Types of interaction effect
– Disordinal interaction
– Ordinal interaction
84. Research Methodology
Experiments
• Example: Hui et al’s (2004) Study 3 on
Empowerment Across Culture
87. Research Methodology
Experiments
• Manipulation checks: Pilot studies
– Manipulation-check variables
• Power distance for nation (Pilot Study 1)
• Perceived discretionary power for empowerment
(Pilot Study 2)
• Perceived good reason for request for request nature
(Pilot Study 2)
– Note
• The authors only test if the means of the
manipulation-check variable are significantly
different between different conditions as required.
There are no confounding and interaction tests.
88. Research Methodology
Experiments
• Sample Readings
– Hui, Michael K. and David K. Tse (1996), “What to Tell
Consumers in Waits of Different Lengths: An Integrative Model
of Service Evaluation,” Journal of Marketing, 60 (April), 81-90.
(Read only Introduction and Literature Review)
– Hui, Michael K., Mrugank V. Thakor, and Ravi Gill (1998), “The
Effect of Delay Type and Service Stage on Consumers’ Reactions
to Waiting,” Journal of Consumer Research, 24 (March), 469-479.
(Read only Introduction and Literature Review)
– Hui, Michael K., Xiande Zhao, Xiucheng Fan, and Kevin Au
(2004), “When Does the Service Process Matter? A Test of Two
Competing Theories,” Journal of Consumer Research, 31
(September), 465-475. (Read only Introduction and Literature
Review)
90. Research Methodology
Multivariate Data Analysis
• Types of Multivariate Techniques
– Dependence Techniques
• Multiple regression analysis
• Canonical correlation
• Multivariate analysis of variance and
Covariance
• Discriminant analysis
• Conjoint analysis
• Structural equation modeling
91. Research Methodology
Multivariate Data Analysis
• Types of Multivariate Techniques
– Interdependence Techniques
• Factor analysis
• Cluster analysis
• Multidimensional scaling
• Correspondence analysis
92. Research Methodology
Multivariate Data Analysis
• Multiple Regression
– Multiple regression is appropriate when
there is a single metric dependent
variable and two or more metric
dependent variable.
– The objective of multiple regression is to
predict the change in the dependent
variable in response to changes in the
independent variables.
93. Research Methodology
Multivariate Data Analysis
• Canonical Correlation
– Canonical correlation can be viewed as a
logical extension of multiple regression
analysis.
– Canonical correlation correlates
simultaneously two or more metric
dependent variables and two or more
metric independent variables.
94. Research Methodology
Multivariate Data Analysis
• Multivariate Analysis of Variance
and Covariance
– MANOVA is a statistical technique for
simultaneously explore the relationship
between two or more metric dependent
variables and one or more categorical
variables.
– MANCOVA removes the effect of
“covariates” on the dependent variables.
95. Research Methodology
Multivariate Data Analysis
• Multiple Discriminant Analysis
– Multiple discriminant analysis is
appropriate when there is a single
categorical dependent variable and two or
more metric independent variables.
– The objective of MDA is to understand
group differences and to predict the
membership of an entity (individual or
object).
96. Research Methodology
Multivariate Data Analysis
• Conjoint Analysis
– Conjoint analysis is appropriate when
there is a single ordinal dependent
variable and two or more categorical
variables.
– Conjoint analysis provides “utilities” (or
relative importance) for each level of
each categorical variable.
97. Research Methodology
Multivariate Data Analysis
• Structural Equation Modeling
– Structural equation modeling
simultaneously analyzes a set of simple
and multiple regression functions.
– Structural equation modeling consists of
(1) the structural model and (2) the
measurement model.
– The structural model represents the
relationship among the latent variables.
98. Research Methodology
Multivariate Data Analysis
– The measurement model represent the
relationships between the observed
variables (or “indicators”) and the latent
variables.
– LISREL is one of the most popular
software package for structural equation
modeling. Other popular software
packages include AMOS (by SPSS) and
EQS.
99. Research Methodology
Multivariate Data Analysis
• Factor Analysis
– Factor analysis, including principal
component analysis and common factor
analysis, is a statistical technique to
analyze interrelationships among a large
number of metric variables and to explain
these variables in terms of their common
underlying dimensions (or factors).
100. Research Methodology
Multivariate Data Analysis
• Cluster Analysis
– Cluster analysis is an analytical technique
for developing meaningful subgroups of
individuals or objects based on the
similarities among the entities.
– Cluster analysis groups individuals or
objects into groups (or “clusters) based
on metric variables while factor analysis
groups metric variables into factors.
101. Research Methodology
Multivariate Data Analysis
• Multidimensional Scaling
– Multidimensional scaling transforms
similarity/dissimilarity scores of pairs of
objects into distances represented in
multidimensional space.
– The resulting perceptual maps show the
relative positions of all objects. The
more similar a pair of objects are, the
closer the two objects are.
102. Research Methodology
Multivariate Data Analysis
• Correspondence Analysis
– Correspondence analysis facilitates both
dimensional reduction of object ratings
on a set of attributes and the perceptual
mapping of objects relative to these
attributes.
– In most basic form, correspondence
analysis employs a contingency table
(cross-tabulation of two categorical
variables)
104. SEM by LISREL
• What is Structural Equation Modeling?
– SEM is a multivariate technique combining
aspects of factor analysis and multiple
regression that allows an investigation of the
structure of relationships among the observed
variables and latent variables and those among
the latent variables.
– SEM models consist of the measurement model
(representing the relationships between each
latent variable and its observed variables) and
the structural model (representing the
relationships among the latent variables).
105. SEM by LISREL
– The measurement model of an SEM model
must be acceptable before the result of the
structural model can be interpreted.
– In a good measurement model, each construct
must have (1) high reliability (Cronbach α >
0.7), (2) construct validity (convergent validity
and discriminant validity), and (3) acceptable
overall model fit (e.g., relative fit indices >
0.90).
– Widely used SEM programs include LISREL,
EQS, and AMOS.
106. SEM by LISREL
• The Objective of Using SEM
– Confirmatory Factor Analysis (or CFA)
– Strictly Confirmatory (or SC) Situation
– Alternative Model (or AM) Situation
– Model Generation (or MG) Situation
– Testing Equality of Coefficients
– Path Analysis
• Type of SEM Analysis
– Single-Group SEM
– Multiple-Group SEM
– MANOVA by SEM
107. SEM by LISREL
• Steps in Using LISREL
– Step 1: Save the SPSS data set (.sav) into the
tab-delimited data set (.dat)
– Step 2: Write a PRELIS 2 command file (.pr2)
to analyze the tab-delimited data set (.dat) in
order to obtain the appropriate moment matrix
(.cov) for further analysis by LISREL 8.
– Step 3: Write a LISREL 8 command file (.ls8)
to analyze the matrix (.cov) in order to obtain
the results (i.e., the measurement model and
structural model).
108. SEM by LISREL
• Saving Data File from SPSS Data Set
– Step 1: In the SPSS data file, click “File” and
then click “Save As”. The “Save Data As”
window will be opened.
– Step 2: Change “Save as type” from “SPSS
(*.sav)” to “Tab-delimited (*.dat)”.
– Step 3: Type your file name into the box of
“File name”.
– Step 4: Uncheck the box of “Write variable
names to spread sheet”.
– Step 5: Click “Save”.
109.
110. SEM by LISREL
• How to Write PRELIS Command File
– Title line: Title of the research project
– Data line: DA NI=n MI=m (n is the number of
observed variables and m is the number
representing the missing value)
– Label line: LA (followed by the list of observed
variables in the next line)
– Raw data line: RA=location of data (.dat) file
– Continuous variables line: CO (followed by list
of variables or ALL)
111. SEM by LISREL
– Selective delete line (option line): SD (followed
by the list of variables to be deleted from the
analysis)
– Select case line (option line): SC (followed by
the variable and the value selected for the
analysis)
– Output line: OU MA=CM SM=location for
saving the covariance matrix (.cov)
112.
113. SEM by LISREL
• How to Write LISREL Command Files
– Title line: Title of the research project
– Observed variables line: Observed variables:
(followed by the list of observed variables)
– Covariance matrix from file line: Covariance
matrix from file (followed by the location of
the .cov file from PRELIS)
– Sample size line: Sample size n (n is the size of
the sample or subjects)
114. SEM by LISREL
– Latent variables line: Latent variables:
(followed by the list of latent variables)
– Relationships line: Relationships: (followed by
the measurement model and then the structural
model in the next lines)
– Path diagram line: Path diagram
– Admissibility check line: Admissibility=off
– End of problem line: End of problem
117. Research Methodology
Conclusion
• Advice from Former Editors of Journal
of Marketing
– Varadarajan, P. Rajan (1996), “From Editor: Reflections
on Research and Publishing,” Journal of Marketing, 60
(October), 3-6.
– Stewart, David W. (2002), “Getting Published:
Reflections for an Old Editor,” Journal of Marketing, 66
(October), 1-6.