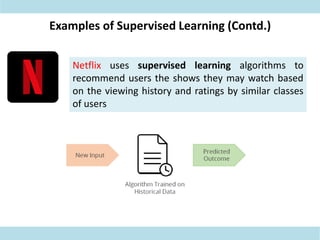
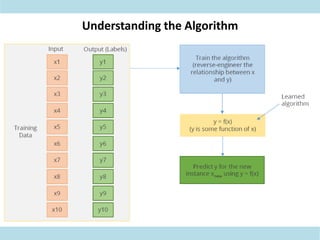
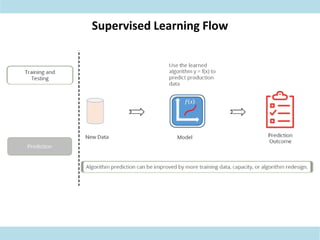
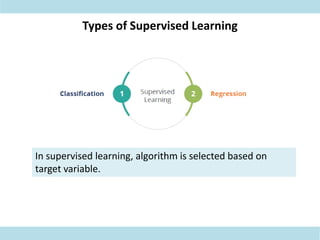
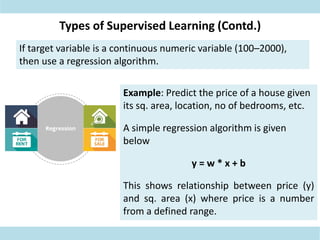
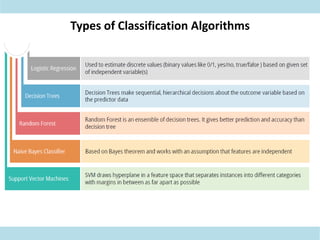
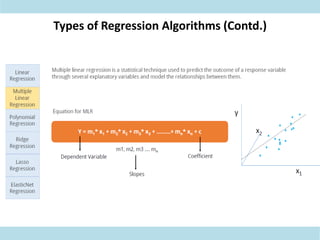
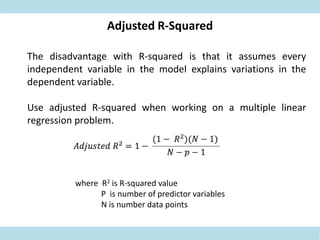
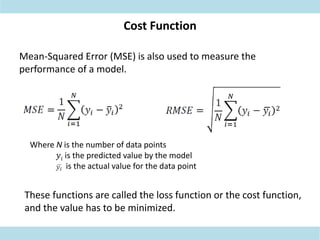
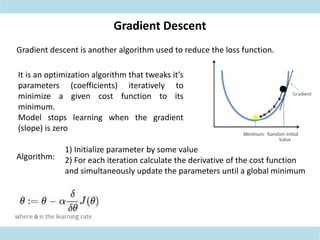
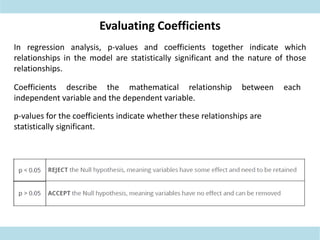
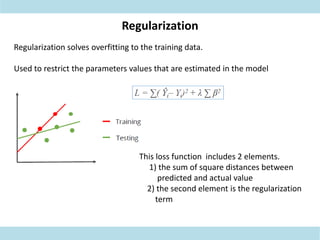
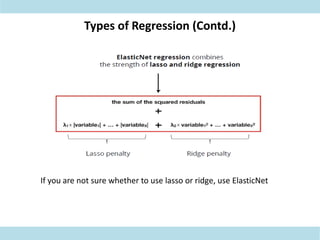
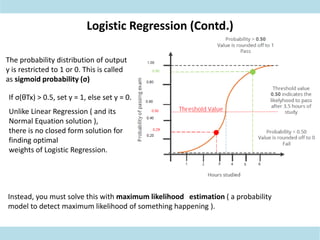
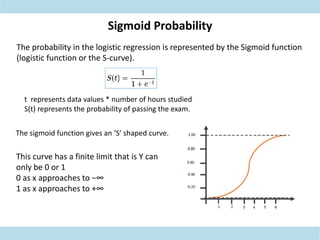
Fundamentals of Artificial Intelligence and
Machine Learning
Lecture 3: Supervised Learning
What is Supervised Learning?
Supervised Learning is a type of machine learning used to train
models from labeled training data.
It allows you to predict output for future or unseen data.
Examples of Supervised Learning
Example 1: Weather Apps
The predictions made by
weather apps at a given time are
based on prior knowledge and
analysis of weather over a
period of time for a particular
place.
Examples of Supervised Learning (Contd.)
Example 2: Gmail Filters
Gmail filters, a new email
into Inbox (normal) or
Junk folder (Spam) based
on past information of
spam.
Examples of Supervised Learning (Contd.)
Netflix uses supervised learning algorithms to
recommend users the shows they may watch based
on the viewing history and ratings by similar classes
of users
Understanding the Algorithm
Supervised Learning Flow
Types of Supervised Learning
In supervised learning, algorithm is selected based on
target variable.
Types of Supervised Learning (Contd.)
If target variable is categorical (classes), then use classification
algorithm.
In other words, classification is applied when
the output has finite and discreet values.
Example: Predict the class of car given its
features like horsepower, mileage, weight,
color, etc.
The classifier will build its attributes based on
these features. Analysis has three potential
outcomes -Sedan, SUV, or Hatchback
Types of Supervised Learning (Contd.)
Example: Predict the price of a house given
its sq. area, location, no of bedrooms, etc.
A simple regression algorithm is given
below
y = w * x + b
This shows relationship between price (y)
and sq. area (x) where price is a number
from a defined range.
If target variable is a continuous numeric variable (100–2000),
then use a regression algorithm.
Types of Supervised Learning (Contd.)
Types of Classification Algorithms
Types of regression algorithms
Types of Regression Algorithms
Types of Regression Algorithms (Contd.)
Regression Use Case
Predicting profit based on expenditures of the company
Accuracy Metrics
R-square is the most common metric to judge
the performance of regression models
Example: Performing linear regression on sq. Area (x) and Price (y) returns R-square
value as 16. This means you have 16% information to make an accurate prediction about
the price.
Adjusted R-Squared
The disadvantage with R-squared is that it assumes every
independent variable in the model explains variations in the
dependent variable.
Use adjusted R-squared when working on a multiple linear
regression problem.
where R2 is R-squared value
P is number of predictor variables
N is number data points
Cost Function
Mean-Squared Error (MSE) is also used to measure the
performance of a model.
Where N is the number of data points
𝑦𝑖 is the predicted value by the model
is the actual value for the data point
These functions are called the loss function or the cost function,
and the value has to be minimized.
Gradient Descent
Gradient descent is another algorithm used to reduce the loss function.
It is an optimization algorithm that tweaks it’s
parameters (coefficients) iteratively to
minimize a given cost function to its
minimum.
Model stops learning when the gradient
(slope) is zero
Algorithm:
1) Initialize parameter by some value
2) For each iteration calculate the derivative of the cost function
and simultaneously update the parameters until a global minimum
Evaluating Coefficients
In regression analysis, p-values and coefficients together indicate which
relationships in the model are statistically significant and the nature of those
relationships.
Coefficients describe the mathematical relationship between each
independent variable and the dependent variable.
p-values for the coefficients indicate whether these relationships are
statistically significant.
Challenges in Prediction
If the model learning is poor, you have an underfitted situation
The algorithm will not work well on test data Retraining may be needed to
find a better fit
Overfitting happens when model accuracy for training data is good, but
model does not generalize well to the overall population
Algorithm is not able to give good predictions for the new data
Regularization
Regularization solves overfitting to the training data.
Used to restrict the parameters values that are estimated in the model
This loss function includes 2 elements.
1) the sum of square distances between
predicted and actual value
2) the second element is the regularization
term
Types of Regression (Contd.)
Ridge Regression (L2) is used when there is a problem of
multicollinearity.
By adding a degree of bias to the regression estimates, ridge
regression reduces the standard errors.
The main idea is to find a new line that has
some bias with respect to the training data
In return for that small amount of bias, a
significant drop in variance is achieved
Minimization objective = LS Obj + λ * (sum of the square of coefficients)
LS Obj refers to least squares objective
λ controls the strength of the penalty term
Types of Regression (Contd.)
Lasso Regression (L1) is similar to ridge, but it also performs feature
selection.
It will set the coefficient value for features that do not help in decision
making very low, potentially zero.
Minimization objective = LS Obj + λ * (sum of absolute coefficient values)
Lasso regression tends to exclude variables that are not required
from the equation, whereas ridge tends to do better when all
variables are present.
Types of Regression (Contd.)
If you are not sure whether to use lasso or ridge, use ElasticNet
Logistic Regression
Logistic Regression is widely used to predict binary out comes for a given
set of independent variables.
The dependent variable’s outcome is discrete such as y ϵ{0, 1}
A binary dependent variable can have only two values such as 0 or 1, win or
lose, pass or fail, healthy or sick.
Real-Life Scenarios
Logistic Regression (Contd.)
The probability distribution of output
y is restricted to 1 or 0. This is called
as sigmoid probability (σ)
If σ(θTx) > 0.5, set y = 1, else set y = 0.
Unlike Linear Regression ( and its
Normal Equation solution ),
there is no closed form solution for
finding optimal
weights of Logistic Regression.
Instead, you must solve this with maximum likelihood estimation ( a probability
model to detect maximum likelihood of something happening ).
Logistic Regression Equation
The Logistic regression equation is derived from the straight line equation:
Sigmoid Probability
The probability in the logistic regression is represented by the Sigmoid function
(logistic function or the S-curve).
t represents data values * number of hours studied
S(t) represents the probability of passing the exam.
The sigmoid function gives an ‘S’ shaped curve.
This curve has a finite limit that is Y can
only be 0 or 1
0 as x approaches to −∞
1 as x approaches to +∞
Accuracy Metrics
Accuracy Metrics (Contd.)

Supervised Learning.pdf

  • 1.
    Fundamentals of ArtificialIntelligence and Machine Learning Lecture 3: Supervised Learning
  • 2.
    What is SupervisedLearning? Supervised Learning is a type of machine learning used to train models from labeled training data. It allows you to predict output for future or unseen data.
  • 3.
    Examples of SupervisedLearning Example 1: Weather Apps The predictions made by weather apps at a given time are based on prior knowledge and analysis of weather over a period of time for a particular place.
  • 4.
    Examples of SupervisedLearning (Contd.) Example 2: Gmail Filters Gmail filters, a new email into Inbox (normal) or Junk folder (Spam) based on past information of spam.
  • 5.
    Examples of SupervisedLearning (Contd.) Netflix uses supervised learning algorithms to recommend users the shows they may watch based on the viewing history and ratings by similar classes of users
  • 6.
  • 7.
  • 8.
  • 9.
    Types of SupervisedLearning In supervised learning, algorithm is selected based on target variable.
  • 10.
    Types of SupervisedLearning (Contd.) If target variable is categorical (classes), then use classification algorithm. In other words, classification is applied when the output has finite and discreet values. Example: Predict the class of car given its features like horsepower, mileage, weight, color, etc. The classifier will build its attributes based on these features. Analysis has three potential outcomes -Sedan, SUV, or Hatchback
  • 11.
    Types of SupervisedLearning (Contd.) Example: Predict the price of a house given its sq. area, location, no of bedrooms, etc. A simple regression algorithm is given below y = w * x + b This shows relationship between price (y) and sq. area (x) where price is a number from a defined range. If target variable is a continuous numeric variable (100–2000), then use a regression algorithm.
  • 12.
    Types of SupervisedLearning (Contd.)
  • 13.
  • 14.
  • 15.
  • 16.
    Types of RegressionAlgorithms (Contd.)
  • 17.
    Types of RegressionAlgorithms (Contd.)
  • 18.
    Regression Use Case Predictingprofit based on expenditures of the company
  • 19.
    Accuracy Metrics R-square isthe most common metric to judge the performance of regression models Example: Performing linear regression on sq. Area (x) and Price (y) returns R-square value as 16. This means you have 16% information to make an accurate prediction about the price.
  • 20.
    Adjusted R-Squared The disadvantagewith R-squared is that it assumes every independent variable in the model explains variations in the dependent variable. Use adjusted R-squared when working on a multiple linear regression problem. where R2 is R-squared value P is number of predictor variables N is number data points
  • 21.
    Cost Function Mean-Squared Error(MSE) is also used to measure the performance of a model. Where N is the number of data points 𝑦𝑖 is the predicted value by the model is the actual value for the data point These functions are called the loss function or the cost function, and the value has to be minimized.
  • 22.
    Gradient Descent Gradient descentis another algorithm used to reduce the loss function. It is an optimization algorithm that tweaks it’s parameters (coefficients) iteratively to minimize a given cost function to its minimum. Model stops learning when the gradient (slope) is zero Algorithm: 1) Initialize parameter by some value 2) For each iteration calculate the derivative of the cost function and simultaneously update the parameters until a global minimum
  • 23.
    Evaluating Coefficients In regressionanalysis, p-values and coefficients together indicate which relationships in the model are statistically significant and the nature of those relationships. Coefficients describe the mathematical relationship between each independent variable and the dependent variable. p-values for the coefficients indicate whether these relationships are statistically significant.
  • 24.
    Challenges in Prediction Ifthe model learning is poor, you have an underfitted situation The algorithm will not work well on test data Retraining may be needed to find a better fit Overfitting happens when model accuracy for training data is good, but model does not generalize well to the overall population Algorithm is not able to give good predictions for the new data
  • 25.
    Regularization Regularization solves overfittingto the training data. Used to restrict the parameters values that are estimated in the model This loss function includes 2 elements. 1) the sum of square distances between predicted and actual value 2) the second element is the regularization term
  • 26.
    Types of Regression(Contd.) Ridge Regression (L2) is used when there is a problem of multicollinearity. By adding a degree of bias to the regression estimates, ridge regression reduces the standard errors. The main idea is to find a new line that has some bias with respect to the training data In return for that small amount of bias, a significant drop in variance is achieved Minimization objective = LS Obj + λ * (sum of the square of coefficients) LS Obj refers to least squares objective λ controls the strength of the penalty term
  • 27.
    Types of Regression(Contd.) Lasso Regression (L1) is similar to ridge, but it also performs feature selection. It will set the coefficient value for features that do not help in decision making very low, potentially zero. Minimization objective = LS Obj + λ * (sum of absolute coefficient values) Lasso regression tends to exclude variables that are not required from the equation, whereas ridge tends to do better when all variables are present.
  • 28.
    Types of Regression(Contd.) If you are not sure whether to use lasso or ridge, use ElasticNet
  • 29.
    Logistic Regression Logistic Regressionis widely used to predict binary out comes for a given set of independent variables. The dependent variable’s outcome is discrete such as y ϵ{0, 1} A binary dependent variable can have only two values such as 0 or 1, win or lose, pass or fail, healthy or sick.
  • 30.
  • 31.
    Logistic Regression (Contd.) Theprobability distribution of output y is restricted to 1 or 0. This is called as sigmoid probability (σ) If σ(θTx) > 0.5, set y = 1, else set y = 0. Unlike Linear Regression ( and its Normal Equation solution ), there is no closed form solution for finding optimal weights of Logistic Regression. Instead, you must solve this with maximum likelihood estimation ( a probability model to detect maximum likelihood of something happening ).
  • 32.
    Logistic Regression Equation TheLogistic regression equation is derived from the straight line equation:
  • 33.
    Sigmoid Probability The probabilityin the logistic regression is represented by the Sigmoid function (logistic function or the S-curve). t represents data values * number of hours studied S(t) represents the probability of passing the exam. The sigmoid function gives an ‘S’ shaped curve. This curve has a finite limit that is Y can only be 0 or 1 0 as x approaches to −∞ 1 as x approaches to +∞
  • 34.
  • 35.