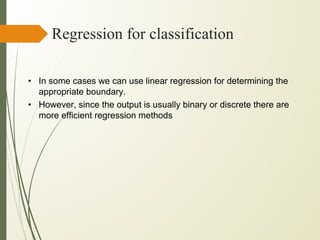
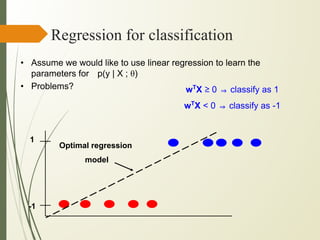
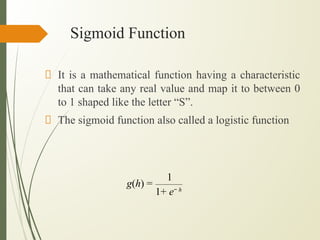
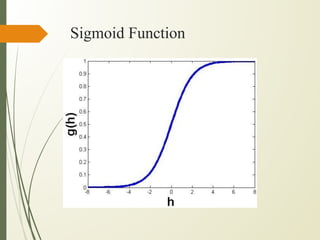
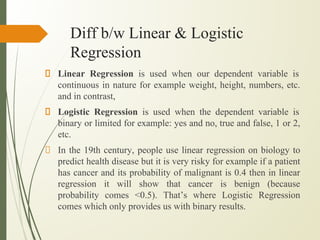
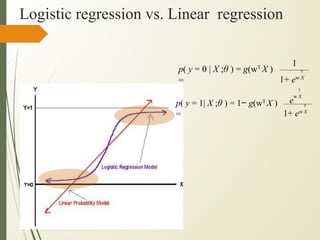
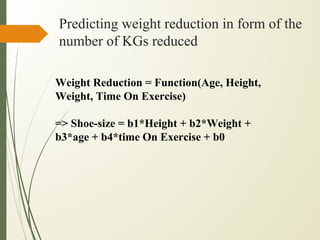
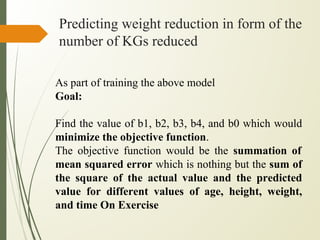
This document discusses machine learning algorithms for classification problems, specifically logistic regression. It explains that logistic regression predicts the probability of a binary outcome using a sigmoid function. Unlike linear regression, which is used for continuous outputs, logistic regression is used for classification problems where the output is discrete/categorical. It describes how logistic regression learns model parameters through gradient descent optimization of a likelihood function to minimize error. Regularization techniques can also be used to address overfitting issues that may arise from limited training data.


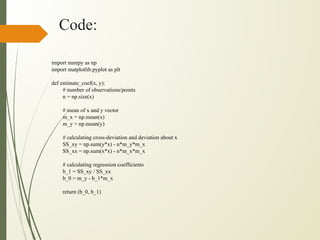
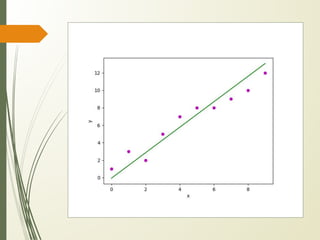
![def plot_regression_line(x, y, b):
# plotting the actual points as scatter plot
plt.scatter(x, y, color = "m",
marker = "o", s = 30)
# predicted response vector
y_pred = b[0] + b[1]*x
# plotting the regression line
plt.plot(x, y_pred, color = "g")
# putting labels
plt.xlabel('x')
plt.ylabel('y')
# function to show plot
plt.show()
def main():
# observations / data
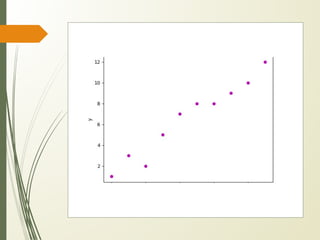
x = np.array([0, 1, 2, 3, 4, 5, 6, 7, 8, 9])
y = np.array([1, 3, 2, 5, 7, 8, 8, 9, 10, 12])
# estimating coefficients
b = estimate_coef(x, y)
print("Estimated coefficients:nb_0 = {}
nb_1 = {}".format(b[0], b[1]))
# plotting regression line
plot_regression_line(x, y, b)
if __name__ == "__main__":
main()](https://image.slidesharecdn.com/3ml-230614160919-f5b88996/85/3ml-pdf-24-320.jpg)