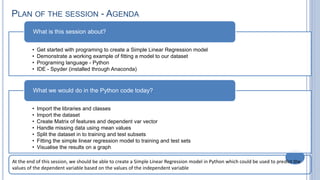
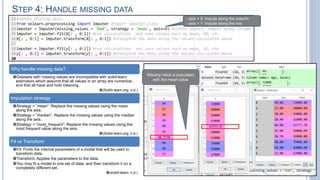
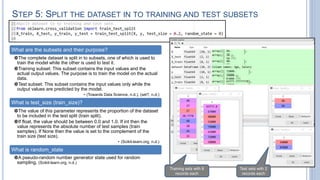
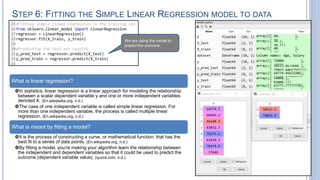
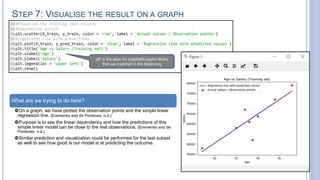
MACHINE LEARNING
Fitting a Simple Linear Regression model in Python
Siddharth Shrivastava
• Get started with programing to create a Simple Linear Regression model
• Demonstrate a working example of fitting a model to our dataset
• Programing language - Python
• IDE - Spyder (installed through Anaconda)
What is this session about?
• Import the libraries and classes
• Import the dataset
• Create Matrix of features and dependent var vector
• Handle missing data using mean values
• Split the dataset in to training and test subsets
• Fitting the simple linear regression model to training and test sets
• Visualise the results on a graph
What we would do in the Python code today?
At the end of this session, we should be able to create a Simple Linear Regression model in Python which could be used to predict the
values of the dependent variable based on the values of the independent variable
PLAN OF THE SESSION - AGENDA
Used to import and manage dataset
Open source library
Provides high-performance and easy-to-use data analysis tools for Python
(Pandas.pydata.org, n.d.)
Pandas data analysis lib
Used to plot graph for visualisation
Various states are preserved across function calls, so the plotting functions are
directed to the current axes (part of fig.)
(Matplotlib.org, n.d.)
Matplotlib.pyplot
The Imputer class provides basic strategies for handling the missing values – either
using mean, median or most frequent value in the row or column.
(Scikit-learn.org, n.d.)
sklearn.preprocessing.Imputer
Used to split arrays or matrices into random train and test subsets.
(Scikit-learn.org, n.d.)
sklearn.cross_validation.train_test_split
Used to model a linear relationship between a dependent variable and one or more
independent variables.sklearn.linear_model.LinearRegression
Code snippet
Console
STEP 1: IMPORT THE LIBRARIES AND CLASSES
Code snippet
Data in CSV file Imported dataset
Notice that the imported dataset has the value ‘nan’ in the cells that were blank in the datasheet. These cells would later be modified as
part of handling the missing data.
STEP 2: IMPORT THE DATASET
Alias for Pandas library
Variable explorer view
STEP 3: CREATE MATRIX OF FEATURES AND DEPENDENT VAR VECTOR
Matrix of features
A term used in Machine Learning to describe the list of columns in the
dataset that contain independent variables. (Albert Cyberhulk, n.d.)
Dependent variable vector
A term used in Machine Learning to define the list of dependent variables
in the existing dataset. (Albert Cyberhulk, n.d.)
What is iloc?
Purely integer based indexing method provided by Pandas.
0-based
When slicing, start bounds is included while the upper bound is excluded.
• (Pandas.pydata.org, n.d.)
STEP 4: HANDLE MISSING DATA
Why handle missing data?
Datasets with missing values are incompatible with scikit-learn
estimators which assume that all values in an array are numerical,
and that all have and hold meaning.
(Scikit-learn.org, n.d.)
Imputation strategy
Strategy = “mean”: Replace the missing values using the mean
along the axis.
Strategy = “median”: Replace the missing values using the median
along the axis.
Strategy = “most_frequent”: Replace the missing values using the
most frequent value along the axis.
(Scikit-learn.org, n.d.)
Fit vs Transform
Fit: Finds the internal parameters of a model that will be used to
transform data.
Transform: Applies the parameters to the data.
You may fit a model to one set of data, and then transform it on a
completely different set.
(scikit-learn, n.d.)
- axis = 0: Impute along the column
- axis = 1: Impute along the row
Missing value is populated
with the mean value
STEP 5: SPLIT THE DATASET IN TO TRAINING AND TEST SUBSETS
What are the subsets and their purpose?
The complete dataset is split in to subsets, one of which is used to
train the model while the other is used to test it.
Training subset: This subset contains the input values and the
actual output values. The purpose is to train the model on the actual
data.
Test subset: This subset contains the input values only while the
output values are predicted by the model.
• (Towards Data Science, n.d.), (set?, n.d.)
What is test_size (train_size)?
The value of this parameter represents the proportion of the dataset
to be included in the test split (train split).
If float, the value should be between 0.0 and 1.0. If int then the
value represents the absolute number of test samples (train
samples). If None then the value is set to the complement of the
train size (test size).
• (Scikit-learn.org, n.d.)
What is random_state
A pseudo-random number generator state used for random
sampling. (Scikit-learn.org, n.d.)
Training sets with 8
records each
Test sets with 2
records each
STEP 6: FITTING THE SIMPLE LINEAR REGRESSION MODEL TO DATA
What is linear regression?
In statistics, linear regression is a linear approach for modeling the relationship
between a scalar dependent variable y and one or more independent variables
denoted X. (En.wikipedia.org, n.d.)
The case of one independent variable is called simple linear regression. For
more than one independent variable, the process is called multiple linear
regression. (En.wikipedia.org, n.d.)
What is meant by fitting a model?
It is the process of constructing a curve, or mathematical function, that has the
best fit to a series of data points. (En.wikipedia.org, n.d.)
By fitting a model, you're making your algorithm learn the relationship between
the independent and dependent variables so that it could be used to predict the
outcome (dependent variable value). (quora.com, n.d.)
We are using the model to
predict the outcome.
STEP 7: VISUALISE THE RESULT ON A GRAPH
‘plt’ is the alias for matplotlib.pyplot library
that we imported in the beginning
What are we trying to do here?
On a graph, we have plotted the observation points and the simple linear
regression line. (Eremenko and de Ponteves, n.d.)
Purpose is to see the linear dependency and how the predictions of this
simple linear model can be close to the real observations. (Eremenko and de
Ponteves, n.d.)
Similar prediction and visualization could be performed for the test subset
as well to see how good is our model is at predicting the outcome.
BIBLIOGRAPHY
 Pandas.pydata.org. (n.d.). Python Data Analysis Library — pandas: Python Data Analysis Library. [online] Available at: https://pandas.pydata.org/ [Accessed 5 Dec. 2017].
 Matplotlib.org. (n.d.). Pyplot tutorial — Matplotlib 2.0.2 documentation. [online] Available at: https://matplotlib.org/users/pyplot_tutorial.html [Accessed 5 Dec. 2017].
 Scikit-learn.org. (n.d.). 4.3. Preprocessing data — scikit-learn 0.19.1 documentation. [online] Available at: http://scikit-learn.org/stable/modules/preprocessing.html#preprocessing
[Accessed 6 Dec. 2017].
 Scikit-learn.org. (n.d.). sklearn.cross_validation.train_test_split — scikit-learn 0.16.1 documentation. [online] Available at: http://scikit-
learn.org/0.16/modules/generated/sklearn.cross_validation.train_test_split.html [Accessed 6 Dec. 2017].
 Pandas.pydata.org. (n.d.). Indexing and Selecting Data — pandas 0.21.0 documentation. [online] Available at: https://pandas.pydata.org/pandas-
docs/stable/indexing.html#indexing-integer [Accessed 6 Dec. 2017].
 Scikit-learn.org. (n.d.). 4.3. Preprocessing data — scikit-learn 0.19.1 documentation. [online] Available at: http://scikit-learn.org/stable/modules/preprocessing.html#imputation
[Accessed 7 Dec. 2017].
 Scikit-learn.org. (n.d.). sklearn.preprocessing.Imputer — scikit-learn 0.19.1 documentation. [online] Available at: http://scikit-
learn.org/stable/modules/generated/sklearn.preprocessing.Imputer.html [Accessed 7 Dec. 2017].
 scikit-learn, F. (n.d.). Fitting data vs. transforming data in scikit-learn. [online] Stackoverflow.com. Available at: https://stackoverflow.com/questions/31572487/fitting-data-vs-
transforming-data-in-scikit-learn [Accessed 7 Dec. 2017].
 Towards Data Science. (n.d.). Train/Test Split and Cross Validation in Python – Towards Data Science. [online] Available at: https://towardsdatascience.com/train-test-split-and-
cross-validation-in-python-80b61beca4b6 [Accessed 7 Dec. 2017].
 set?, W. (n.d.). What is the difference between test set and validation set?. [online] Stats.stackexchange.com. Available at: https://stats.stackexchange.com/questions/19048/what-
is-the-difference-between-test-set-and-validation-set [Accessed 7 Dec. 2017].
 En.wikipedia.org. (n.d.). Curve fitting. [online] Available at: https://en.wikipedia.org/wiki/Curve_fitting [Accessed 7 Dec. 2017].
 quora.com. (n.d.). What does fitting a model mean in data science?. [online] Available at: https://www.quora.com/What-does-fitting-a-model-mean-in-data-science [Accessed 7
Dec. 2017].
 En.wikipedia.org. (n.d.). Linear regression. [online] Available at: https://en.wikipedia.org/wiki/Linear_regression [Accessed 7 Dec. 2017].
 Eremenko, K. and de Ponteves, H. (n.d.). Simple Linear Regression in Python - Step 4. [video] Available at:
https://www.udemy.com/machinelearning/learn/v4/t/lecture/5768342?start=0 [Accessed 7 Dec. 2017].
THANK YOU FOR YOUR TIME!!

Machine Learning - Simple Linear Regression

  • 1.
    MACHINE LEARNING Fitting aSimple Linear Regression model in Python Siddharth Shrivastava
  • 2.
    • Get startedwith programing to create a Simple Linear Regression model • Demonstrate a working example of fitting a model to our dataset • Programing language - Python • IDE - Spyder (installed through Anaconda) What is this session about? • Import the libraries and classes • Import the dataset • Create Matrix of features and dependent var vector • Handle missing data using mean values • Split the dataset in to training and test subsets • Fitting the simple linear regression model to training and test sets • Visualise the results on a graph What we would do in the Python code today? At the end of this session, we should be able to create a Simple Linear Regression model in Python which could be used to predict the values of the dependent variable based on the values of the independent variable PLAN OF THE SESSION - AGENDA
  • 3.
    Used to importand manage dataset Open source library Provides high-performance and easy-to-use data analysis tools for Python (Pandas.pydata.org, n.d.) Pandas data analysis lib Used to plot graph for visualisation Various states are preserved across function calls, so the plotting functions are directed to the current axes (part of fig.) (Matplotlib.org, n.d.) Matplotlib.pyplot The Imputer class provides basic strategies for handling the missing values – either using mean, median or most frequent value in the row or column. (Scikit-learn.org, n.d.) sklearn.preprocessing.Imputer Used to split arrays or matrices into random train and test subsets. (Scikit-learn.org, n.d.) sklearn.cross_validation.train_test_split Used to model a linear relationship between a dependent variable and one or more independent variables.sklearn.linear_model.LinearRegression Code snippet Console STEP 1: IMPORT THE LIBRARIES AND CLASSES
  • 4.
    Code snippet Data inCSV file Imported dataset Notice that the imported dataset has the value ‘nan’ in the cells that were blank in the datasheet. These cells would later be modified as part of handling the missing data. STEP 2: IMPORT THE DATASET Alias for Pandas library
  • 5.
    Variable explorer view STEP3: CREATE MATRIX OF FEATURES AND DEPENDENT VAR VECTOR Matrix of features A term used in Machine Learning to describe the list of columns in the dataset that contain independent variables. (Albert Cyberhulk, n.d.) Dependent variable vector A term used in Machine Learning to define the list of dependent variables in the existing dataset. (Albert Cyberhulk, n.d.) What is iloc? Purely integer based indexing method provided by Pandas. 0-based When slicing, start bounds is included while the upper bound is excluded. • (Pandas.pydata.org, n.d.)
  • 6.
    STEP 4: HANDLEMISSING DATA Why handle missing data? Datasets with missing values are incompatible with scikit-learn estimators which assume that all values in an array are numerical, and that all have and hold meaning. (Scikit-learn.org, n.d.) Imputation strategy Strategy = “mean”: Replace the missing values using the mean along the axis. Strategy = “median”: Replace the missing values using the median along the axis. Strategy = “most_frequent”: Replace the missing values using the most frequent value along the axis. (Scikit-learn.org, n.d.) Fit vs Transform Fit: Finds the internal parameters of a model that will be used to transform data. Transform: Applies the parameters to the data. You may fit a model to one set of data, and then transform it on a completely different set. (scikit-learn, n.d.) - axis = 0: Impute along the column - axis = 1: Impute along the row Missing value is populated with the mean value
  • 7.
    STEP 5: SPLITTHE DATASET IN TO TRAINING AND TEST SUBSETS What are the subsets and their purpose? The complete dataset is split in to subsets, one of which is used to train the model while the other is used to test it. Training subset: This subset contains the input values and the actual output values. The purpose is to train the model on the actual data. Test subset: This subset contains the input values only while the output values are predicted by the model. • (Towards Data Science, n.d.), (set?, n.d.) What is test_size (train_size)? The value of this parameter represents the proportion of the dataset to be included in the test split (train split). If float, the value should be between 0.0 and 1.0. If int then the value represents the absolute number of test samples (train samples). If None then the value is set to the complement of the train size (test size). • (Scikit-learn.org, n.d.) What is random_state A pseudo-random number generator state used for random sampling. (Scikit-learn.org, n.d.) Training sets with 8 records each Test sets with 2 records each
  • 8.
    STEP 6: FITTINGTHE SIMPLE LINEAR REGRESSION MODEL TO DATA What is linear regression? In statistics, linear regression is a linear approach for modeling the relationship between a scalar dependent variable y and one or more independent variables denoted X. (En.wikipedia.org, n.d.) The case of one independent variable is called simple linear regression. For more than one independent variable, the process is called multiple linear regression. (En.wikipedia.org, n.d.) What is meant by fitting a model? It is the process of constructing a curve, or mathematical function, that has the best fit to a series of data points. (En.wikipedia.org, n.d.) By fitting a model, you're making your algorithm learn the relationship between the independent and dependent variables so that it could be used to predict the outcome (dependent variable value). (quora.com, n.d.) We are using the model to predict the outcome.
  • 9.
    STEP 7: VISUALISETHE RESULT ON A GRAPH ‘plt’ is the alias for matplotlib.pyplot library that we imported in the beginning What are we trying to do here? On a graph, we have plotted the observation points and the simple linear regression line. (Eremenko and de Ponteves, n.d.) Purpose is to see the linear dependency and how the predictions of this simple linear model can be close to the real observations. (Eremenko and de Ponteves, n.d.) Similar prediction and visualization could be performed for the test subset as well to see how good is our model is at predicting the outcome.
  • 10.
    BIBLIOGRAPHY  Pandas.pydata.org. (n.d.).Python Data Analysis Library — pandas: Python Data Analysis Library. [online] Available at: https://pandas.pydata.org/ [Accessed 5 Dec. 2017].  Matplotlib.org. (n.d.). Pyplot tutorial — Matplotlib 2.0.2 documentation. [online] Available at: https://matplotlib.org/users/pyplot_tutorial.html [Accessed 5 Dec. 2017].  Scikit-learn.org. (n.d.). 4.3. Preprocessing data — scikit-learn 0.19.1 documentation. [online] Available at: http://scikit-learn.org/stable/modules/preprocessing.html#preprocessing [Accessed 6 Dec. 2017].  Scikit-learn.org. (n.d.). sklearn.cross_validation.train_test_split — scikit-learn 0.16.1 documentation. [online] Available at: http://scikit- learn.org/0.16/modules/generated/sklearn.cross_validation.train_test_split.html [Accessed 6 Dec. 2017].  Pandas.pydata.org. (n.d.). Indexing and Selecting Data — pandas 0.21.0 documentation. [online] Available at: https://pandas.pydata.org/pandas- docs/stable/indexing.html#indexing-integer [Accessed 6 Dec. 2017].  Scikit-learn.org. (n.d.). 4.3. Preprocessing data — scikit-learn 0.19.1 documentation. [online] Available at: http://scikit-learn.org/stable/modules/preprocessing.html#imputation [Accessed 7 Dec. 2017].  Scikit-learn.org. (n.d.). sklearn.preprocessing.Imputer — scikit-learn 0.19.1 documentation. [online] Available at: http://scikit- learn.org/stable/modules/generated/sklearn.preprocessing.Imputer.html [Accessed 7 Dec. 2017].  scikit-learn, F. (n.d.). Fitting data vs. transforming data in scikit-learn. [online] Stackoverflow.com. Available at: https://stackoverflow.com/questions/31572487/fitting-data-vs- transforming-data-in-scikit-learn [Accessed 7 Dec. 2017].  Towards Data Science. (n.d.). Train/Test Split and Cross Validation in Python – Towards Data Science. [online] Available at: https://towardsdatascience.com/train-test-split-and- cross-validation-in-python-80b61beca4b6 [Accessed 7 Dec. 2017].  set?, W. (n.d.). What is the difference between test set and validation set?. [online] Stats.stackexchange.com. Available at: https://stats.stackexchange.com/questions/19048/what- is-the-difference-between-test-set-and-validation-set [Accessed 7 Dec. 2017].  En.wikipedia.org. (n.d.). Curve fitting. [online] Available at: https://en.wikipedia.org/wiki/Curve_fitting [Accessed 7 Dec. 2017].  quora.com. (n.d.). What does fitting a model mean in data science?. [online] Available at: https://www.quora.com/What-does-fitting-a-model-mean-in-data-science [Accessed 7 Dec. 2017].  En.wikipedia.org. (n.d.). Linear regression. [online] Available at: https://en.wikipedia.org/wiki/Linear_regression [Accessed 7 Dec. 2017].  Eremenko, K. and de Ponteves, H. (n.d.). Simple Linear Regression in Python - Step 4. [video] Available at: https://www.udemy.com/machinelearning/learn/v4/t/lecture/5768342?start=0 [Accessed 7 Dec. 2017].
  • 11.
    THANK YOU FORYOUR TIME!!