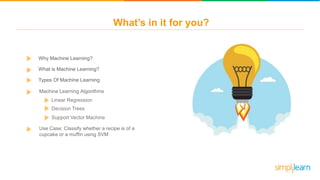
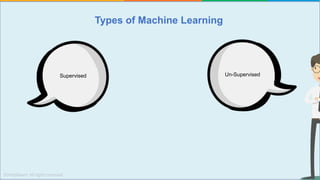
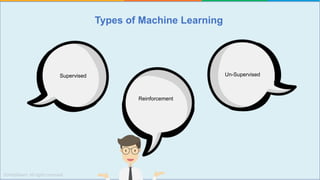
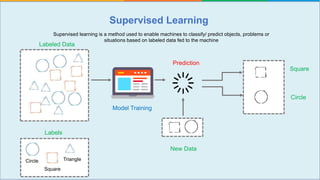
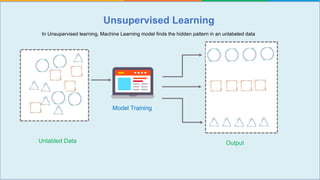
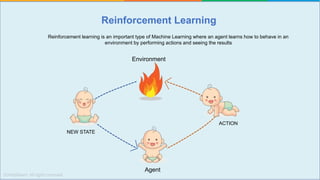
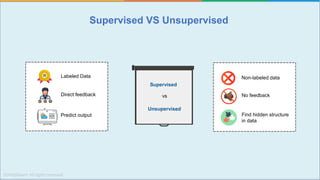
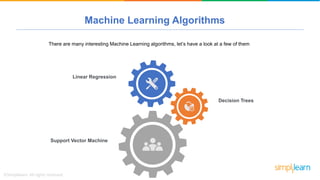
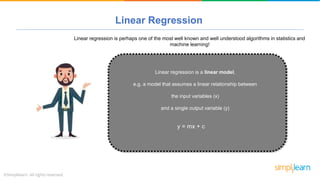
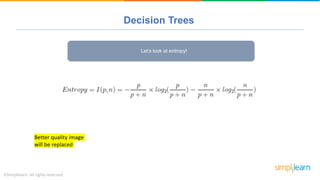
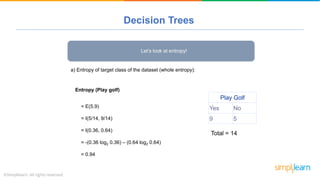
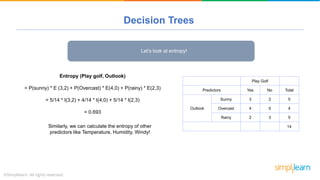
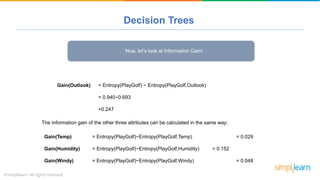
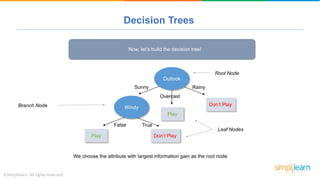
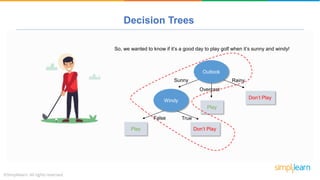
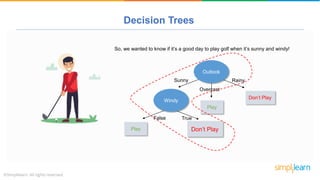
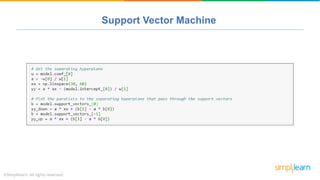
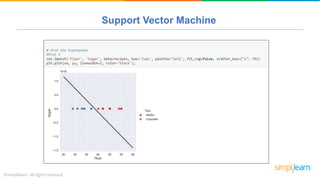
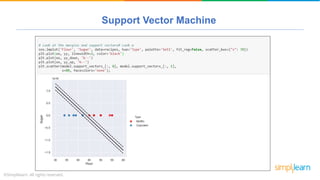
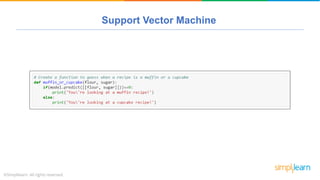
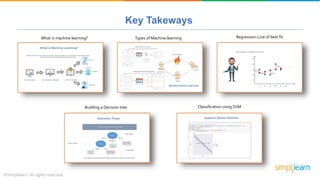
Machine learning Tutorial
What’s in it for you?
Why Machine Learning?
What is Machine Learning?
Types Of Machine Learning
Machine Learning Algorithms
Linear Regression
Decision Trees
Support Vector Machine
Use Case: Classify whether a recipe is of a
cupcake or a muffin using SVM
Why Machine Learning?
Because Machine can drive your
car for you!!
Because Machine can unlock your
phone with your face!!
Because Machine can now detect
50 eye diseases
Why Machine Learning?
Nobody likes spam posts on Facebook that
annoy them into interacting with likes, shares,
comments, and other actions
Why Machine Learning?
This tactic, known as “Engagement Bait,” takes
advantage of Facebook’s Newsfeed algorithm
by boosting engagement in order to get greater
reach
To eliminate engagement bait, the company reviewed and categorized hundreds of thousands of posts to
train a machine learning model that detects different types of engagement bait
Facebook scroll
GIF will be
replaced
New Post
Scans the keywords and phrases
like “This” and checks the click
through rate
This is a
tag bait!
Block this
post
Data fed to the machine
Google’s DeepMind project “AlphaGO”, a  computer program that plays the board game ‘GO’ has defeated the world’s number
one Go player Ke Jie
What is Machine Learning?
Machine learning is the science of making computers learn and act like humans by feeding data and
information without being explicitly programmed!
Ordinary System With Artificial Intelligence Machine Learning
Learns
Predicts
Improves
Define Objective
Collect Data
Prepare Data
Select Algorithm
Deploy
Predict
Test Model
Train Model
01
02
03
04
05
06
07
08
What is Machine Learning?
For instance, whether the stock price will increase or decrease
Do you want to predict a
category? That’s
classification!
For instance, predicting the age of a person based on the height, weight,
health and other factors
Do you want to predict a
quantity? That’s regression!
For instance, you want to detect money withdrawal anomalies
Do you want to detect an
anomaly? That’s anomaly
detection!
For instance: Finding groups of customers with similar behavior given a
large database of customer data containing their demographics and past
buying records
Do you want to discover structure
in unexplored data? That’s
clustering
What do you understand from Measures and Dimensions?
Each field from the data source is automatically assigned a
datatype (such as string, integer) and a role (dimension or
measure)
Aggregation applied on measures is ‘Sum’ by default but you
can always change the default aggregation in the settings
Can you tell what’s happening in the
following cases?
A. Grouping documents into different categories based on the
topic and content of each document
B. Identifying hand-written digits in images correctly
C. Behavior of a website indicating that the site is not working
as designed
D. Predicting salary of an individual based his/her years of
experience
Types of Machine Learning
Supervised
Types of Machine Learning
Supervised Un-Supervised
Types of Machine Learning
Supervised
Reinforcement
Un-Supervised
Supervised Learning
Labeled Data
Model Training
New Data
Square
Circle
Prediction
Supervised learning is a method used to enable machines to classify/ predict objects, problems or
situations based on labeled data fed to the machine
Circle
Square
Triangle
Labels
Unsupervised Learning
Unlabled Data Output
In Unsupervised learning, Machine Learning model finds the hidden pattern in an unlabeled data
Model Training
Reinforcement Learning
Reinforcement learning is an important type of Machine Learning where an agent learns how to behave in an
environment by performing actions and seeing the results
ACTION
NEW STATE
Agent
Environment
Supervised VS Unsupervised
No feedback
Find hidden structure
in data
Supervised
vs
Unsupervised
Labeled Data
Direct feedback
Predict output
Non-labeled data
Support Vector Machine
Linear Regression
Decision Trees
Machine Learning Algorithms
There are many interesting Machine Learning algorithms, let’s have a look at a few of them
Linear Regression
y = mx + c
Linear regression is a linear model,
e.g. a model that assumes a linear relationship between
the input variables (x)
and a single output variable (y)
Linear regression is perhaps one of the most well known and well understood algorithms in statistics and
machine learning!
Linear Regression
Imagine, we are predicting distance travelled (y) from speed (x).
Our linear regression model representation for this problem
would be:
y = m * x + c
Or
distance = m * speed + c
c = coefficient
m = y-intercept
Speed = 10m/s
Distance = 36 km
Time is constant
Speed = 10m/s
Distance = 36 km
Speed = 20m/s
Distance = 52 km
Time is constant
Speed = 10m/s
Distance = 36 km
Speed = 20m/s
Distance = 52 km
Speed = 30m/s Distance = ?
Time is constant
Linear Regression
Speed
Distance
y = mx + c
Distance travelled in fixed
interval of time
c = y-intercept of line
m = +ve slope of the line
As the speed increases, distance also increases, hence the variables have a positive relationship
Speed of the person
Distance is constant
Speed = 10m/s
Time = 100 s
Speed = 10m/s
Time = 100 s
Speed = 20m/s
Time = 50 s
Distance is constant
Speed = 10m/s
Time = 100 s
Speed = 20m/s
Time = 50 s
Speed = 30m/s Time = ?
Distance is constant
Linear Regression
Speed
Time
y = mx + c
Time taken to travel a
fixed distance
m = -ve slope of the line
As the speed increases, time decreases, hence the variables have a negative relationship
If distance is assumed to be constant, let’s see the relationship between speed and time
Speed of the person
Linear Regression
Let’s see the mathematical implementation of Linear Regression!
Suppose we have a dataset that looks like:
x y
1 3
2 2
3 2
4 4
5 3
Linear Regression
Let’s plot these points!!
1 2 3 4 5 6
1
2
3
4
5
x y
1 3
2 2
3 2
4 4
5 3
Mean(xi) = 3
Linear Regression
Let’s plot these points!!
x y
1 3
2 2
3 2
4 4
5 3
Mean(xi) = 3 Mean(yi) = 2.8
1 2 3 4 5 6
1
2
3
4
5
Linear Regression
Now, lets find regression equation to find the best fit line!
y = mx + c
To find this equation for our data, we need to find our slope (m) and coefficient
(c)
Linear Regression
y = mx + c
( x- xi ) ( y – yi )
( x- xi ) 2m =
x y x- xi y – yi ( x- xi ) 2 ( x- xi ) ( y – yi )
1 3 -2 0.2 4 -0.4
2 2 -1 -0.8 1 0.8
3 2 0 -0.8 0 0
4 4 1 1.2 1 1.2
5 3 2 0.2 4 0.4
Linear Regression
y = mx + c
( x- xi ) ( y – yi )
( x- xi ) 2m =
x y x- xi y – yi ( x- xi ) 2 ( x- xi ) ( y – yi )
1 3 -2 0.2 4 -0.4
2 2 -1 -0.8 1 0.8
3 2 0 -0.8 0 0
4 4 1 1.2 1 1.2
5 3 2 0.2 4 0.4
Total = 2Total = 10
y = mx + c
( x- xi ) ( y – yi )
( x- xi ) 2m =
x y x- xi y – yi ( x- xi ) 2 ( x- xi ) ( y – yi )
1 3 -2 0.2 4 -0.4
2 2 -1 -0.8 1 0.8
3 2 0 -0.8 0 0
4 4 1 1.2 1 1.2
5 3 2 0.2 4 0.4
Total = 2Total = 10
= 2/10 = 0.2
Linear Regression
Linear Regression
y = mx + c
( x- xi ) ( y – yi )
( x- xi ) 2m = = 2/10 = 0.2
y = 0.2 x + c
2.8 = 0.2 * 3 + c
2.8 = 0.6 + c
c = 2.8 - 0.6
c = 2.2
So, we can calculate the value of c
Mean values = (3, 2.8)
Linear Regression
Hence this is our regression line!
y = ( 0.2 *x ) + 2.2
1 2 3 4 5 6
1
2
3
4
5
Linear Regression
Now, let’s predict the values of y using x = {1,2,3,4,5} and plot the points!
y = ( 0.2 *x ) + 2.2
yp = (0.2 * 1) + 2.2 = 2.4
yp = (0.2 * 2) + 2.2 = 2.6
yp = (0.2 * 3) + 2.2 = 2.8
yp = (0.2 * 4) + 2.2 = 3.0
yp = (0.2 * 5) + 2.2 = 3.2
yp = Predicted values of y
Linear Regression
Plot the predicted values along with the actual values to see the difference
1 2 3 4 5 6
1
2
3
4
5
-
-
--
Error
Error
Error
Error
x y yp
1 3 2.4
2 2 2.6
3 2 2.8
4 4 3
5 3 3.2
x
y
Linear Regression
So, our goal is to reduce this error!
1 2 3 4 5 6
1
2
3
4
5
-
-
--
Error
Error
Error
Error
Linear Regression
Minimizing the Distance: There are lots of ways to minimize the distance between the line and the data points
like Sum of Squared errors, Sum of Absolute errors, Root Mean Square error etc.
We keep moving this line through the data points to make sure the best fit line has the least square distance between
the data points and the regression line
Decision Trees
Decision Tree is a tree shaped algorithm used to determine a
course of action
Each branch of the tree represents a possible decision,
occurrence or reaction
Decision Trees
We have a data which tells us if it is a good day to play golf!
Outlook Temp Humidity Windy Play Golf
Rainy Hot High FALSE No
Rainy Hot High TRUE No
Overcast Hot High FALSE Yes
Sunny Mild High FALSE Yes
Sunny Cool Normal FALSE Yes
Sunny Cool Normal TRUE No
Overcast Cool Normal TRUE Yes
Rainy Mild High FALSE No
Rainy Cool Normal FALSE Yes
Sunny Mild Normal FALSE Yes
Rainy Mild Normal TRUE Yes
Overcast Mild High TRUE Yes
Overcast Hot Normal FALSE Yes
Sunny Mild High TRUE No
Decision Trees
Let’s determine if you should play golf when the day is sunny and
windy?
Decision Trees
Suppose, we draw our tree like this!
Humidity
Normal High
Sunny
Outlook
Overcast
Rainy
Play
Don’t Play
Play
Don’t Play
Decision Trees
But, is this the right decision tree?
For that, we should calculate Entropy and Information Gain!
Entropy is the measure of randomness or ‘impurity’ in the
dataset
Entropy
It is the measure of decrease in entropy after the dataset is
split
Also known as Entropy Reduction
Information Gain
Entropy should be low!
Information Gain should be high!
Decision Trees
Let’s look at entropy!
Better quality image
will be replaced
Decision Trees
Let’s look at entropy!
= E(5,9)
= I(5/14, 9/14)
= I(0.36, 0.64)
= -(0.36 log2 0.36) – (0.64 log2 0.64)
= 0.94
Play Golf
Yes No
9 5
Total = 14
Entropy (Play golf)
a) Entropy of target class of the dataset (whole entropy):
Decision Trees
Let’s look at entropy!
Entropy (Play golf, Outlook)
= P(sunny) * E (3,2) + P(Overcast) * E(4,0) + P(rainy) * E(2,3)
= 5/14 * I(3,2) + 4/14 * I(4,0) + 5/14 * I(2,3)
= 0.693
Similarly, we can calculate the entropy of other
predictors like Temperature, Humidity, Windy!
Play Golf
Predictors Yes No Total
Outlook
Sunny 3 2 5
Overcast 4 0 4
Rainy 2 3 5
14
Decision Trees
Now, let’s look at Information Gain!
Gain(Outlook) = Entropy(PlayGolf) − Entropy(PlayGolf,Outlook)
= 0.940−0.693
=0.247
The information gain of the other three attributes can be calculated in the same way:
Gain(Temp) = Entropy(PlayGolf)−Entropy(PlayGolf,Temp) = 0.029
Gain(Humidity) = Entropy(PlayGolf)−Entropy(PlayGolf,Humidity) = 0.152
Gain(Windy) = Entropy(PlayGolf)−Entropy(PlayGolf,Windy) = 0.048
Decision Trees
Now, let’s build the decision tree!
We choose the attribute with largest information gain as the root node
Sunny
Outlook
Overcast
Rainy
Windy
TrueFalse
Don’t Play
Play
Play Don’t Play
Root Node
Branch Node
Leaf Nodes
Decision Trees
So, we wanted to know if it’s a good day to play golf when it’s sunny and windy!
Sunny
Outlook
Overcast
Rainy
Windy
TrueFalse
Don’t Play
Play
Play Don’t Play
Decision Trees
So, we wanted to know if it’s a good day to play golf when it’s sunny and windy!
Sunny
Outlook
Overcast
Rainy
Windy
TrueFalse
Don’t Play
Play
Play Don’t Play
Decision Trees
Uh-Oh, it’s not a good day to play golf!
You can watch a golf game at home! :D
Support Vector Machine
Support Vector Machine is a widely used classification algorithm!
The idea of Support Vector Machines is simple: The algorithm creates
a separation line which divides the classes in the best possible
manner
For example, dog or cat, disease or no disease
Support Vector Machine
Weight
Height
Suppose, we have labeled sample data, which tells height and weight
of males and females
Support Vector Machine
How can a machine classify whether a new data point is a male or a
female?
A new data
point
Height
Weight
Support Vector Machine
We draw decision lines, but if we consider decision line 1 then we will
classify it as a male
Line 1
Height
Weight
Support Vector Machine
And if we consider decision line 2, then it will be a female!
Line 1 Line 2
Height
Weight
Support Vector Machine
We need to know which line divides the classes correctly, but how?
Line 1 Line 2
Height
Weight
Support Vector Machine
The goal is to choose a hyperplane with the greatest possible margin between the decision line and the nearest
point within the training set
Height
Line 1
Support Vectors
Distance Margin: The distance between the hyperplane and the nearest data point from either set
Weight
Support Vector Machine
When we draw the hyperplanes, we observe that Line 1 has the maximum distance margin so it will classify the
new data point correctly
Height
Line 1
Result: New data point is male!
Weight
Support Vectors
Support Vector Machine
Let’s understand this with the help of an example!
Support Vector Machine
Problem Statement: Classifying muffin and cupcake recipes using support vector machines
VS
Support Vector Machine
Let’s have a look at our dataset:
Type Flour Milk Sugar Butter Egg Baking Powder Vanilla Salt
Muffin 55 28 3 7 5 2 0 0
Muffin 47 24 12 6 9 1 0 0
Muffin 47 23 18 6 4 1 0 0
Muffin 45 11 17 17 8 1 0 0
Muffin 50 25 12 6 5 2 1 0
Muffin 55 27 3 7 5 2 1 0
Muffin 54 27 7 5 5 2 0 0
Muffin 47 26 10 10 4 1 0 0
Muffin 50 17 17 8 6 1 0 0
Muffin 50 17 17 11 4 1 0 0
Cupcake 39 0 26 19 14 1 1 0
Cupcake 42 21 16 10 8 3 0 0
Cupcake 34 17 20 20 5 2 1 0
Cupcake 39 13 17 19 10 1 1 0
Cupcake 38 15 23 15 8 0 1 0
Cupcake 42 18 25 9 5 1 0 0
Cupcake 36 14 21 14 11 2 1 0
Cupcake 38 15 31 8 6 1 1 0
Cupcake 36 16 24 12 9 1 1 0
Cupcake 34 17 23 11 13 0 1 0
What's the difference between a
muffin and a cupcake?
Turns out muffins have more
flour, while cupcakes have more
butter and sugar
Support Vector Machine
Hence, we have built a classifier
using SVM which is able to classify
if a recipe is of a cupcake or a
muffin!
Key Takeways
What is machine learning?
Classification using SVMBuilding a Decision tree
Regression-Line of best fitTypes of Machine learning
Machine Learning Tutorial Part - 1 | Machine Learning Tutorial For Beginners  Part - 1 | Simplilearn

Machine Learning Tutorial Part - 1 | Machine Learning Tutorial For Beginners Part - 1 | Simplilearn

  • 1.
  • 2.
    What’s in itfor you? Why Machine Learning? What is Machine Learning? Types Of Machine Learning Machine Learning Algorithms Linear Regression Decision Trees Support Vector Machine Use Case: Classify whether a recipe is of a cupcake or a muffin using SVM
  • 3.
    Why Machine Learning? BecauseMachine can drive your car for you!! Because Machine can unlock your phone with your face!! Because Machine can now detect 50 eye diseases
  • 4.
  • 5.
    Why Machine Learning? Nobodylikes spam posts on Facebook that annoy them into interacting with likes, shares, comments, and other actions
  • 6.
    Why Machine Learning? Thistactic, known as “Engagement Bait,” takes advantage of Facebook’s Newsfeed algorithm by boosting engagement in order to get greater reach
  • 7.
    To eliminate engagementbait, the company reviewed and categorized hundreds of thousands of posts to train a machine learning model that detects different types of engagement bait Facebook scroll GIF will be replaced New Post Scans the keywords and phrases like “This” and checks the click through rate This is a tag bait! Block this post Data fed to the machine
  • 8.
    Google’s DeepMind project“AlphaGO”, a  computer program that plays the board game ‘GO’ has defeated the world’s number one Go player Ke Jie
  • 9.
    What is MachineLearning? Machine learning is the science of making computers learn and act like humans by feeding data and information without being explicitly programmed! Ordinary System With Artificial Intelligence Machine Learning Learns Predicts Improves
  • 10.
    Define Objective Collect Data PrepareData Select Algorithm Deploy Predict Test Model Train Model 01 02 03 04 05 06 07 08 What is Machine Learning?
  • 11.
    For instance, whetherthe stock price will increase or decrease Do you want to predict a category? That’s classification!
  • 12.
    For instance, predictingthe age of a person based on the height, weight, health and other factors Do you want to predict a quantity? That’s regression!
  • 13.
    For instance, youwant to detect money withdrawal anomalies Do you want to detect an anomaly? That’s anomaly detection!
  • 14.
    For instance: Findinggroups of customers with similar behavior given a large database of customer data containing their demographics and past buying records Do you want to discover structure in unexplored data? That’s clustering
  • 16.
    What do youunderstand from Measures and Dimensions? Each field from the data source is automatically assigned a datatype (such as string, integer) and a role (dimension or measure) Aggregation applied on measures is ‘Sum’ by default but you can always change the default aggregation in the settings Can you tell what’s happening in the following cases? A. Grouping documents into different categories based on the topic and content of each document
  • 17.
    What do youunderstand from Measures and Dimensions? Each field from the data source is automatically assigned a datatype (such as string, integer) and a role (dimension or measure) Aggregation applied on measures is ‘Sum’ by default but you can always change the default aggregation in the settings Can you tell what’s happening in the following cases? A. Grouping documents into different categories based on the topic and content of each document B. Identifying hand-written digits in images correctly
  • 18.
    What do youunderstand from Measures and Dimensions? Each field from the data source is automatically assigned a datatype (such as string, integer) and a role (dimension or measure) Aggregation applied on measures is ‘Sum’ by default but you can always change the default aggregation in the settings Can you tell what’s happening in the following cases? A. Grouping documents into different categories based on the topic and content of each document B. Identifying hand-written digits in images correctly C. Behavior of a website indicating that the site is not working as designed
  • 19.
    What do youunderstand from Measures and Dimensions? Each field from the data source is automatically assigned a datatype (such as string, integer) and a role (dimension or measure) Aggregation applied on measures is ‘Sum’ by default but you can always change the default aggregation in the settings Can you tell what’s happening in the following cases? A. Grouping documents into different categories based on the topic and content of each document B. Identifying hand-written digits in images correctly C. Behavior of a website indicating that the site is not working as designed D. Predicting salary of an individual based his/her years of experience
  • 20.
    Types of MachineLearning Supervised
  • 21.
    Types of MachineLearning Supervised Un-Supervised
  • 22.
    Types of MachineLearning Supervised Reinforcement Un-Supervised
  • 23.
    Supervised Learning Labeled Data ModelTraining New Data Square Circle Prediction Supervised learning is a method used to enable machines to classify/ predict objects, problems or situations based on labeled data fed to the machine Circle Square Triangle Labels
  • 24.
    Unsupervised Learning Unlabled DataOutput In Unsupervised learning, Machine Learning model finds the hidden pattern in an unlabeled data Model Training
  • 25.
    Reinforcement Learning Reinforcement learningis an important type of Machine Learning where an agent learns how to behave in an environment by performing actions and seeing the results ACTION NEW STATE Agent Environment
  • 26.
    Supervised VS Unsupervised Nofeedback Find hidden structure in data Supervised vs Unsupervised Labeled Data Direct feedback Predict output Non-labeled data
  • 27.
    Support Vector Machine LinearRegression Decision Trees Machine Learning Algorithms There are many interesting Machine Learning algorithms, let’s have a look at a few of them
  • 28.
    Linear Regression y =mx + c Linear regression is a linear model, e.g. a model that assumes a linear relationship between the input variables (x) and a single output variable (y) Linear regression is perhaps one of the most well known and well understood algorithms in statistics and machine learning!
  • 29.
    Linear Regression Imagine, weare predicting distance travelled (y) from speed (x). Our linear regression model representation for this problem would be: y = m * x + c Or distance = m * speed + c c = coefficient m = y-intercept
  • 30.
    Speed = 10m/s Distance= 36 km Time is constant
  • 31.
    Speed = 10m/s Distance= 36 km Speed = 20m/s Distance = 52 km Time is constant
  • 32.
    Speed = 10m/s Distance= 36 km Speed = 20m/s Distance = 52 km Speed = 30m/s Distance = ? Time is constant
  • 33.
    Linear Regression Speed Distance y =mx + c Distance travelled in fixed interval of time c = y-intercept of line m = +ve slope of the line As the speed increases, distance also increases, hence the variables have a positive relationship Speed of the person
  • 34.
    Distance is constant Speed= 10m/s Time = 100 s
  • 35.
    Speed = 10m/s Time= 100 s Speed = 20m/s Time = 50 s Distance is constant
  • 36.
    Speed = 10m/s Time= 100 s Speed = 20m/s Time = 50 s Speed = 30m/s Time = ? Distance is constant
  • 37.
    Linear Regression Speed Time y =mx + c Time taken to travel a fixed distance m = -ve slope of the line As the speed increases, time decreases, hence the variables have a negative relationship If distance is assumed to be constant, let’s see the relationship between speed and time Speed of the person
  • 38.
    Linear Regression Let’s seethe mathematical implementation of Linear Regression! Suppose we have a dataset that looks like: x y 1 3 2 2 3 2 4 4 5 3
  • 39.
    Linear Regression Let’s plotthese points!! 1 2 3 4 5 6 1 2 3 4 5 x y 1 3 2 2 3 2 4 4 5 3 Mean(xi) = 3
  • 40.
    Linear Regression Let’s plotthese points!! x y 1 3 2 2 3 2 4 4 5 3 Mean(xi) = 3 Mean(yi) = 2.8 1 2 3 4 5 6 1 2 3 4 5
  • 41.
    Linear Regression Now, letsfind regression equation to find the best fit line! y = mx + c To find this equation for our data, we need to find our slope (m) and coefficient (c)
  • 42.
    Linear Regression y =mx + c ( x- xi ) ( y – yi ) ( x- xi ) 2m = x y x- xi y – yi ( x- xi ) 2 ( x- xi ) ( y – yi ) 1 3 -2 0.2 4 -0.4 2 2 -1 -0.8 1 0.8 3 2 0 -0.8 0 0 4 4 1 1.2 1 1.2 5 3 2 0.2 4 0.4
  • 43.
    Linear Regression y =mx + c ( x- xi ) ( y – yi ) ( x- xi ) 2m = x y x- xi y – yi ( x- xi ) 2 ( x- xi ) ( y – yi ) 1 3 -2 0.2 4 -0.4 2 2 -1 -0.8 1 0.8 3 2 0 -0.8 0 0 4 4 1 1.2 1 1.2 5 3 2 0.2 4 0.4 Total = 2Total = 10
  • 44.
    y = mx+ c ( x- xi ) ( y – yi ) ( x- xi ) 2m = x y x- xi y – yi ( x- xi ) 2 ( x- xi ) ( y – yi ) 1 3 -2 0.2 4 -0.4 2 2 -1 -0.8 1 0.8 3 2 0 -0.8 0 0 4 4 1 1.2 1 1.2 5 3 2 0.2 4 0.4 Total = 2Total = 10 = 2/10 = 0.2 Linear Regression
  • 45.
    Linear Regression y =mx + c ( x- xi ) ( y – yi ) ( x- xi ) 2m = = 2/10 = 0.2 y = 0.2 x + c 2.8 = 0.2 * 3 + c 2.8 = 0.6 + c c = 2.8 - 0.6 c = 2.2 So, we can calculate the value of c Mean values = (3, 2.8)
  • 46.
    Linear Regression Hence thisis our regression line! y = ( 0.2 *x ) + 2.2 1 2 3 4 5 6 1 2 3 4 5
  • 47.
    Linear Regression Now, let’spredict the values of y using x = {1,2,3,4,5} and plot the points! y = ( 0.2 *x ) + 2.2 yp = (0.2 * 1) + 2.2 = 2.4 yp = (0.2 * 2) + 2.2 = 2.6 yp = (0.2 * 3) + 2.2 = 2.8 yp = (0.2 * 4) + 2.2 = 3.0 yp = (0.2 * 5) + 2.2 = 3.2 yp = Predicted values of y
  • 48.
    Linear Regression Plot thepredicted values along with the actual values to see the difference 1 2 3 4 5 6 1 2 3 4 5 - - -- Error Error Error Error x y yp 1 3 2.4 2 2 2.6 3 2 2.8 4 4 3 5 3 3.2 x y
  • 49.
    Linear Regression So, ourgoal is to reduce this error! 1 2 3 4 5 6 1 2 3 4 5 - - -- Error Error Error Error
  • 50.
    Linear Regression Minimizing theDistance: There are lots of ways to minimize the distance between the line and the data points like Sum of Squared errors, Sum of Absolute errors, Root Mean Square error etc. We keep moving this line through the data points to make sure the best fit line has the least square distance between the data points and the regression line
  • 51.
    Decision Trees Decision Treeis a tree shaped algorithm used to determine a course of action Each branch of the tree represents a possible decision, occurrence or reaction
  • 52.
    Decision Trees We havea data which tells us if it is a good day to play golf! Outlook Temp Humidity Windy Play Golf Rainy Hot High FALSE No Rainy Hot High TRUE No Overcast Hot High FALSE Yes Sunny Mild High FALSE Yes Sunny Cool Normal FALSE Yes Sunny Cool Normal TRUE No Overcast Cool Normal TRUE Yes Rainy Mild High FALSE No Rainy Cool Normal FALSE Yes Sunny Mild Normal FALSE Yes Rainy Mild Normal TRUE Yes Overcast Mild High TRUE Yes Overcast Hot Normal FALSE Yes Sunny Mild High TRUE No
  • 53.
    Decision Trees Let’s determineif you should play golf when the day is sunny and windy?
  • 54.
    Decision Trees Suppose, wedraw our tree like this! Humidity Normal High Sunny Outlook Overcast Rainy Play Don’t Play Play Don’t Play
  • 55.
    Decision Trees But, isthis the right decision tree? For that, we should calculate Entropy and Information Gain! Entropy is the measure of randomness or ‘impurity’ in the dataset Entropy It is the measure of decrease in entropy after the dataset is split Also known as Entropy Reduction Information Gain Entropy should be low! Information Gain should be high!
  • 56.
    Decision Trees Let’s lookat entropy! Better quality image will be replaced
  • 57.
    Decision Trees Let’s lookat entropy! = E(5,9) = I(5/14, 9/14) = I(0.36, 0.64) = -(0.36 log2 0.36) – (0.64 log2 0.64) = 0.94 Play Golf Yes No 9 5 Total = 14 Entropy (Play golf) a) Entropy of target class of the dataset (whole entropy):
  • 58.
    Decision Trees Let’s lookat entropy! Entropy (Play golf, Outlook) = P(sunny) * E (3,2) + P(Overcast) * E(4,0) + P(rainy) * E(2,3) = 5/14 * I(3,2) + 4/14 * I(4,0) + 5/14 * I(2,3) = 0.693 Similarly, we can calculate the entropy of other predictors like Temperature, Humidity, Windy! Play Golf Predictors Yes No Total Outlook Sunny 3 2 5 Overcast 4 0 4 Rainy 2 3 5 14
  • 59.
    Decision Trees Now, let’slook at Information Gain! Gain(Outlook) = Entropy(PlayGolf) − Entropy(PlayGolf,Outlook) = 0.940−0.693 =0.247 The information gain of the other three attributes can be calculated in the same way: Gain(Temp) = Entropy(PlayGolf)−Entropy(PlayGolf,Temp) = 0.029 Gain(Humidity) = Entropy(PlayGolf)−Entropy(PlayGolf,Humidity) = 0.152 Gain(Windy) = Entropy(PlayGolf)−Entropy(PlayGolf,Windy) = 0.048
  • 60.
    Decision Trees Now, let’sbuild the decision tree! We choose the attribute with largest information gain as the root node Sunny Outlook Overcast Rainy Windy TrueFalse Don’t Play Play Play Don’t Play Root Node Branch Node Leaf Nodes
  • 61.
    Decision Trees So, wewanted to know if it’s a good day to play golf when it’s sunny and windy! Sunny Outlook Overcast Rainy Windy TrueFalse Don’t Play Play Play Don’t Play
  • 62.
    Decision Trees So, wewanted to know if it’s a good day to play golf when it’s sunny and windy! Sunny Outlook Overcast Rainy Windy TrueFalse Don’t Play Play Play Don’t Play
  • 63.
    Decision Trees Uh-Oh, it’snot a good day to play golf! You can watch a golf game at home! :D
  • 64.
    Support Vector Machine SupportVector Machine is a widely used classification algorithm! The idea of Support Vector Machines is simple: The algorithm creates a separation line which divides the classes in the best possible manner For example, dog or cat, disease or no disease
  • 65.
    Support Vector Machine Weight Height Suppose,we have labeled sample data, which tells height and weight of males and females
  • 66.
    Support Vector Machine Howcan a machine classify whether a new data point is a male or a female? A new data point Height Weight
  • 67.
    Support Vector Machine Wedraw decision lines, but if we consider decision line 1 then we will classify it as a male Line 1 Height Weight
  • 68.
    Support Vector Machine Andif we consider decision line 2, then it will be a female! Line 1 Line 2 Height Weight
  • 69.
    Support Vector Machine Weneed to know which line divides the classes correctly, but how? Line 1 Line 2 Height Weight
  • 70.
    Support Vector Machine Thegoal is to choose a hyperplane with the greatest possible margin between the decision line and the nearest point within the training set Height Line 1 Support Vectors Distance Margin: The distance between the hyperplane and the nearest data point from either set Weight
  • 71.
    Support Vector Machine Whenwe draw the hyperplanes, we observe that Line 1 has the maximum distance margin so it will classify the new data point correctly Height Line 1 Result: New data point is male! Weight Support Vectors
  • 72.
    Support Vector Machine Let’sunderstand this with the help of an example!
  • 73.
    Support Vector Machine ProblemStatement: Classifying muffin and cupcake recipes using support vector machines VS
  • 74.
    Support Vector Machine Let’shave a look at our dataset: Type Flour Milk Sugar Butter Egg Baking Powder Vanilla Salt Muffin 55 28 3 7 5 2 0 0 Muffin 47 24 12 6 9 1 0 0 Muffin 47 23 18 6 4 1 0 0 Muffin 45 11 17 17 8 1 0 0 Muffin 50 25 12 6 5 2 1 0 Muffin 55 27 3 7 5 2 1 0 Muffin 54 27 7 5 5 2 0 0 Muffin 47 26 10 10 4 1 0 0 Muffin 50 17 17 8 6 1 0 0 Muffin 50 17 17 11 4 1 0 0 Cupcake 39 0 26 19 14 1 1 0 Cupcake 42 21 16 10 8 3 0 0 Cupcake 34 17 20 20 5 2 1 0 Cupcake 39 13 17 19 10 1 1 0 Cupcake 38 15 23 15 8 0 1 0 Cupcake 42 18 25 9 5 1 0 0 Cupcake 36 14 21 14 11 2 1 0 Cupcake 38 15 31 8 6 1 1 0 Cupcake 36 16 24 12 9 1 1 0 Cupcake 34 17 23 11 13 0 1 0
  • 75.
    Support Vector Machine Let’shave a look at our dataset: Type Flour Milk Sugar Butter Egg Baking Powder Vanilla Salt Muffin 55 28 3 7 5 2 0 0 Muffin 47 24 12 6 9 1 0 0 Muffin 47 23 18 6 4 1 0 0 Muffin 45 11 17 17 8 1 0 0 Muffin 50 25 12 6 5 2 1 0 Muffin 55 27 3 7 5 2 1 0 Muffin 54 27 7 5 5 2 0 0 Muffin 47 26 10 10 4 1 0 0 Muffin 50 17 17 8 6 1 0 0 Muffin 50 17 17 11 4 1 0 0 Cupcake 39 0 26 19 14 1 1 0 Cupcake 42 21 16 10 8 3 0 0 Cupcake 34 17 20 20 5 2 1 0 Cupcake 39 13 17 19 10 1 1 0 Cupcake 38 15 23 15 8 0 1 0 Cupcake 42 18 25 9 5 1 0 0 Cupcake 36 14 21 14 11 2 1 0 Cupcake 38 15 31 8 6 1 1 0 Cupcake 36 16 24 12 9 1 1 0 Cupcake 34 17 23 11 13 0 1 0 What's the difference between a muffin and a cupcake? Turns out muffins have more flour, while cupcakes have more butter and sugar
  • 76.
  • 77.
  • 78.
  • 79.
  • 80.
  • 81.
  • 82.
  • 83.
  • 84.
  • 85.
  • 86.
  • 87.
    Support Vector Machine Hence,we have built a classifier using SVM which is able to classify if a recipe is of a cupcake or a muffin!
  • 88.
    Key Takeways What ismachine learning? Classification using SVMBuilding a Decision tree Regression-Line of best fitTypes of Machine learning

Editor's Notes

  • #3 Style - 01
  • #4 We can talk about how AI enabled machines are able to detect major diseases these days etc
  • #5 Remove title case
  • #6 Remove title case
  • #7 Remove title case
  • #8 Remove title case
  • #9 Hence, Machine learning is being used to reduce the spread of content that is spammy, sensational, or misleading in order to promote more meaningful and authentic conversations on Facebook
  • #10 Remove title case
  • #11 Remove title case
  • #12 Remove title case
  • #13 Remove title case
  • #14 Remove title case
  • #15 Remove title case
  • #16 Remove title case
  • #17 Style - 01
  • #18 Style - 01
  • #19 Style - 01
  • #20 Style - 01
  • #21 Remove title case
  • #22 Remove title case
  • #23 Remove title case
  • #24 Remove title case
  • #25 Remove title case
  • #26 Remove title case
  • #27 Remove title case
  • #29 Remove title case
  • #30 Remove title case
  • #34 Remove title case
  • #38 Remove title case
  • #39 Remove title case
  • #40 Remove title case
  • #41 Remove title case
  • #42 Remove title case
  • #43 Remove title case
  • #44 Remove title case
  • #45 Remove title case
  • #46 Remove title case
  • #47 Remove title case
  • #48 Remove title case
  • #49 Remove title case
  • #50 Remove title case
  • #51 Remove title case
  • #52 Remove title case
  • #53 Remove title case
  • #54 Remove title case
  • #55 Remove title case
  • #56 Remove title case
  • #57 Remove title case
  • #58 Remove title case
  • #59 Remove title case
  • #60 Remove title case
  • #61 Remove title case
  • #62 Remove title case
  • #63 Remove title case
  • #64 Remove title case
  • #65 Remove title case
  • #66 Remove title case
  • #67 Remove title case
  • #68 Remove title case
  • #69 Remove title case
  • #70  a hyperplane as a line that linearly separates and classifies a set of data
  • #71  a hyperplane as a line that linearly separates and classifies a set of data
  • #72  a hyperplane as a line that linearly separates and classifies a set of data
  • #73 Remove title case
  • #74 Remove title case
  • #75 Remove title case
  • #76 Remove title case
  • #77 Remove title case
  • #78 Remove title case
  • #79 Remove title case
  • #80 Remove title case
  • #81 Remove title case
  • #82 Remove title case
  • #83 Remove title case
  • #84 Remove title case
  • #85 Remove title case
  • #86 Remove title case
  • #87 Remove title case
  • #88 Remove title case