Unit 2_Logistic Regression_Types_Regularization.pdf
1.
Machine Learning
Sanjivani RuralEducation Society’s
Sanjivani College of Engineering, Kopargaon-423603
(An Autonomous Institute Affiliated to Savitribai Phule Pune University, Pune)
NAAC ‘A’ Grade Accredited
Department of Information Technology
NBAAccredited-UG Programme
Ms. K. D. Patil
Assistant Professor
2.
Contents - Regression
•Linear Regression, Logistic Regression, Ridge Regression, Lasso
Regression, Polynomial Regression, Types of Regression, Performance
metrics, Mean Squared Error (MSE), Root Mean Squared Error (RMSE),
Mean Absolute Error (MAE), R² (R-Squared)
Machine Learning Department of Information Technology
3.
Course Outcome
• CO2:To apply the Regression methods.
Machine Learning Department of Information Technology
4.
Logistic Regression
Machine LearningDepartment of Information Technology
• Logistic regression is one of the most popular Machine Learning
algorithms, which comes under the Supervised Learning technique.
• It is used for predicting the categorical dependent variable using a given
set of independent variables.
• It is used to describe data and to explain the relationship between one
dependent binary variable and one or more nominal, ordinal, interval or
ratio-level independent variables.
5.
Logistic Regression
Machine LearningDepartment of Information Technology
• Logistic regression predicts the output of a categorical dependent variable.
Therefore the outcome must be a categorical or discrete value.
• It can be either Yes or No, 0 or 1, true or False, etc. but instead of giving
the exact value as 0 and 1, it gives the probabilistic values which lie
between 0 and 1.
• It is much similar to the Linear Regression except that how they are used.
• Linear Regression is used for solving Regression problems, whereas
Logistic regression is used for solving the classification problems.
6.
Logistic Regression
Machine LearningDepartment of Information Technology
• In Logistic regression, instead of fitting a regression line, we fit an "S"
shaped logistic function, which predicts two maximum values (0 or 1).
• The curve from the logistic function indicates the likelihood of something
such as whether the cells are cancerous or not, a mouse is obese or not
based on its weight, etc.
• Logistic Regression is a significant machine learning algorithm because it
has the ability to provide probabilities and classify new data using
continuous and discrete datasets.
7.
Logistic Regression -Types
Machine Learning Department of Information Technology
• Binary Logistic Regression:
• Binary logistic regression is used to predict the probability of a binary
outcome, such as yes or no, true or false, or 0 or 1.
• For example, it could be used to predict whether a customer will churn
or not, whether a patient has a disease or not, or whether a loan will
be repaid or not.
8.
Logistic Regression -Types
Machine Learning Department of Information Technology
• Multinomial Logistic Regression:
• Multinomial logistic regression is used to predict the probability of one
of three or more possible outcomes, such as the type of product a
customer will buy, or the political party a person will vote for.
9.
Logistic Regression -Types
Machine Learning Department of Information Technology
• Ordinal Logistic Regression:
• Ordinal logistic regression is used to predict the probability of an
outcome that falls into a predetermined order, such as the level of
customer satisfaction, the severity of a disease, or the stage of cancer.
10.
Why do weuse Logistic Regression
Machine Learning Department of Information Technology
• Logistic Regression is only used when our dependent variable is binary and
in linear regression this dependent variable is continuous.
• If we add an outlier in our dataset, the best fit line in linear regression
shifts to fit that outlier (new point).
11.
Why do weuse Logistic Regression
Machine Learning Department of Information Technology
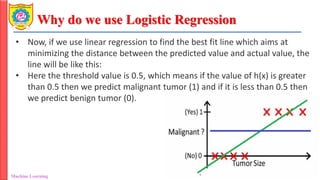
• Now, if we use linear regression to find the best fit line which aims at
minimizing the distance between the predicted value and actual value, the
line will be like this:
• Here the threshold value is 0.5, which means if the value of h(x) is greater
than 0.5 then we predict malignant tumor (1) and if it is less than 0.5 then
we predict benign tumor (0).
12.
Why do weuse Logistic Regression
Machine Learning Department of Information Technology
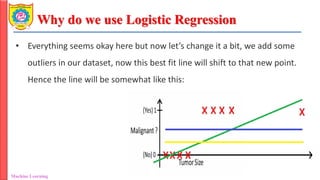
• Everything seems okay here but now let’s change it a bit, we add some
outliers in our dataset, now this best fit line will shift to that new point.
Hence the line will be somewhat like this:
13.
Why do weuse Logistic Regression
Machine Learning Department of Information Technology
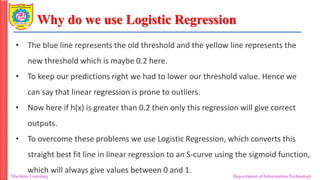
• The blue line represents the old threshold and the yellow line represents the
new threshold which is maybe 0.2 here.
• To keep our predictions right we had to lower our threshold value. Hence we
can say that linear regression is prone to outliers.
• Now here if h(x) is greater than 0.2 then only this regression will give correct
outputs.
• To overcome these problems we use Logistic Regression, which converts this
straight best fit line in linear regression to an S-curve using the sigmoid function,
which will always give values between 0 and 1.
14.
Logistic Regression -Sigmoid function
Machine Learning Department of Information Technology
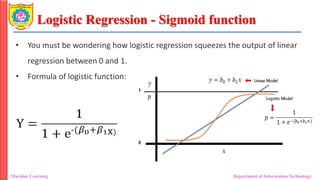
• You must be wondering how logistic regression squeezes the output of linear
regression between 0 and 1.
• Formula of logistic function:
15.
Logistic Regression -Sigmoid function
Machine Learning Department of Information Technology
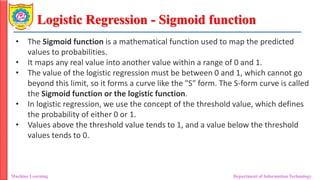
• The Sigmoid function is a mathematical function used to map the predicted
values to probabilities.
• It maps any real value into another value within a range of 0 and 1.
• The value of the logistic regression must be between 0 and 1, which cannot go
beyond this limit, so it forms a curve like the "S" form. The S-form curve is called
the Sigmoid function or the logistic function.
• In logistic regression, we use the concept of the threshold value, which defines
the probability of either 0 or 1.
• Values above the threshold value tends to 1, and a value below the threshold
values tends to 0.
16.
Logistic Regression -Sigmoid function
Machine Learning Department of Information Technology
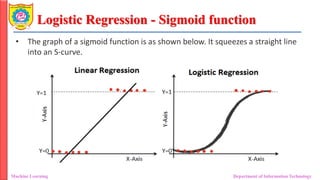
• The graph of a sigmoid function is as shown below. It squeezes a straight line
into an S-curve.
17.
Linear Regression VsLogistic Regression
Machine Learning Department of Information Technology
Sr.
No.
Linear Regression Logistic Regression
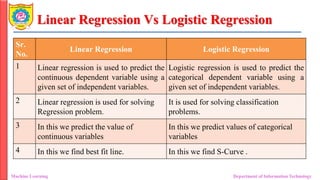
1 Linear regression is used to predict the
continuous dependent variable using a
given set of independent variables.
Logistic regression is used to predict the
categorical dependent variable using a
given set of independent variables.
2 Linear regression is used for solving
Regression problem.
It is used for solving classification
problems.
3 In this we predict the value of
continuous variables
In this we predict values of categorical
variables
4 In this we find best fit line. In this we find S-Curve .
18.
Linear Regression VsLogistic Regression
Machine Learning Department of Information Technology
Sr.
No.
Linear Regression Logistic Regression
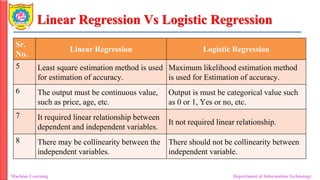
5 Least square estimation method is used
for estimation of accuracy.
Maximum likelihood estimation method
is used for Estimation of accuracy.
6 The output must be continuous value,
such as price, age, etc.
Output is must be categorical value such
as 0 or 1, Yes or no, etc.
7 It required linear relationship between
dependent and independent variables.
It not required linear relationship.
8 There may be collinearity between the
independent variables.
There should not be collinearity between
independent variable.
19.
Regularization
Machine Learning Departmentof Information Technology
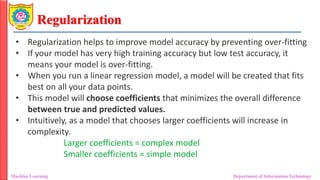
• Regularization helps to improve model accuracy by preventing over-fitting
• If your model has very high training accuracy but low test accuracy, it
means your model is over-fitting.
• When you run a linear regression model, a model will be created that fits
best on all your data points.
• This model will choose coefficients that minimizes the overall difference
between true and predicted values.
• Intuitively, as a model that chooses larger coefficients will increase in
complexity.
Larger coefficients = complex model
Smaller coefficients = simple model
20.
Regularization
Machine Learning Departmentof Information Technology
• To mitigate over-fitting, we need to force the model to choose smaller
coefficients.
• We can do this by employing a technique called “Regularization”.
• Regularization is a process that discourages the model from becoming
overly complex.
• It does this by punishing models that choose large coefficients.
• Regularization makes models less sensitive to small fluctuations in the
training data, leading to more stable and reliable predictions.
• Two Types:
• Ridge Regression
• Lasso Regression
21.
Regularization
Machine Learning Departmentof Information Technology
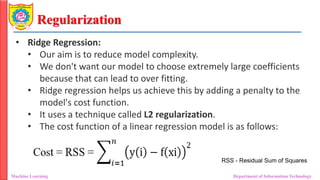
• Ridge Regression:
• Our aim is to reduce model complexity.
• We don't want our model to choose extremely large coefficients
because that can lead to over fitting.
• Ridge regression helps us achieve this by adding a penalty to the
model's cost function.
• It uses a technique called L2 regularization.
• The cost function of a linear regression model is as follows:
RSS - Residual Sum of Squares
22.
Regularization
Machine Learning Departmentof Information Technology
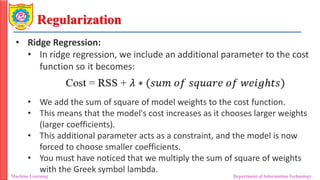
• Ridge Regression:
• In ridge regression, we include an additional parameter to the cost
function so it becomes:
• We add the sum of square of model weights to the cost function.
• This means that the model's cost increases as it chooses larger weights
(larger coefficients).
• This additional parameter acts as a constraint, and the model is now
forced to choose smaller coefficients.
• You must have noticed that we multiply the sum of square of weights
with the Greek symbol lambda.
23.
Regularization
Machine Learning Departmentof Information Technology
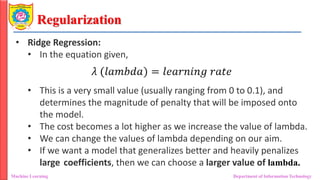
• Ridge Regression:
• In the equation given,
• This is a very small value (usually ranging from 0 to 0.1), and
determines the magnitude of penalty that will be imposed onto
the model.
• The cost becomes a lot higher as we increase the value of lambda.
• We can change the values of lambda depending on our aim.
• If we want a model that generalizes better and heavily penalizes
large coefficients, then we can choose a larger value of lambda.
Regularization
Machine Learning Departmentof Information Technology
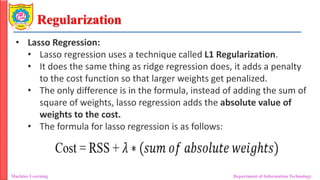
• Lasso Regression:
• Lasso regression uses a technique called L1 Regularization.
• It does the same thing as ridge regression does, it adds a penalty
to the cost function so that larger weights get penalized.
• The only difference is in the formula, instead of adding the sum of
square of weights, lasso regression adds the absolute value of
weights to the cost.
• The formula for lasso regression is as follows:
27.
Regularization
Machine Learning Departmentof Information Technology
• Lasso Regression:
• It works similar to ridge regression it terms of mitigating over
fitting, except that it takes the absolute weights instead of the
square weights.
• If you want to perform linear regression on a high dimensional
dataset, lasso regression can help you narrow down and eliminate
some features.
• Both ridge and lasso regression will help shrink coefficients, and
minimize feature weights.
• However, if the value of lambda is large enough, lasso regression
can sometimes pull feature weights down to zero.
28.
Regularization
Machine Learning Departmentof Information Technology
• Lasso Regression:
• When the coefficient of a feature gets pulled down to zero, that
coefficient is eliminated from the model.
• This way, lasso regression can help eliminate unnecessary features
from your model.
• It should be noted that ridge regression does not set coefficients
to zero, so it can't be used to eliminate features the way lasso
regression can.