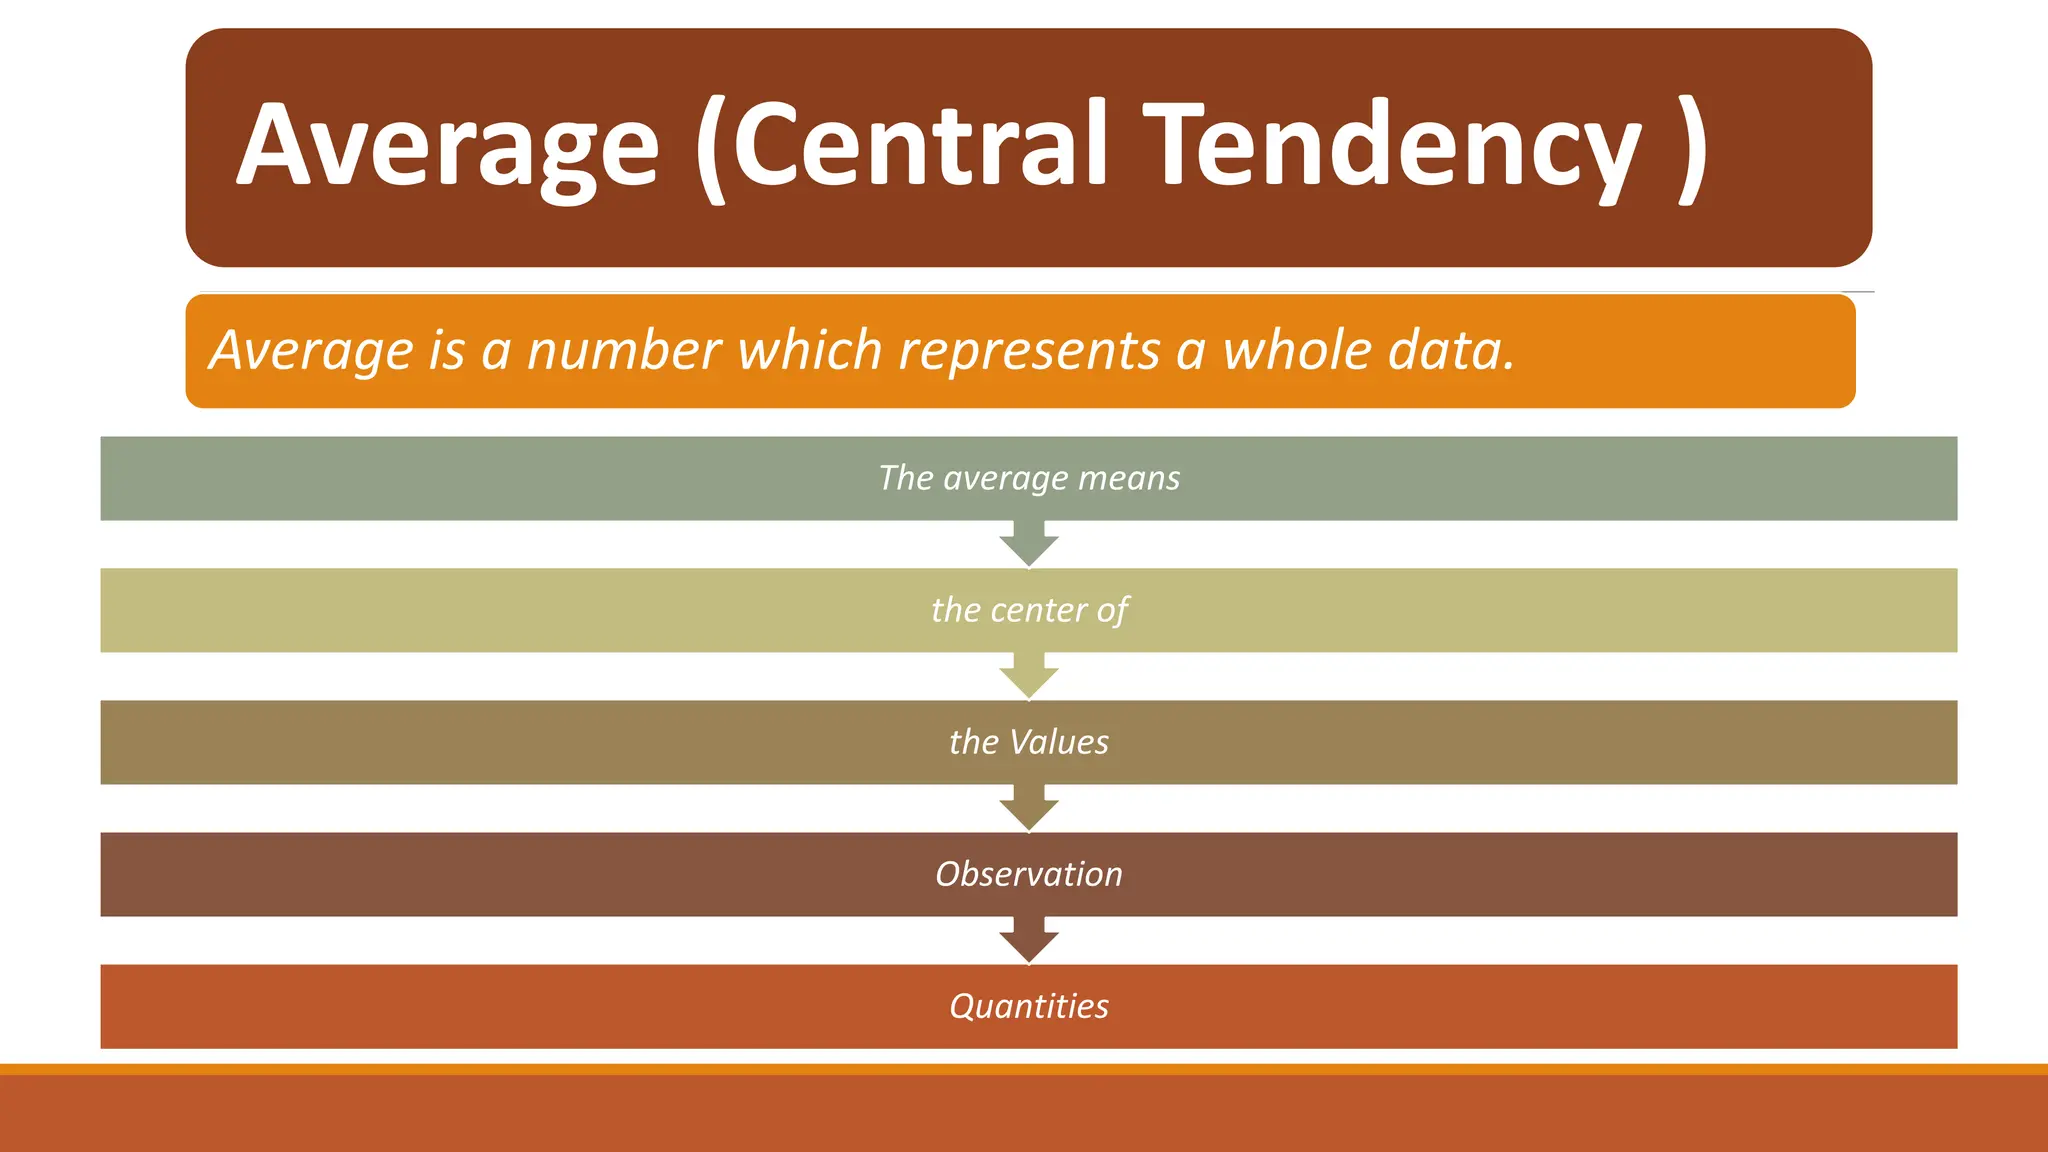
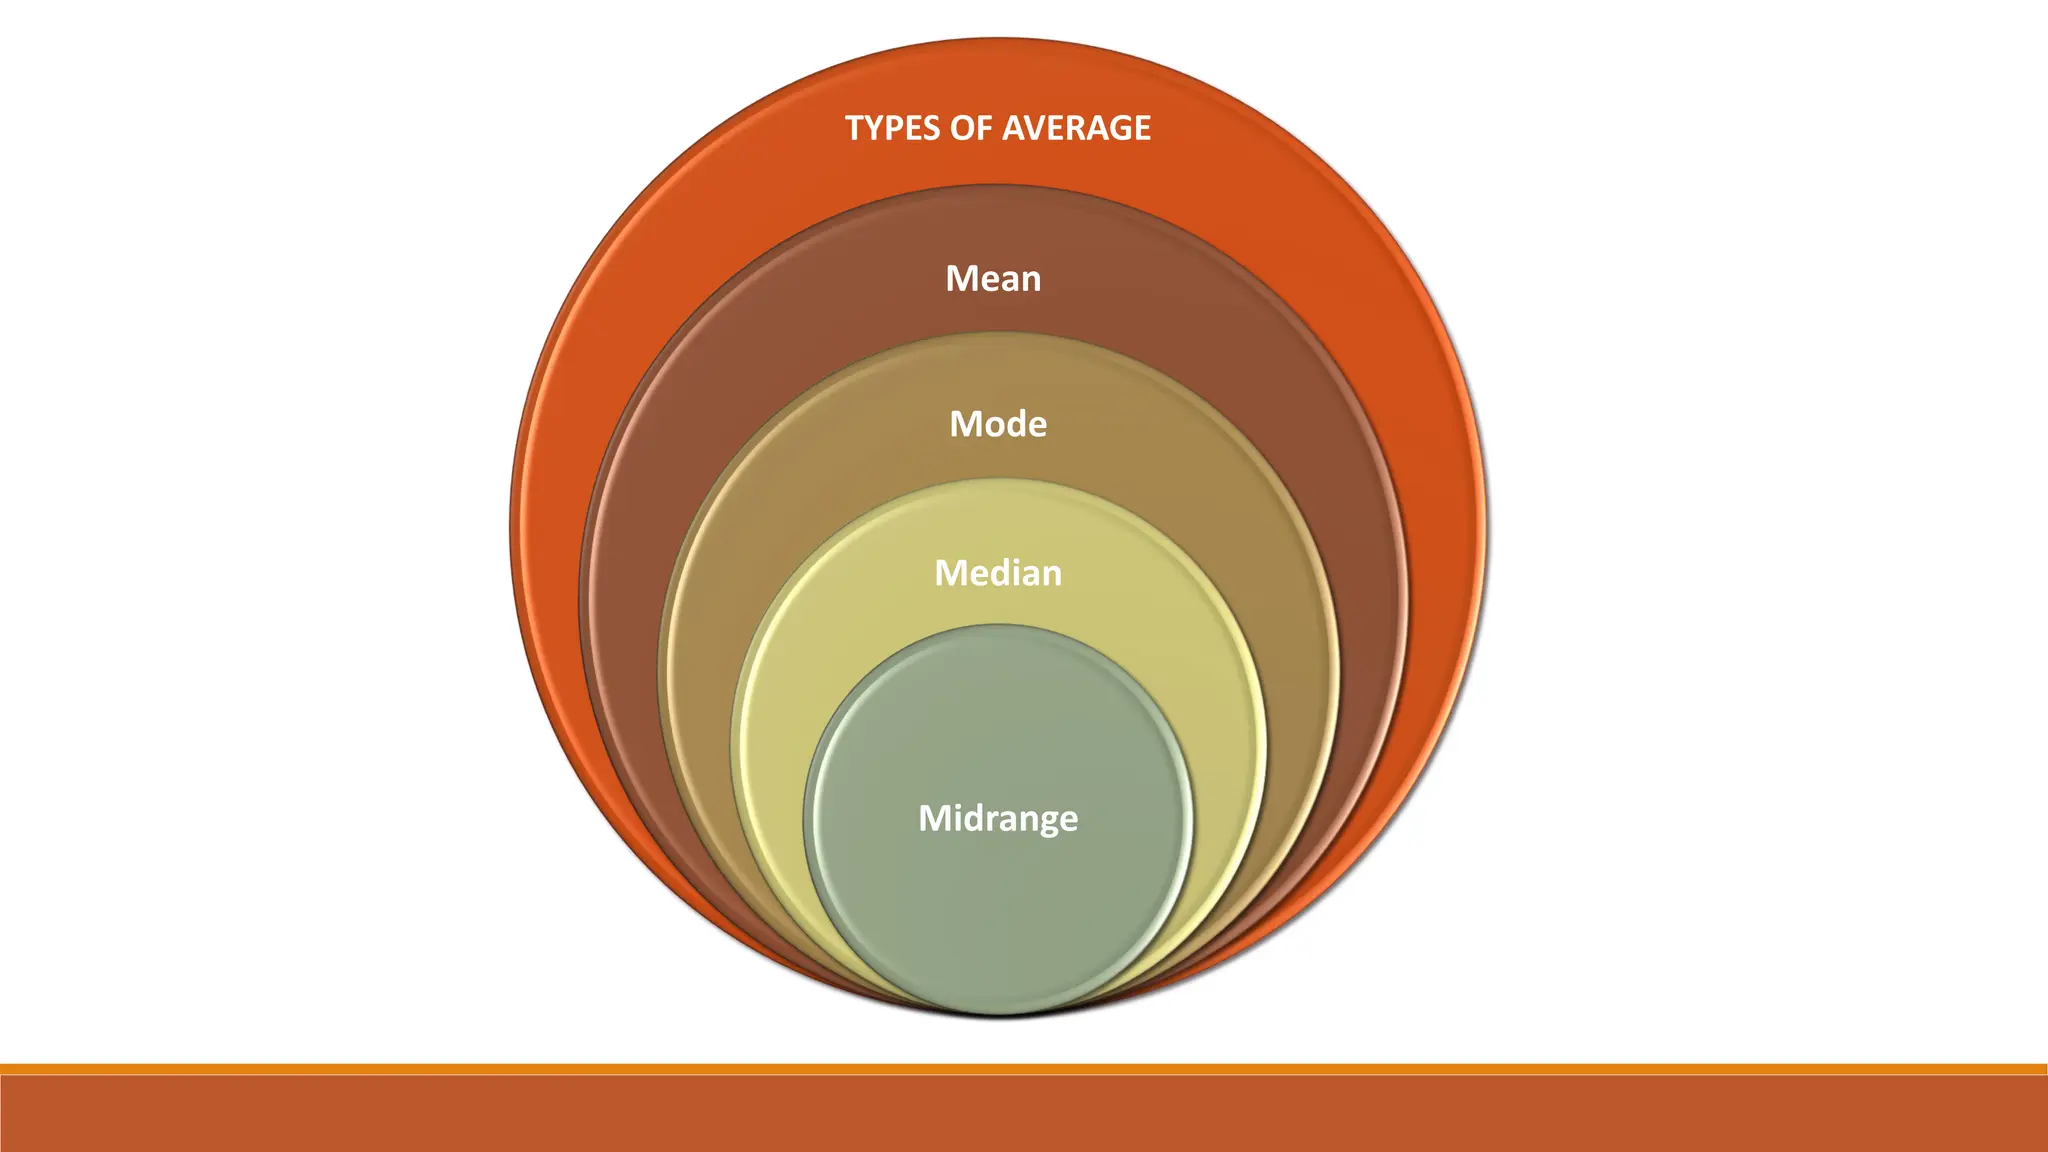
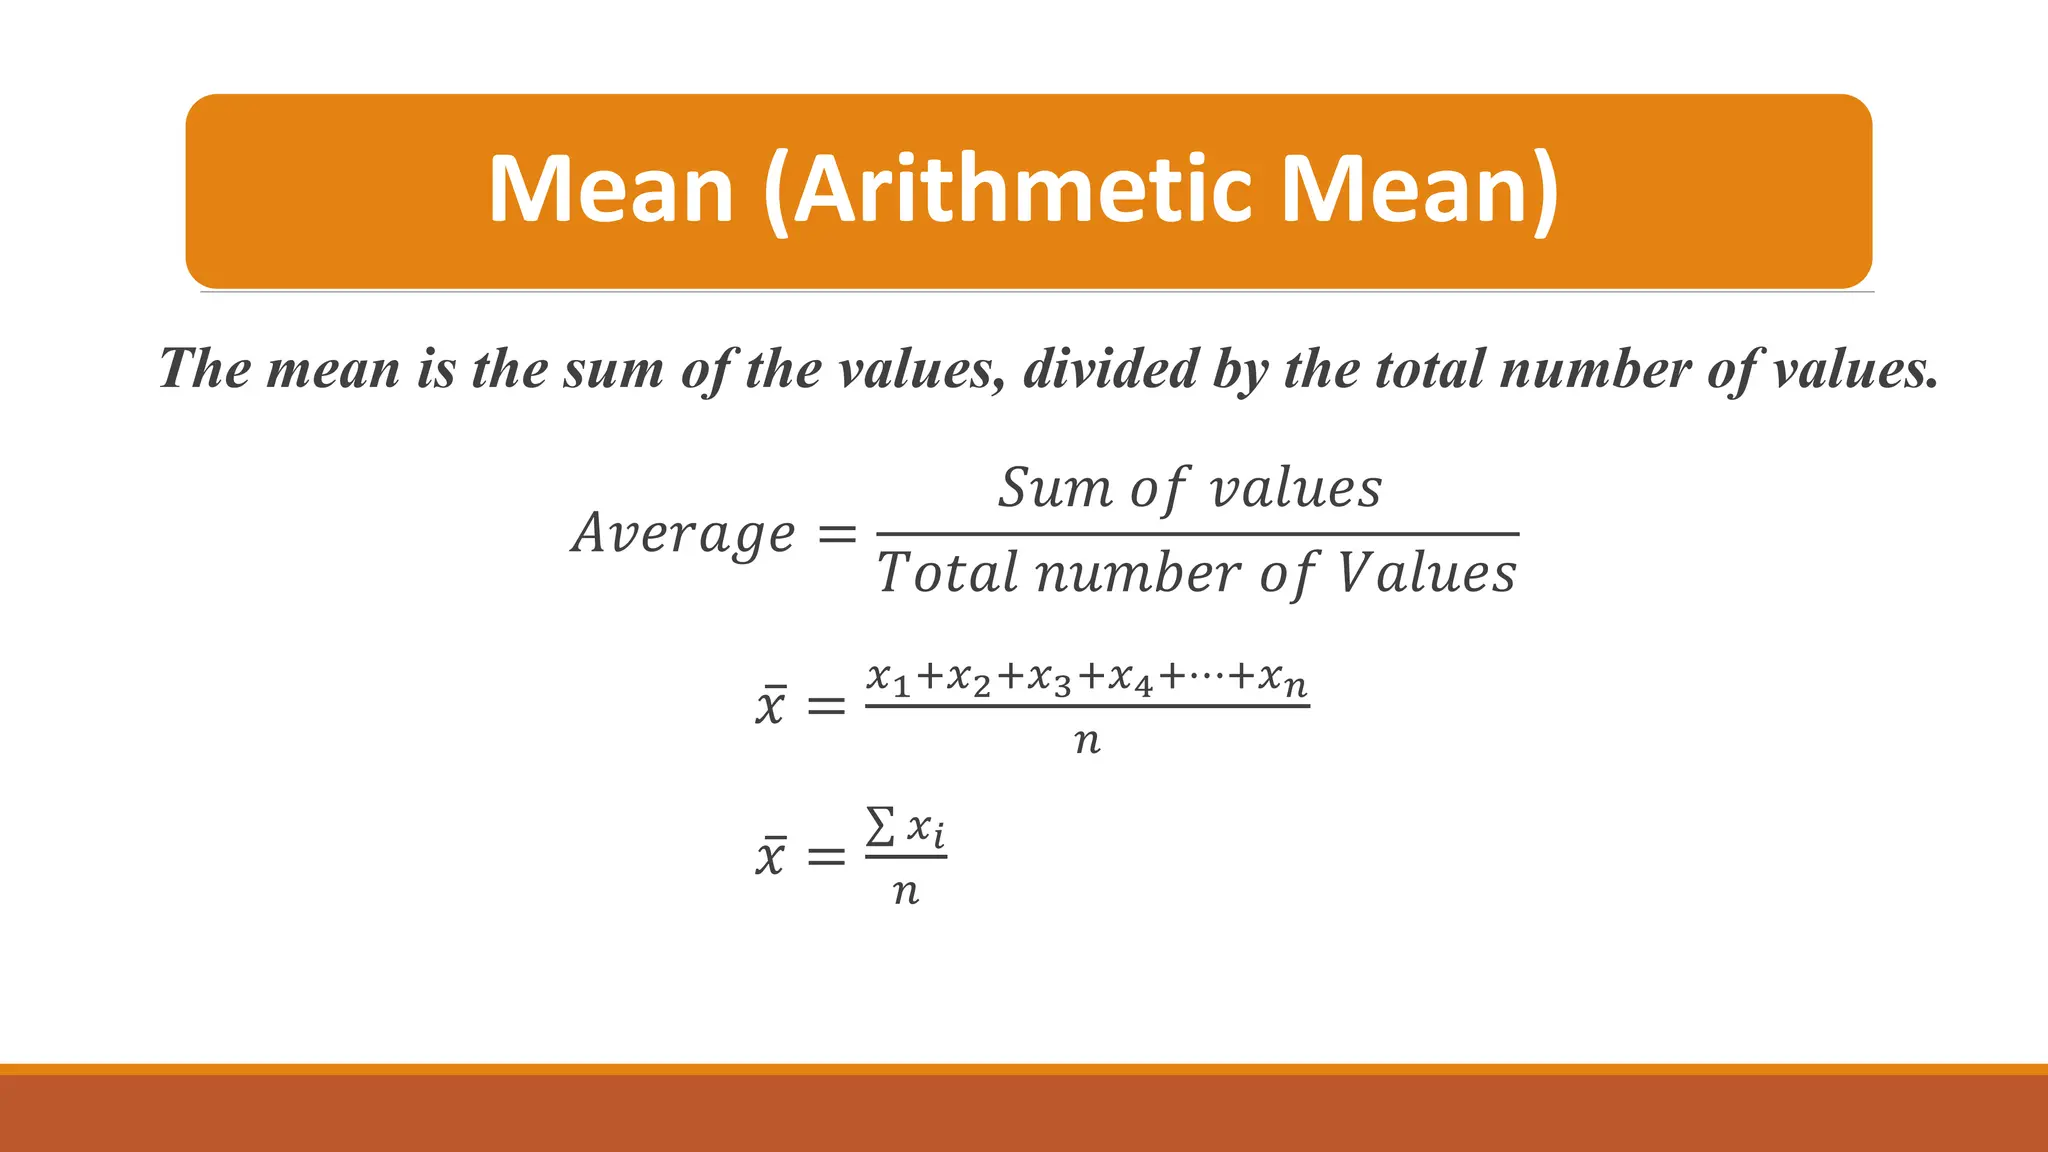
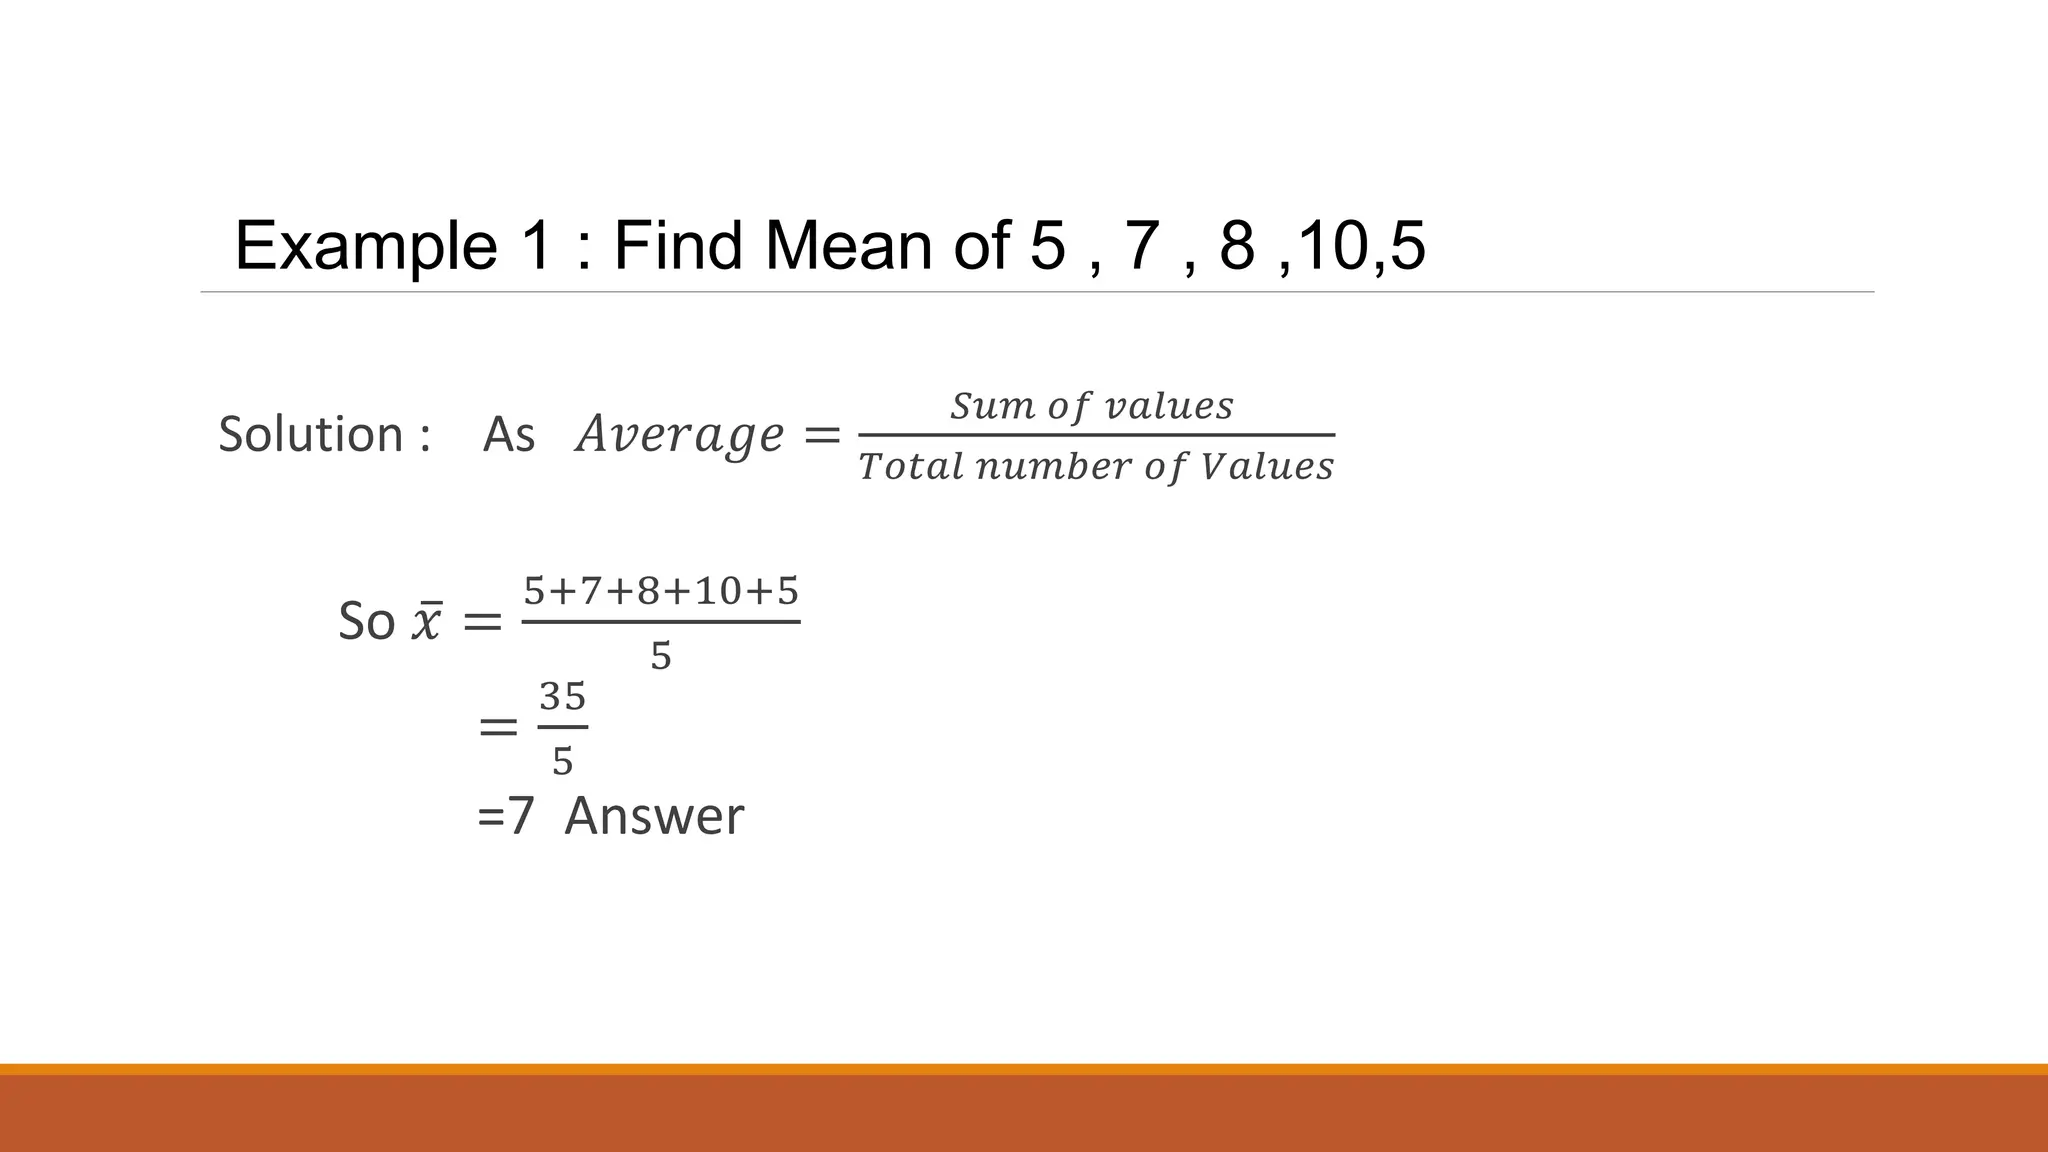
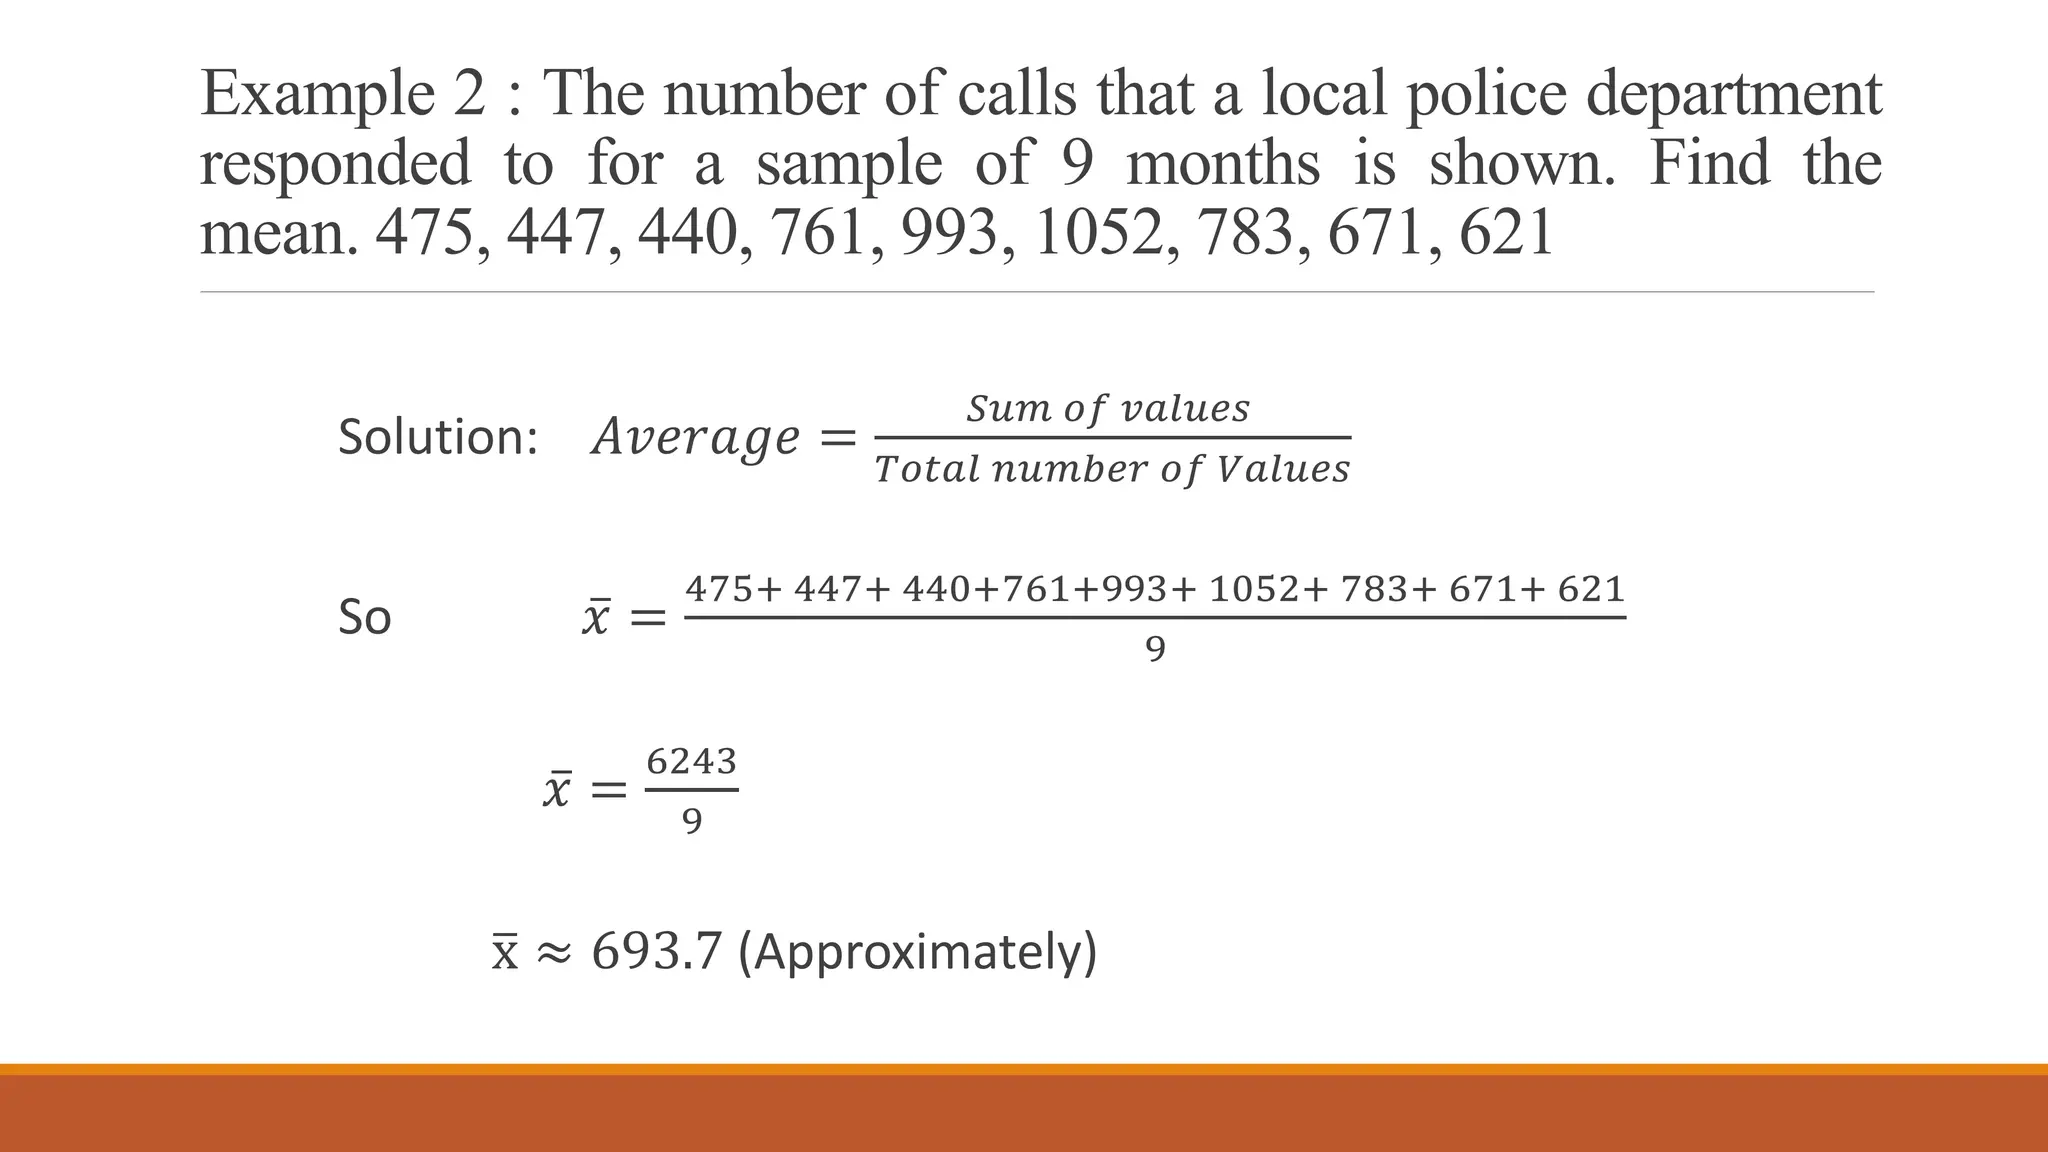
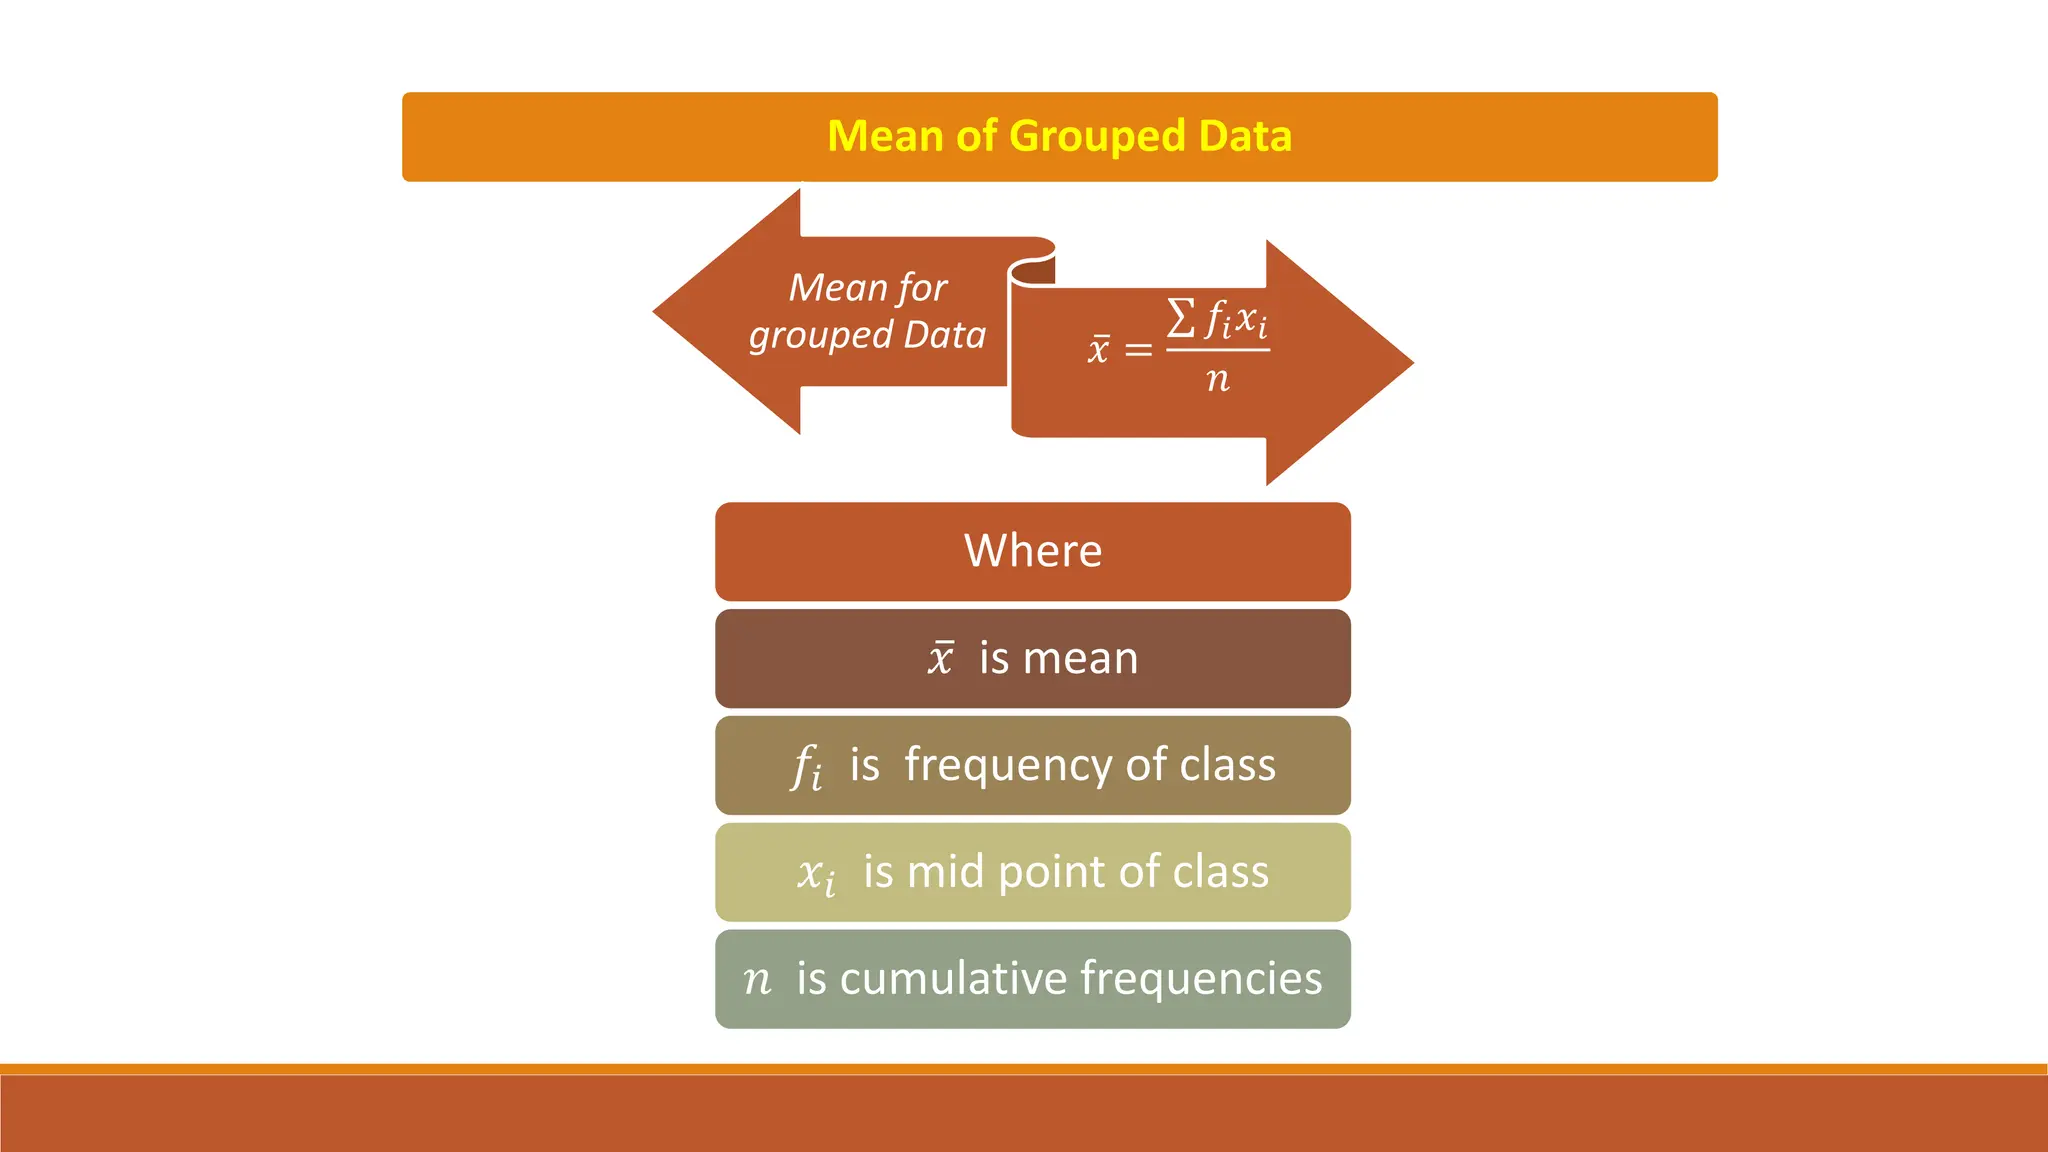
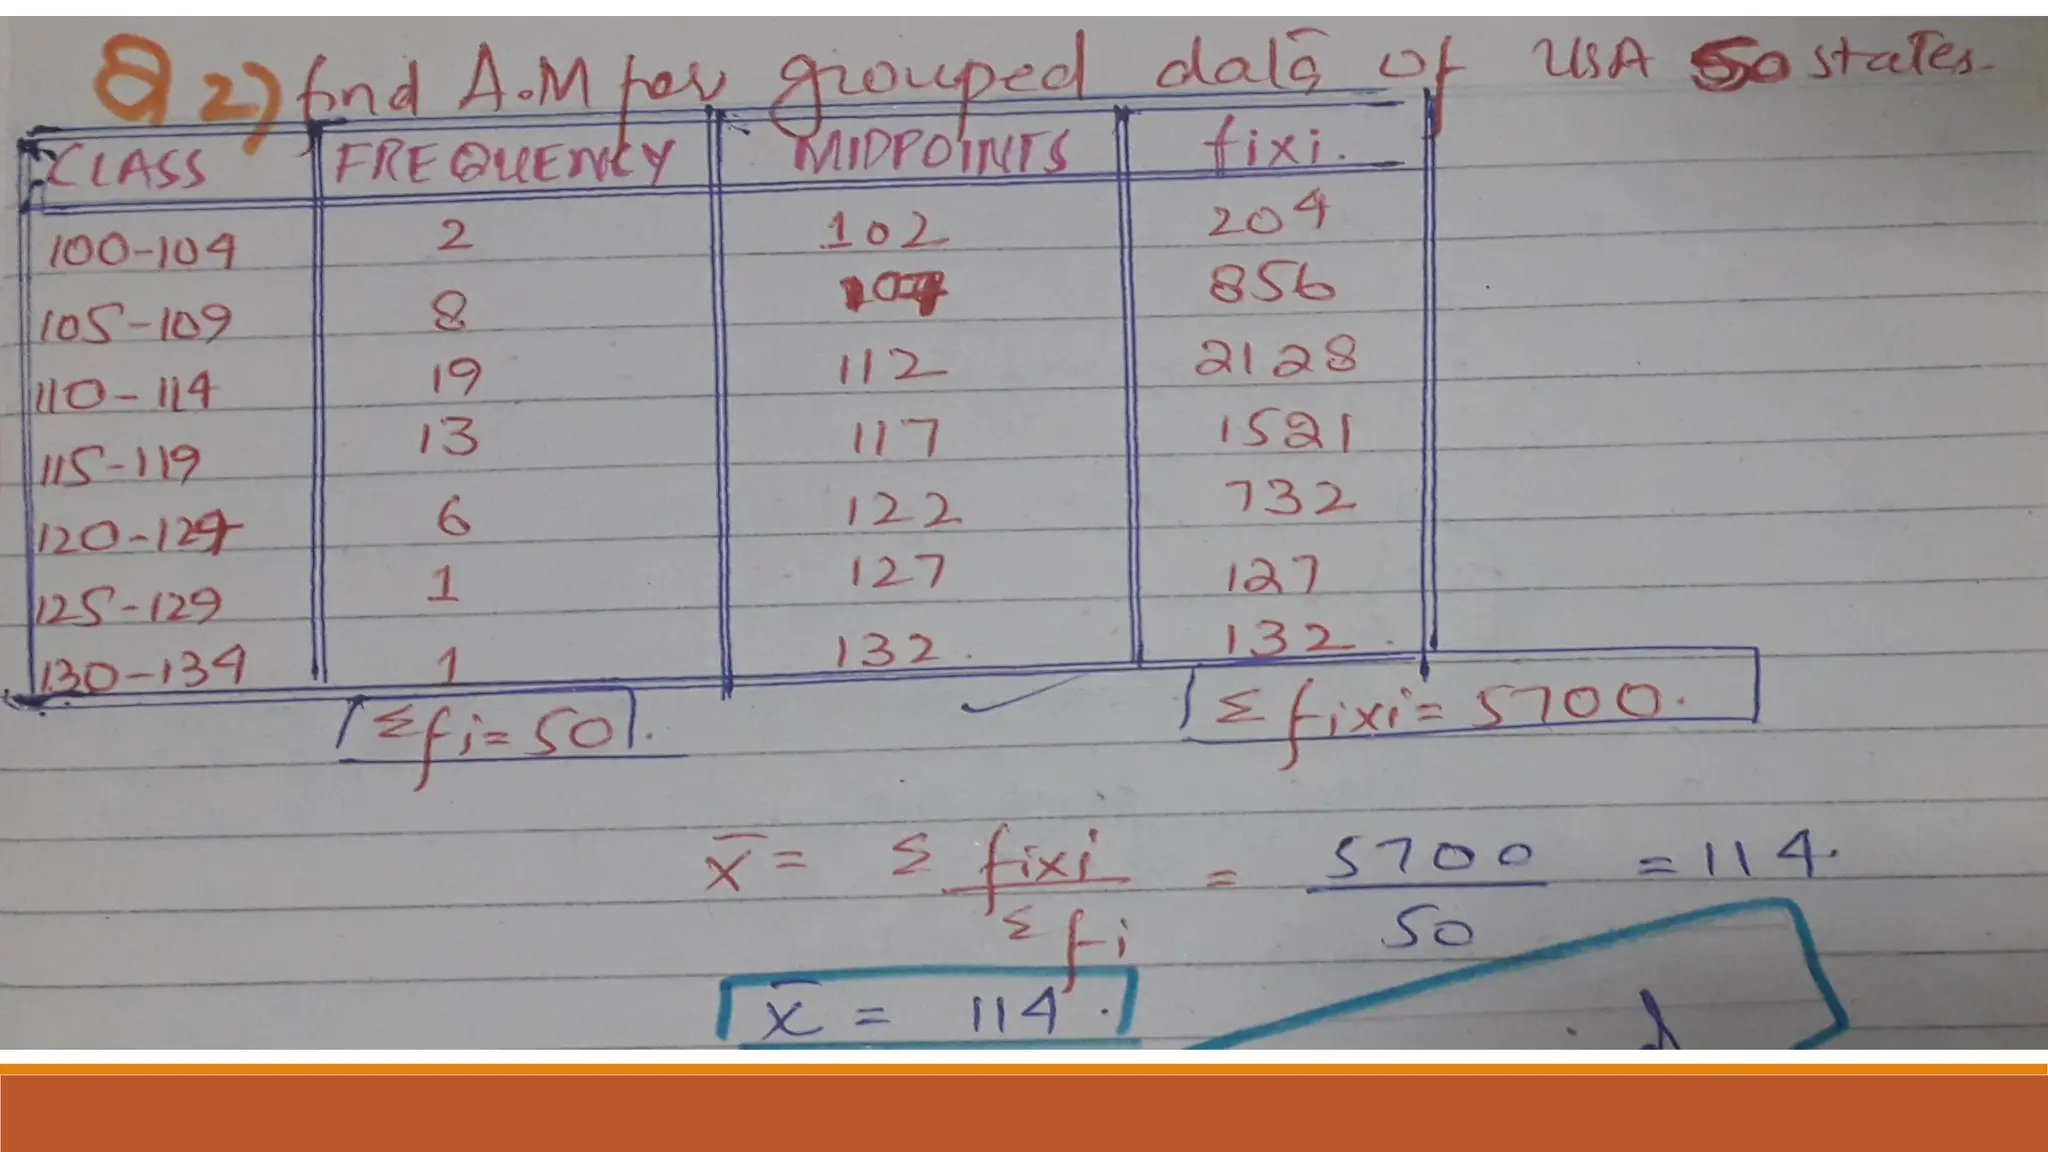
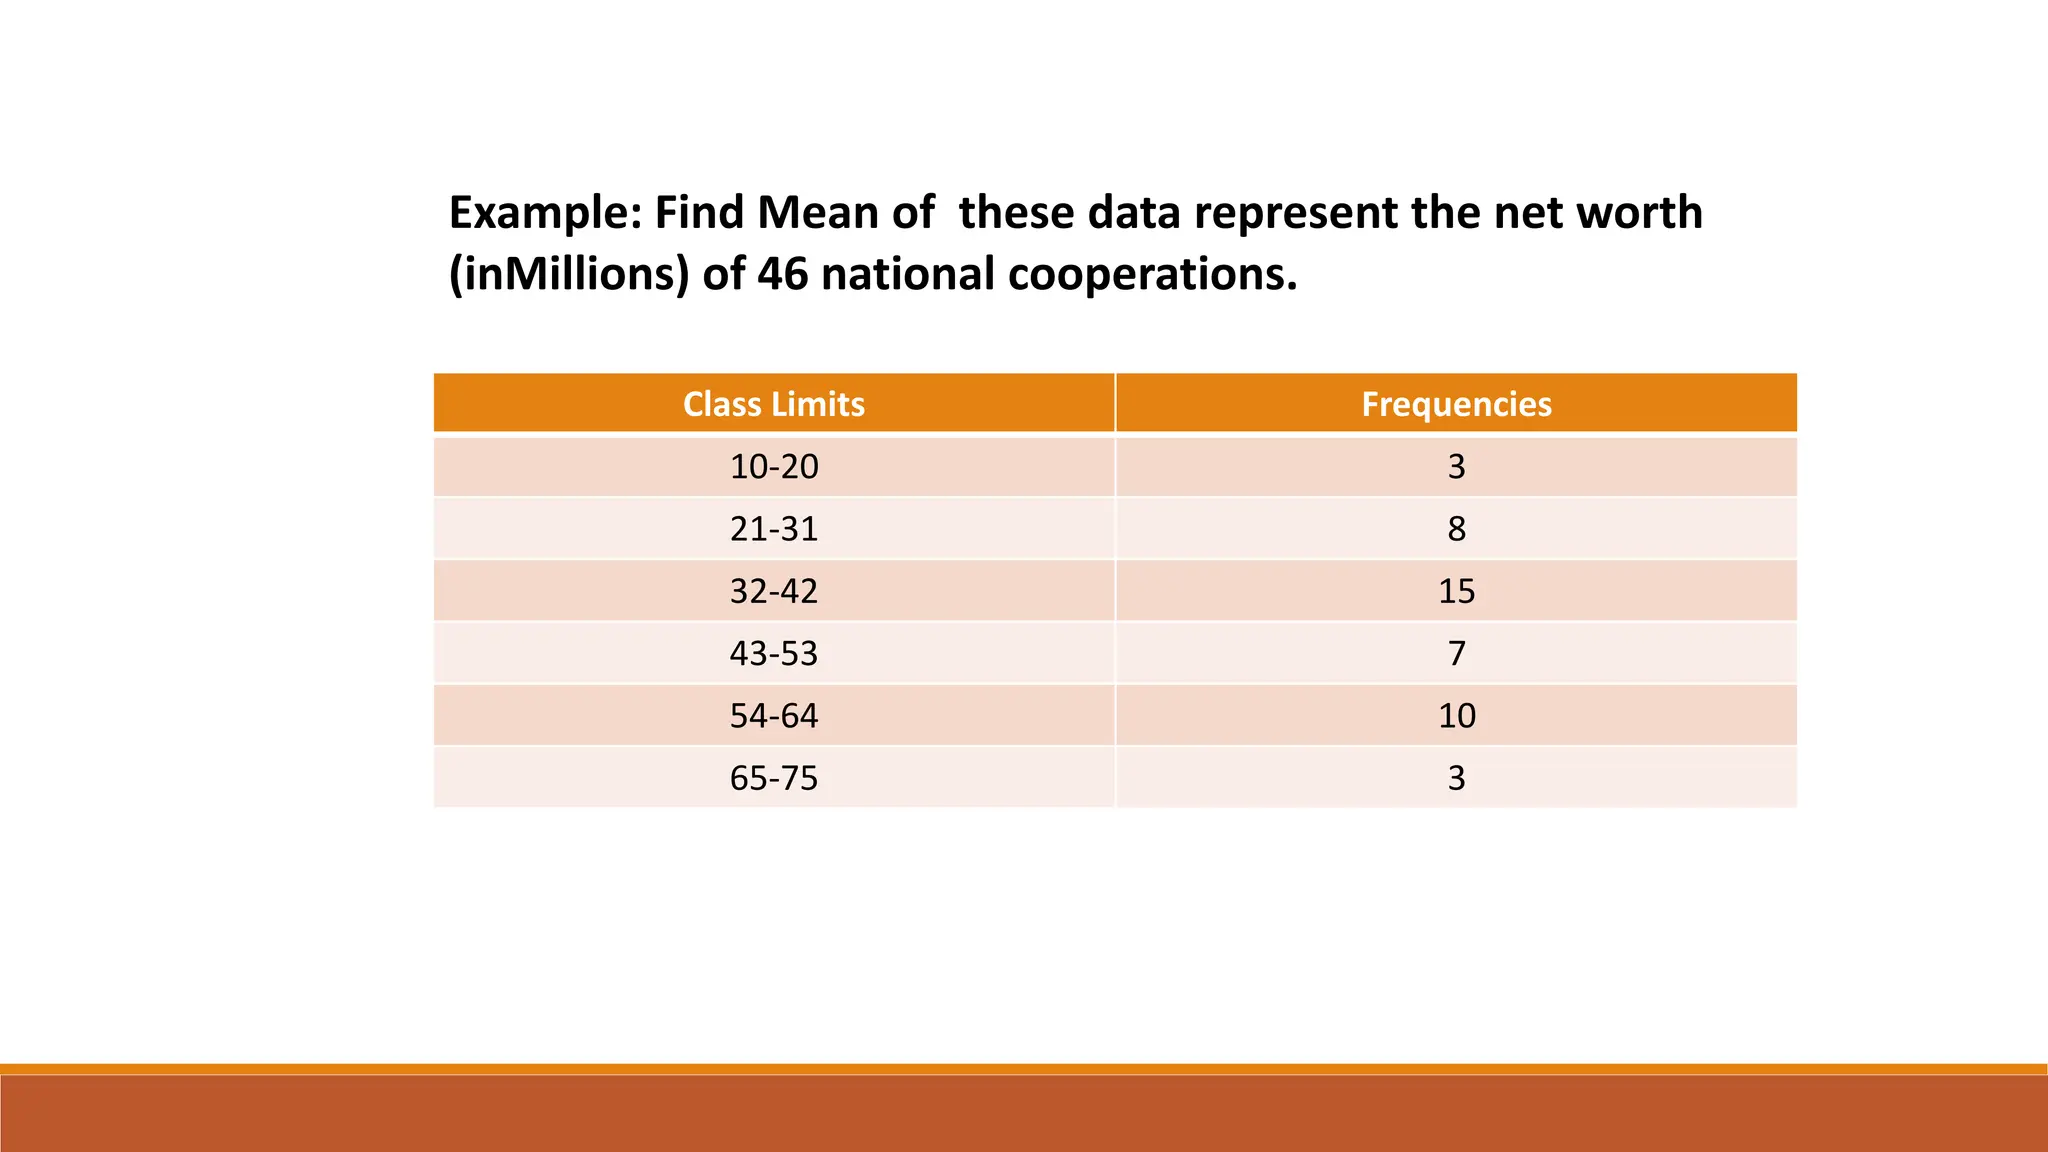
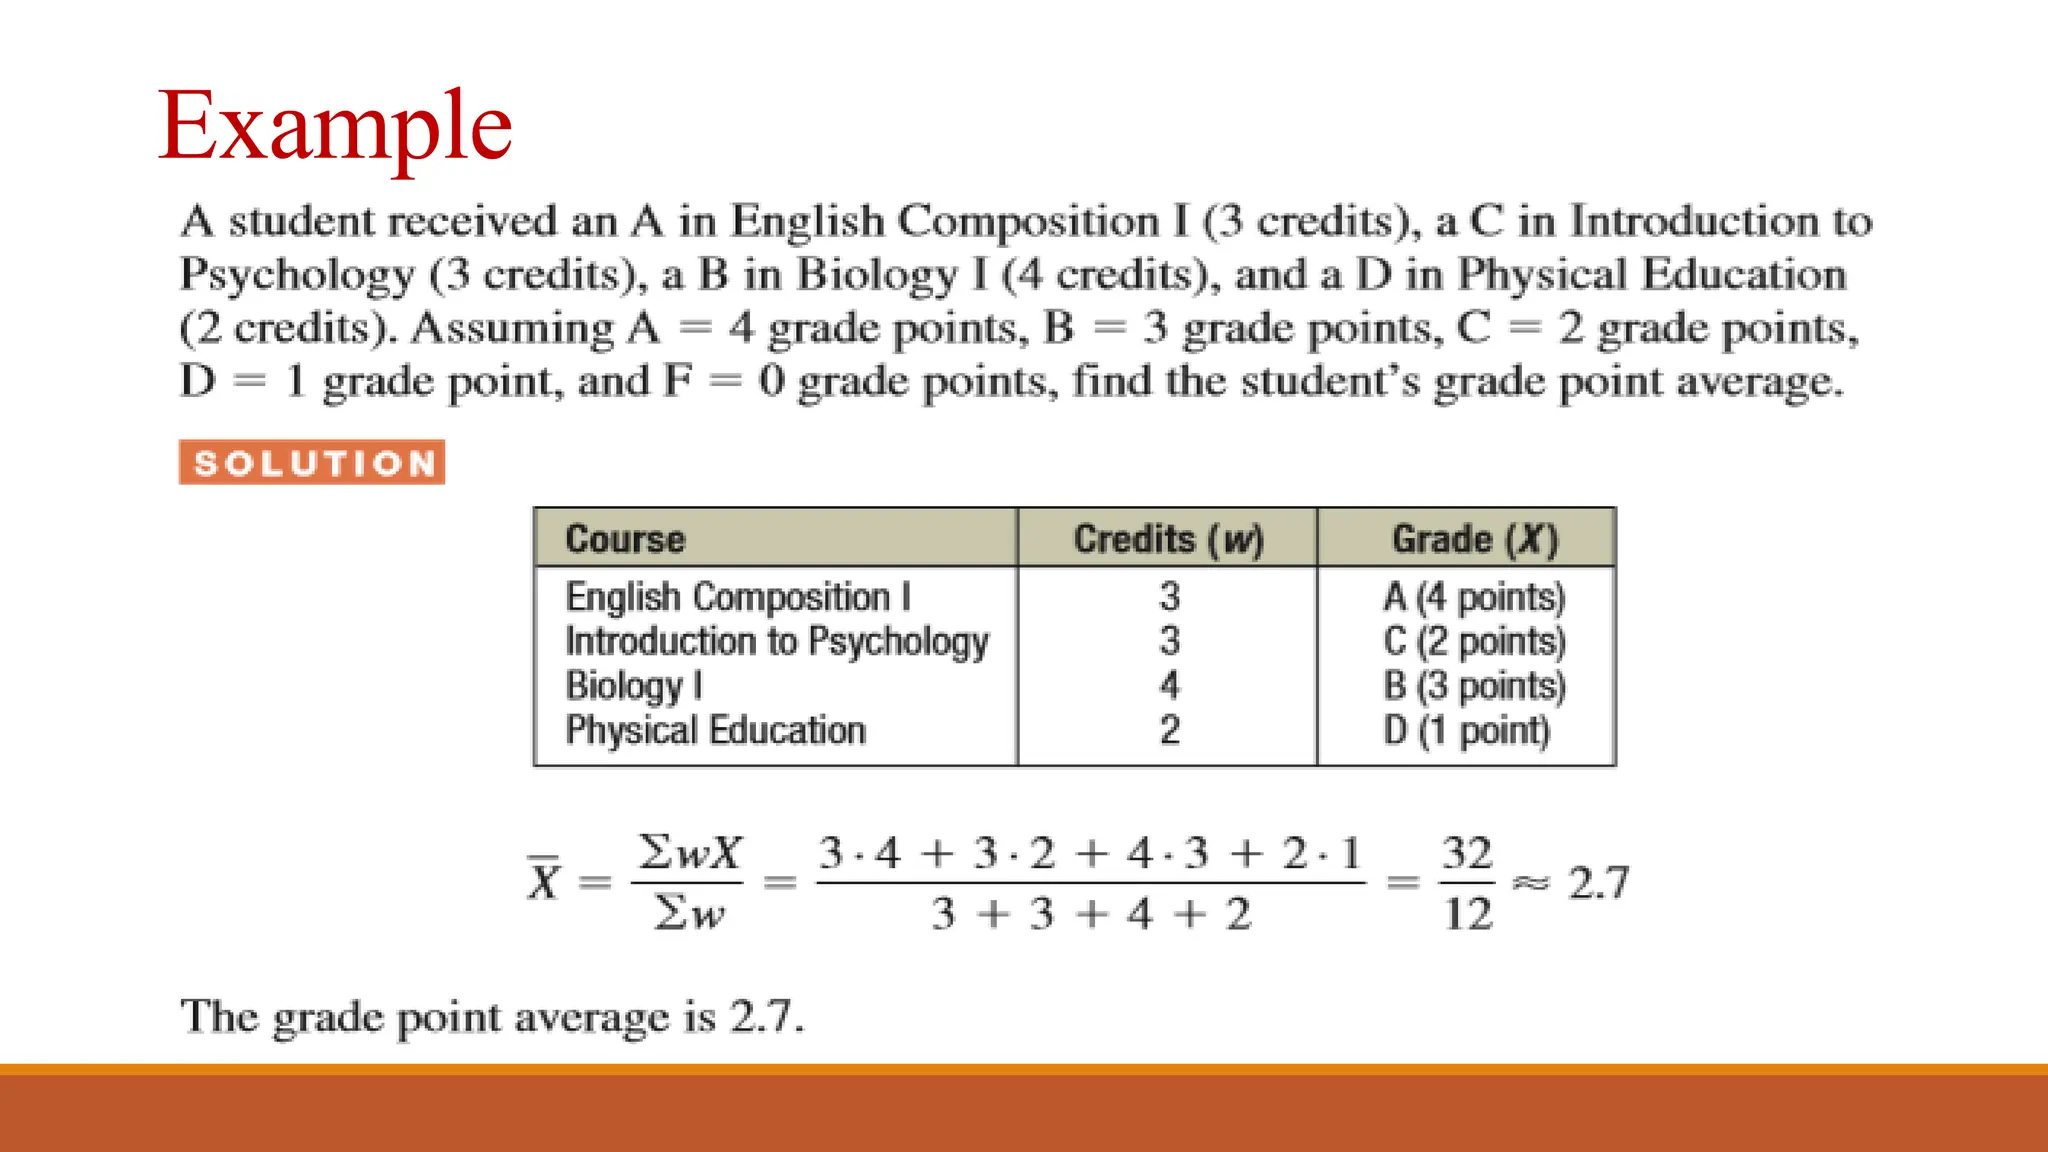
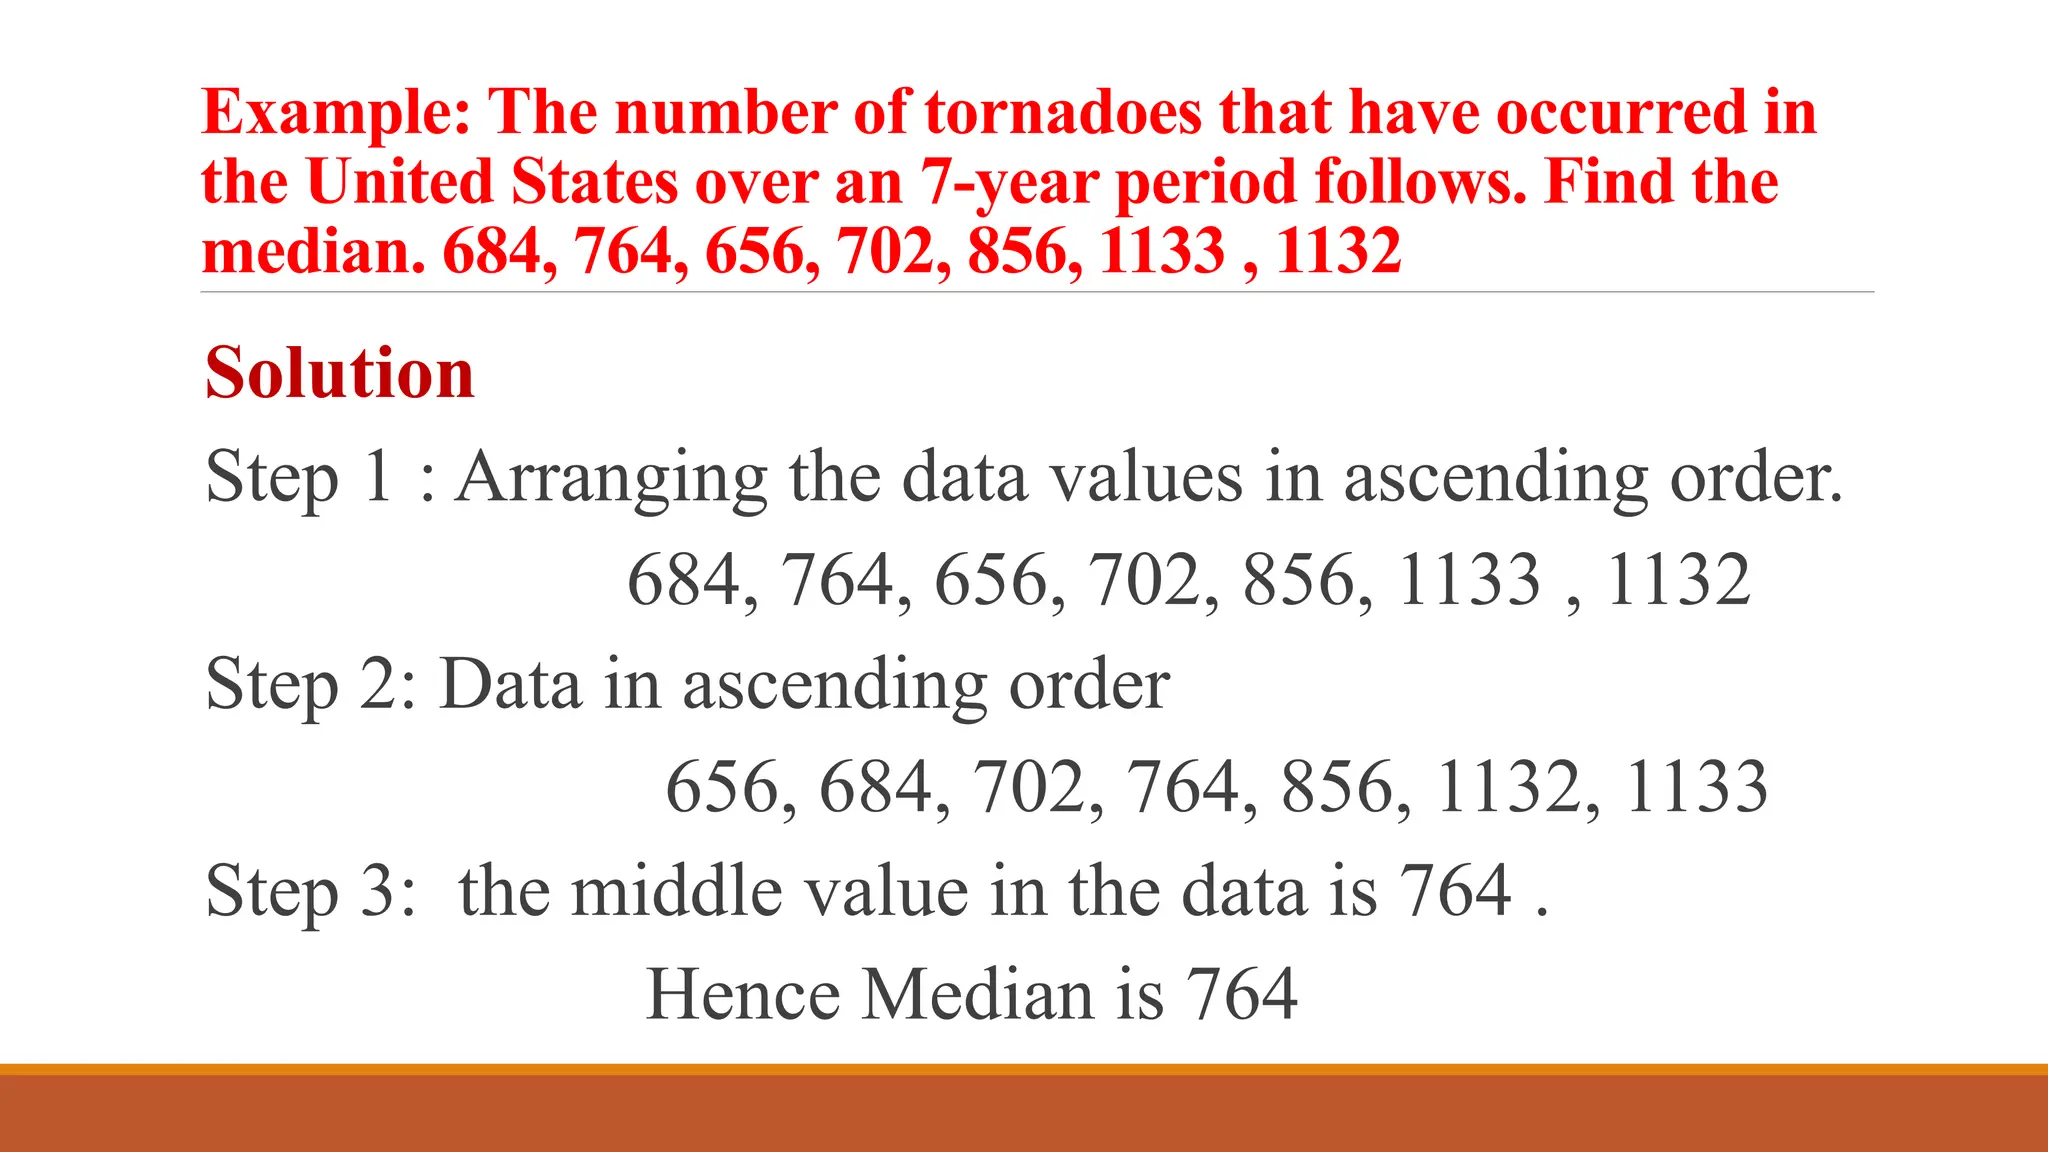
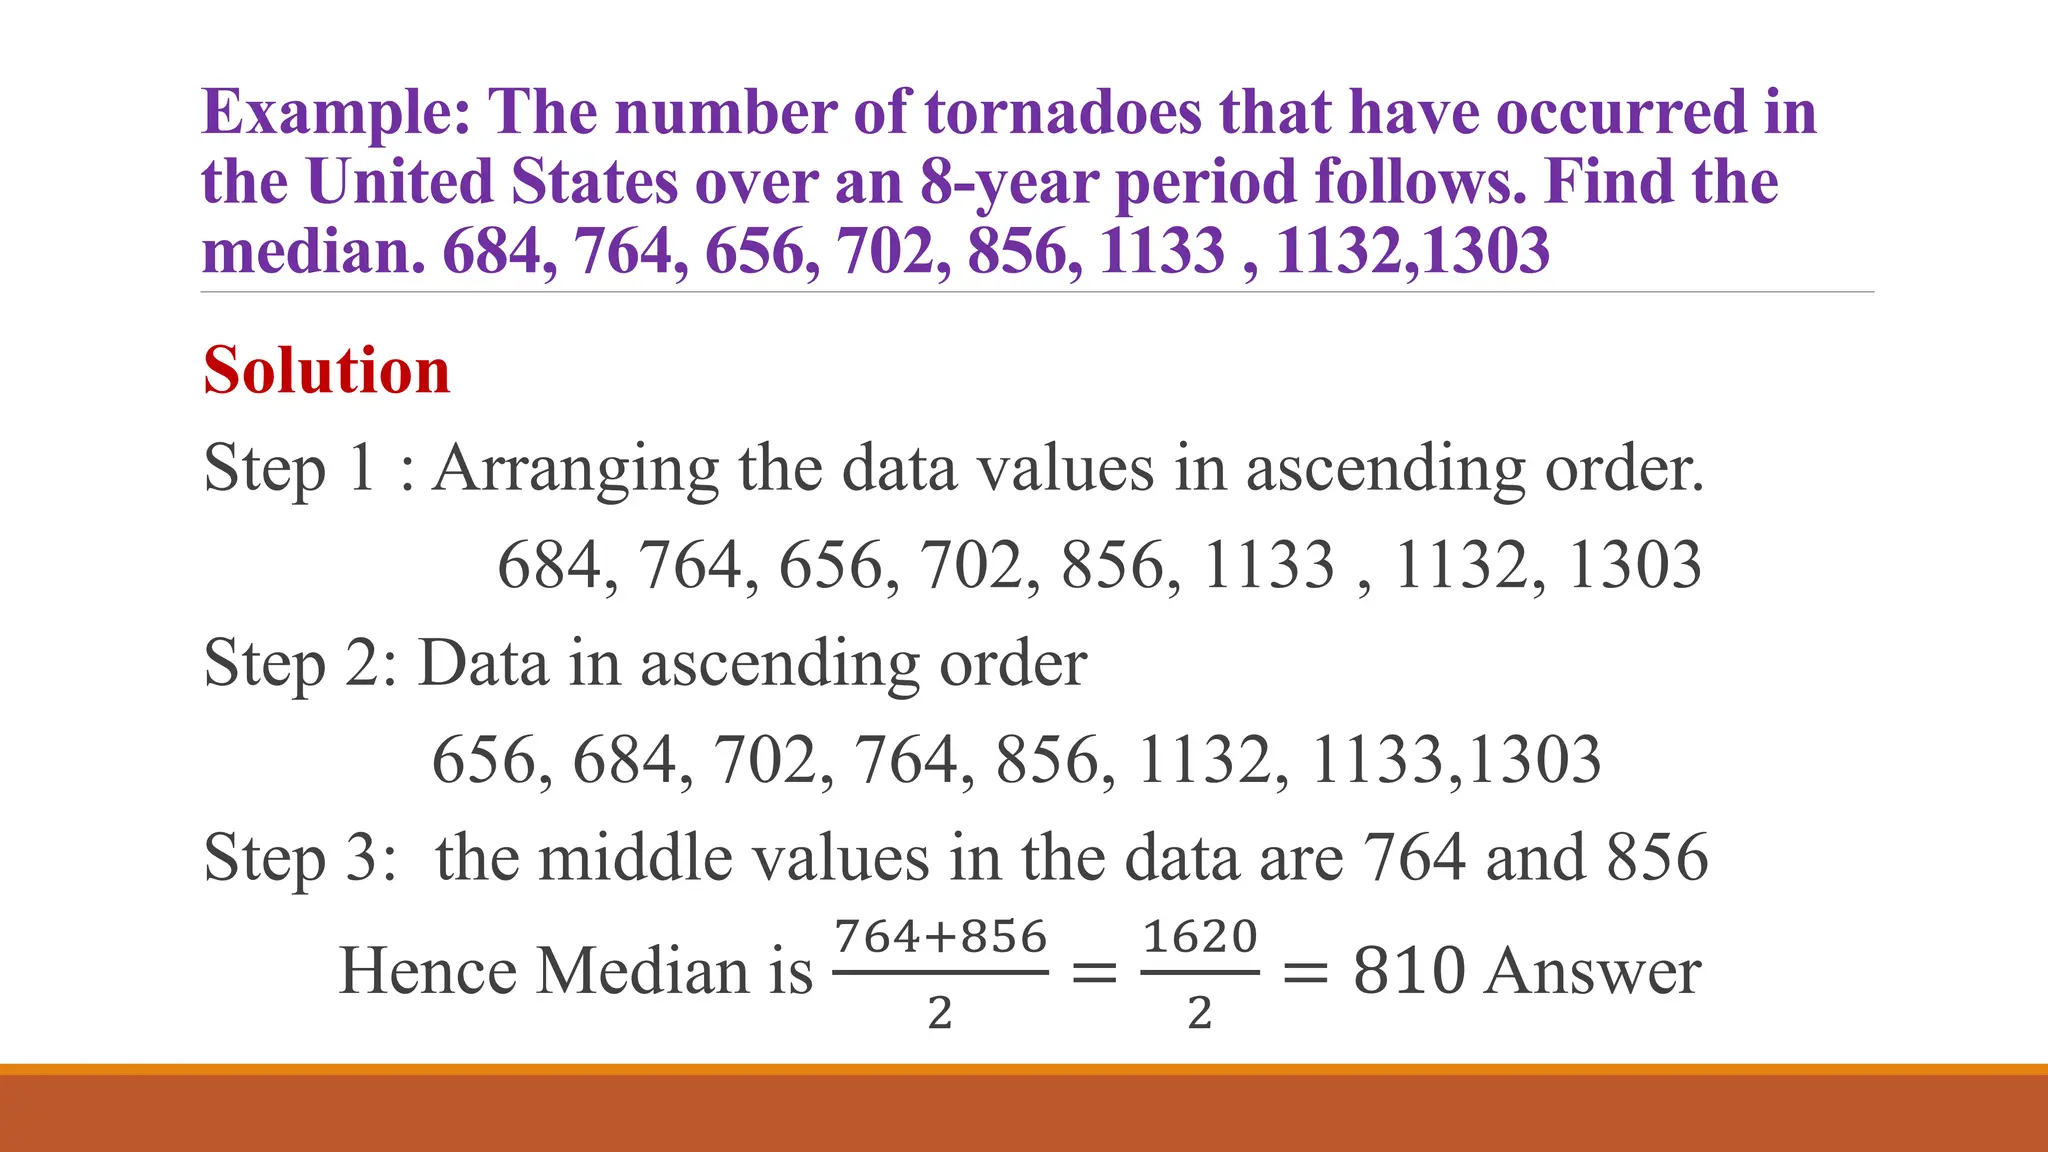
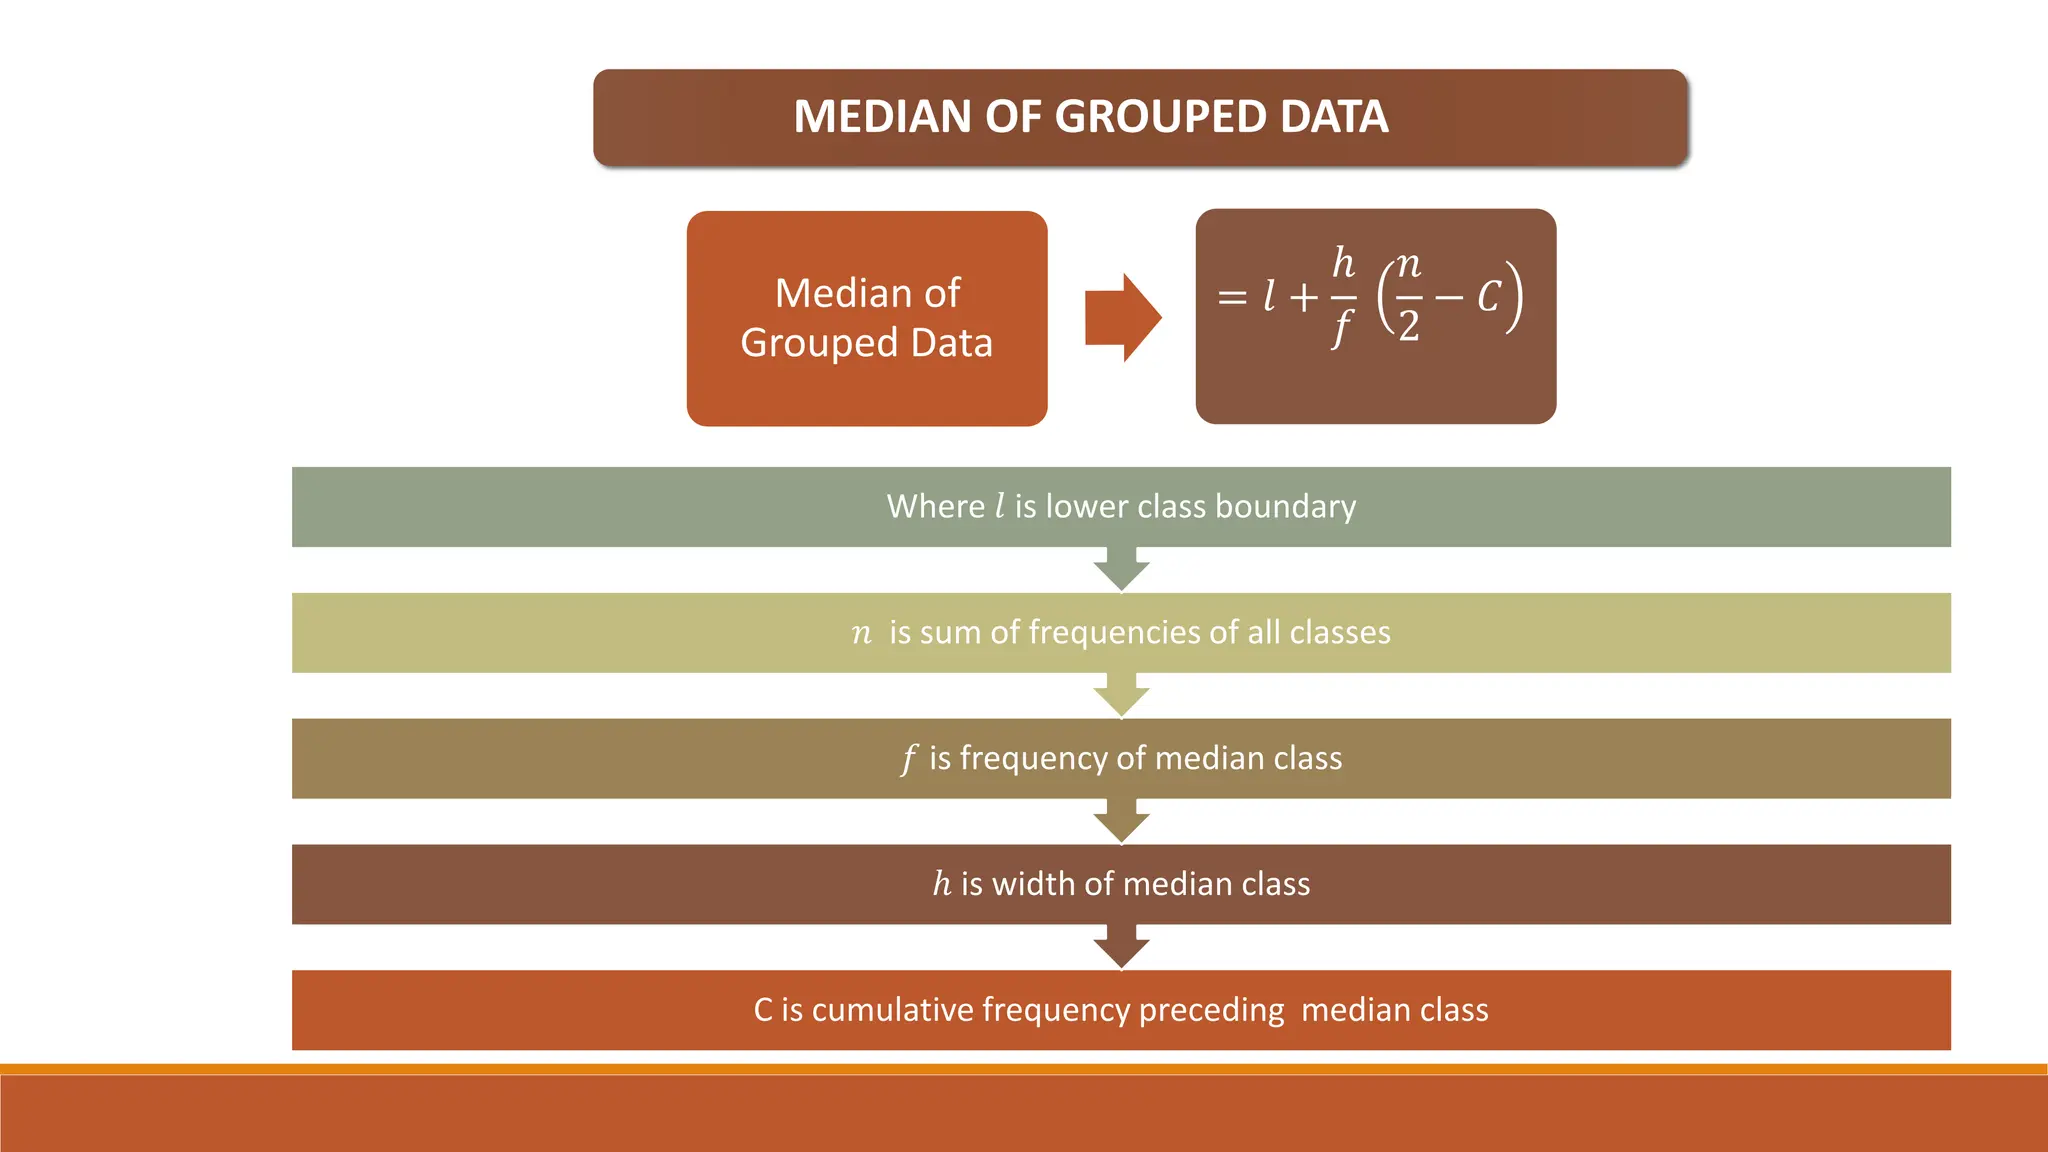
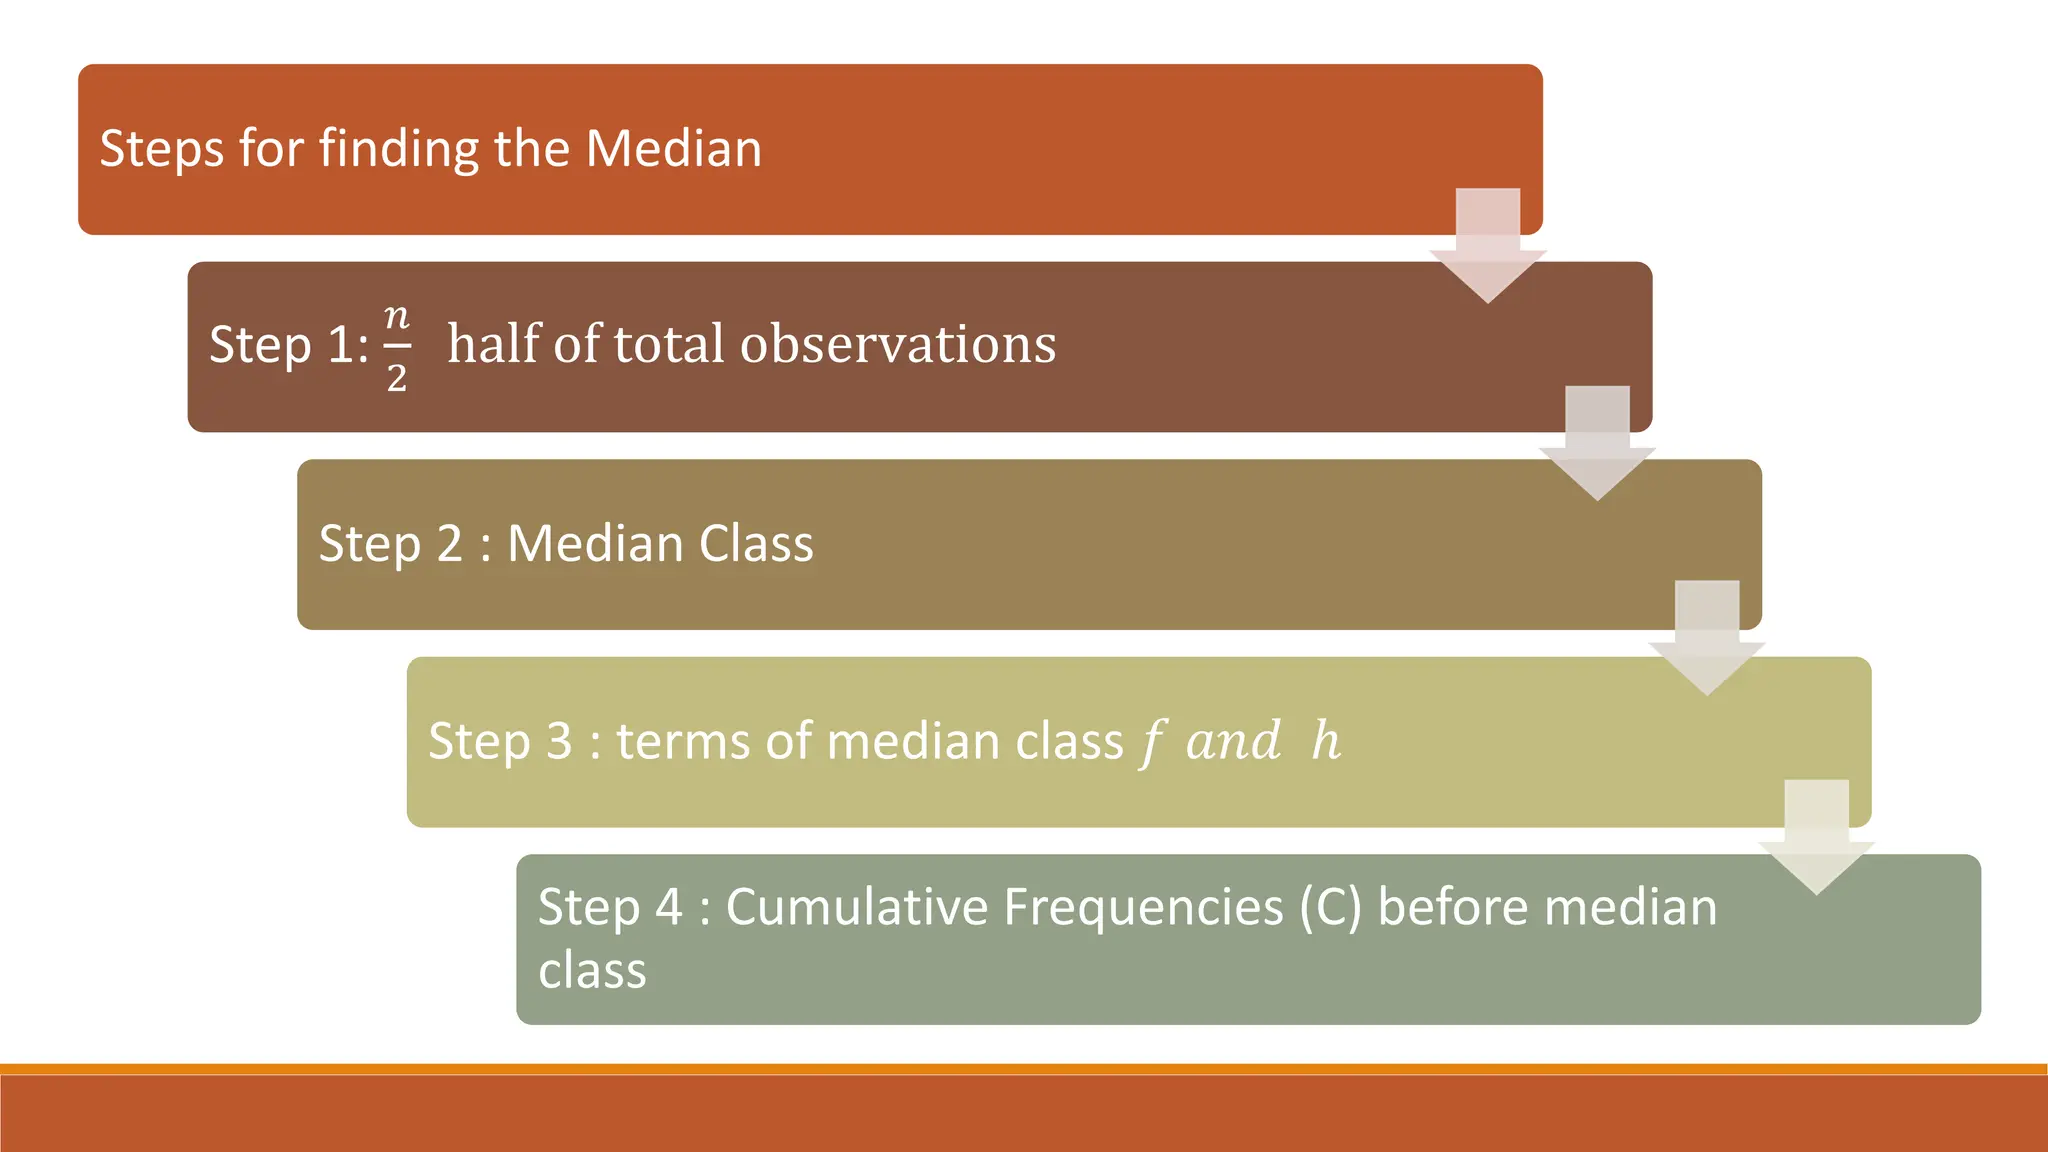
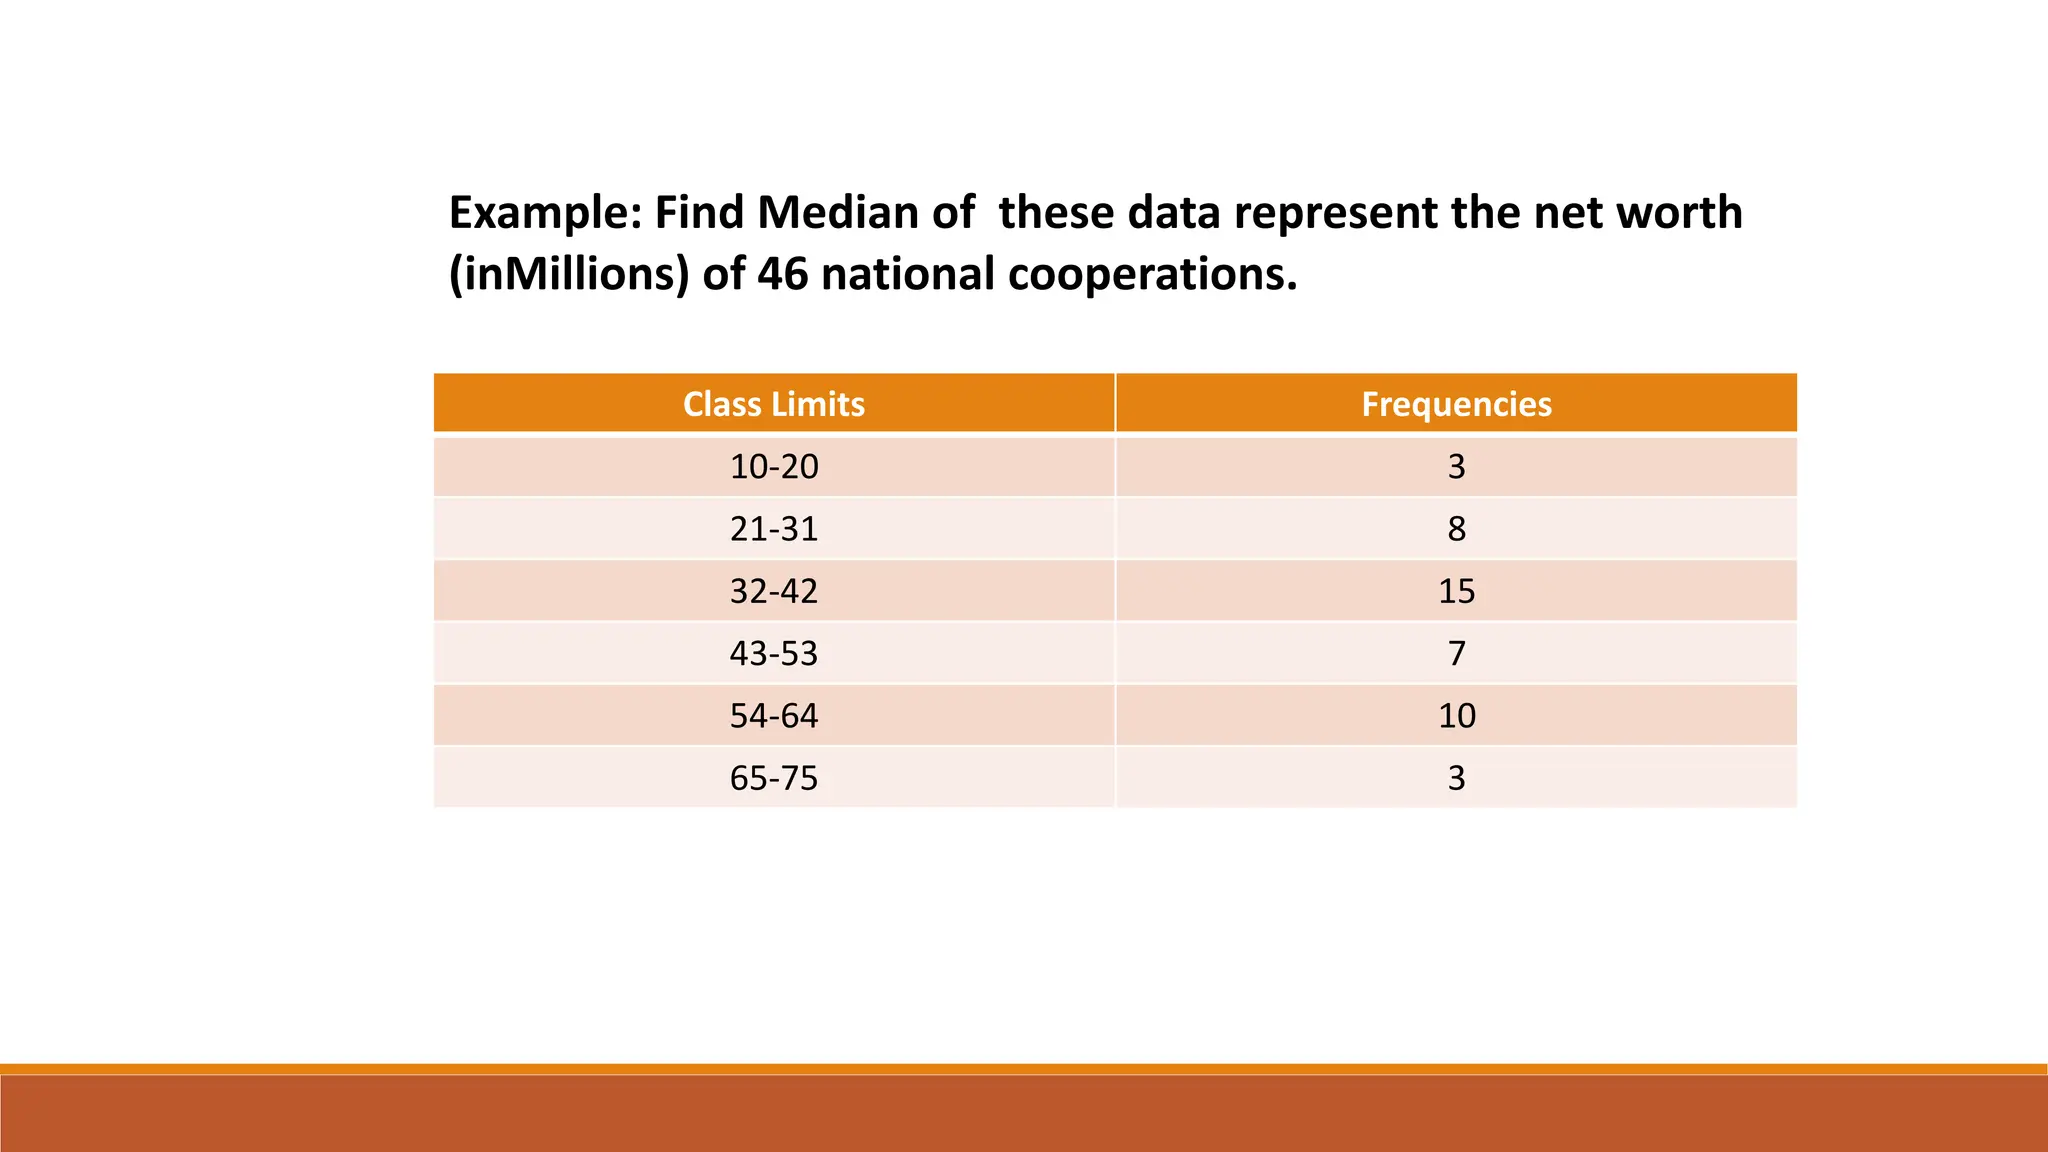
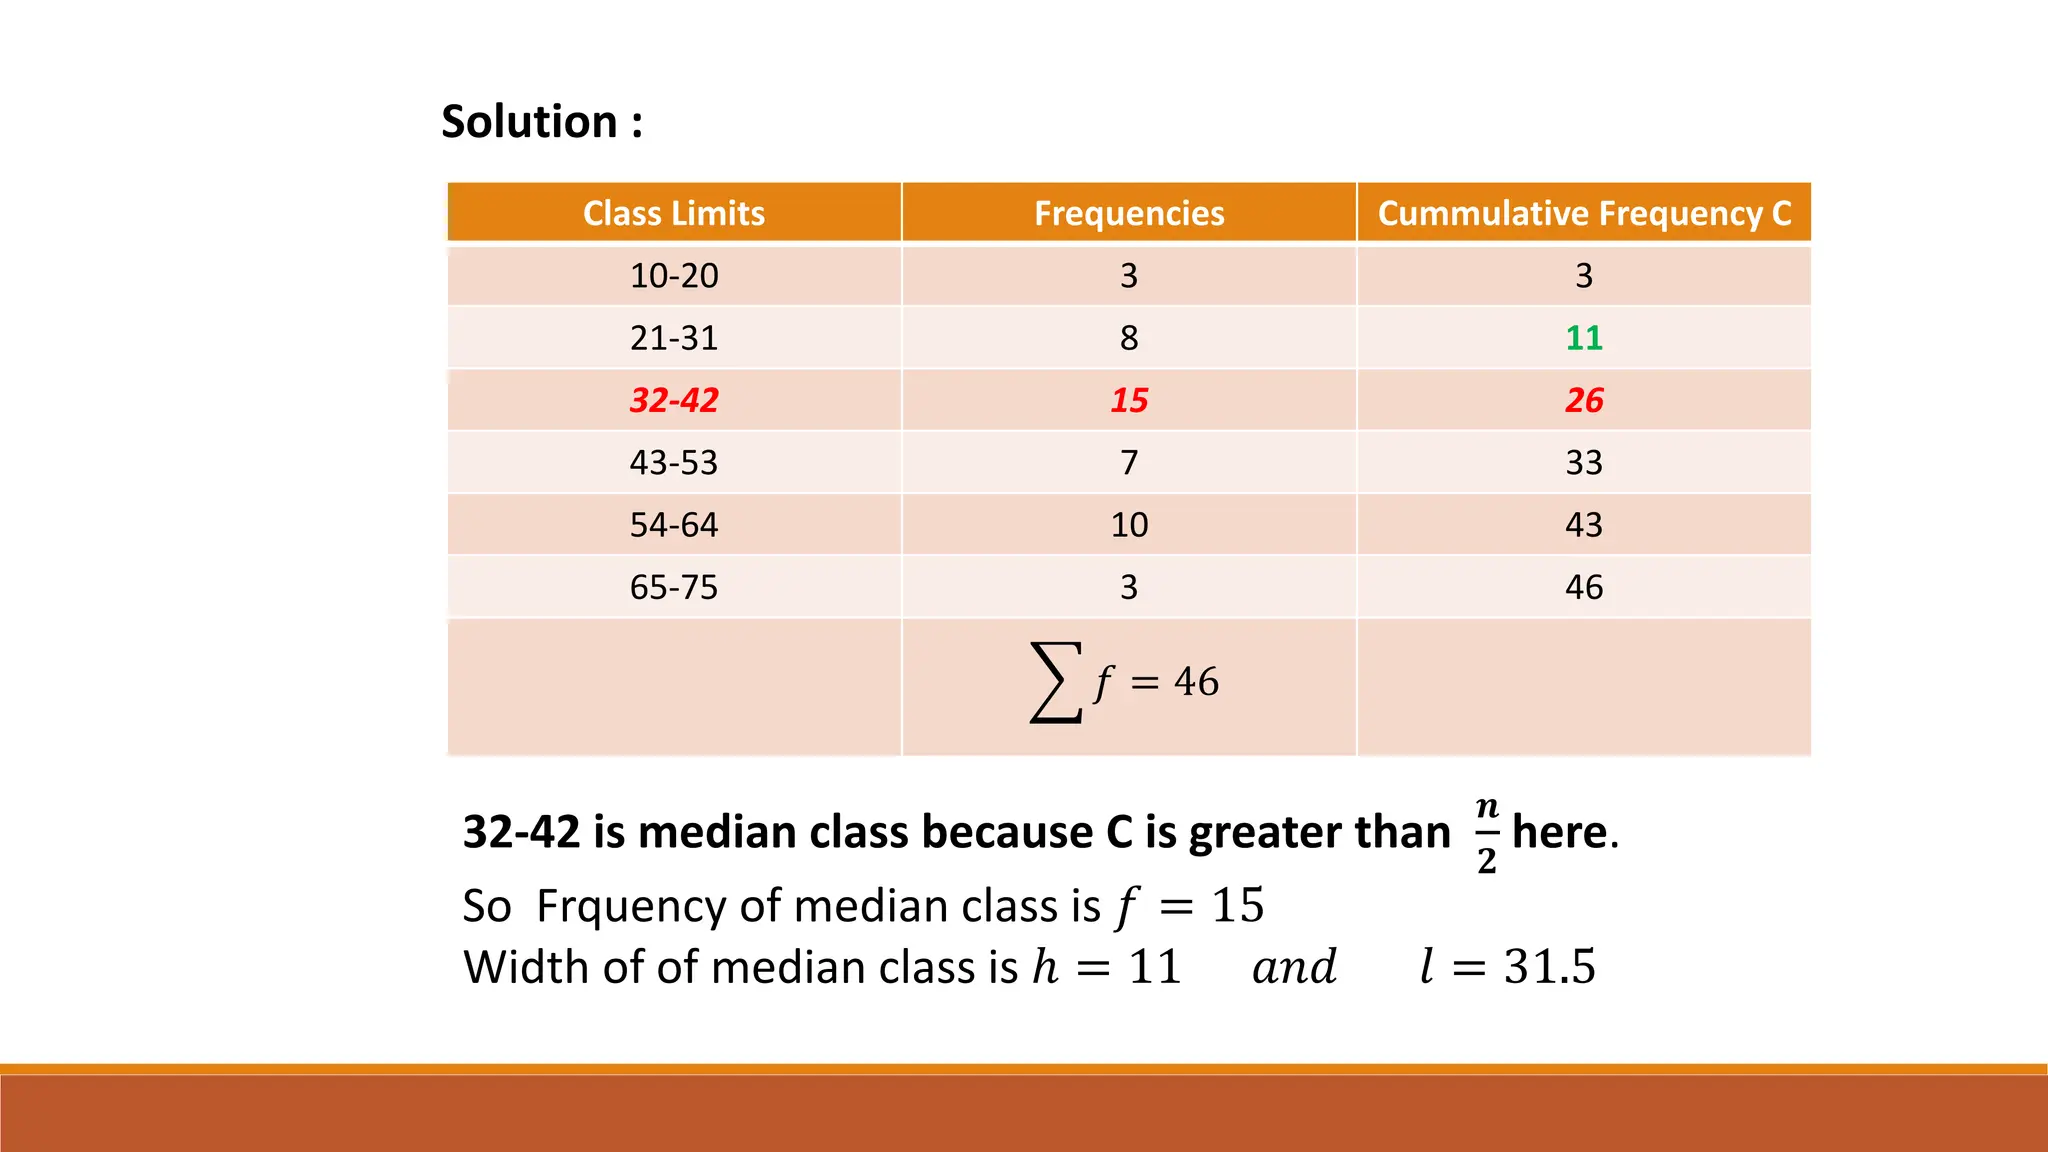
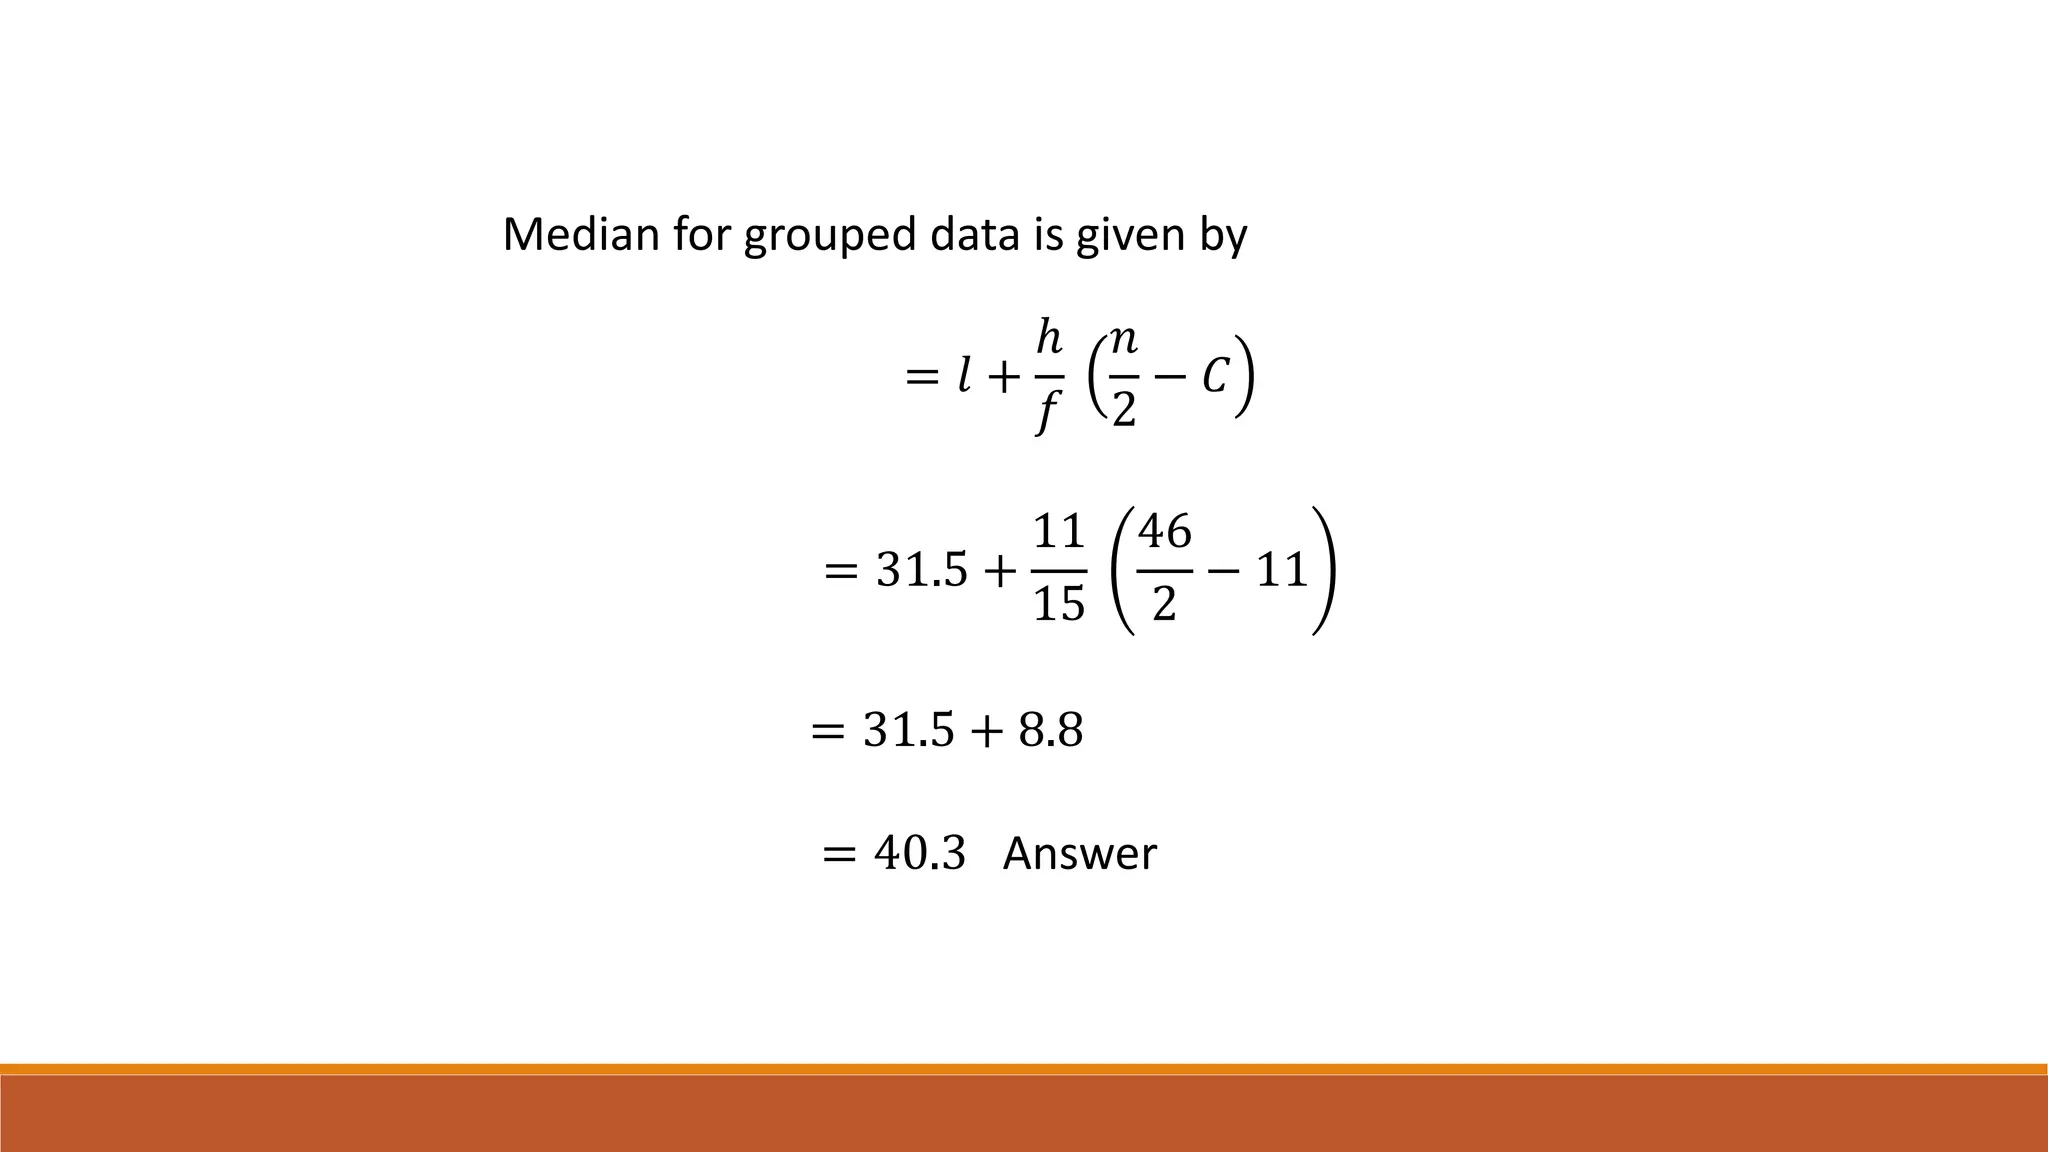
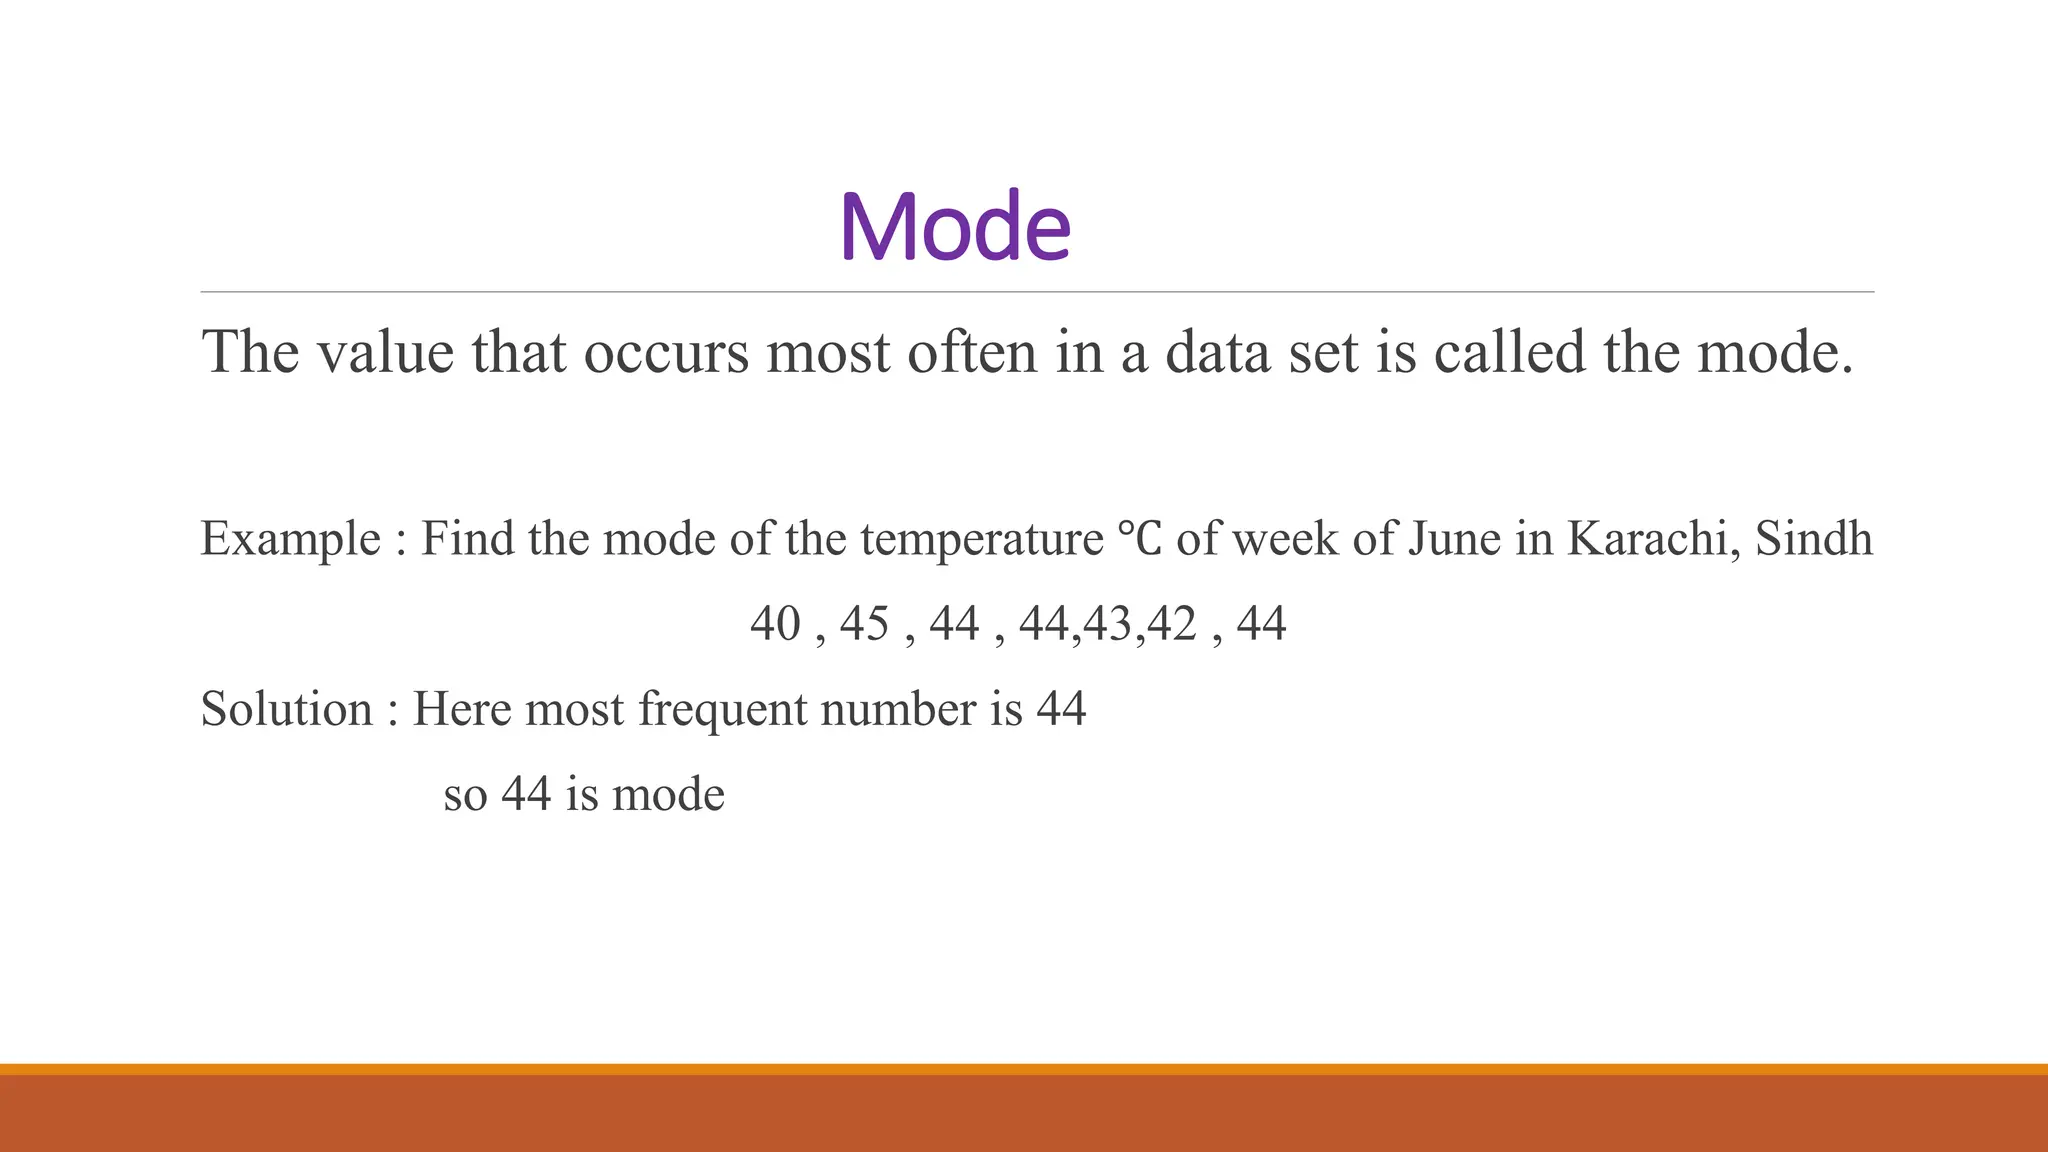
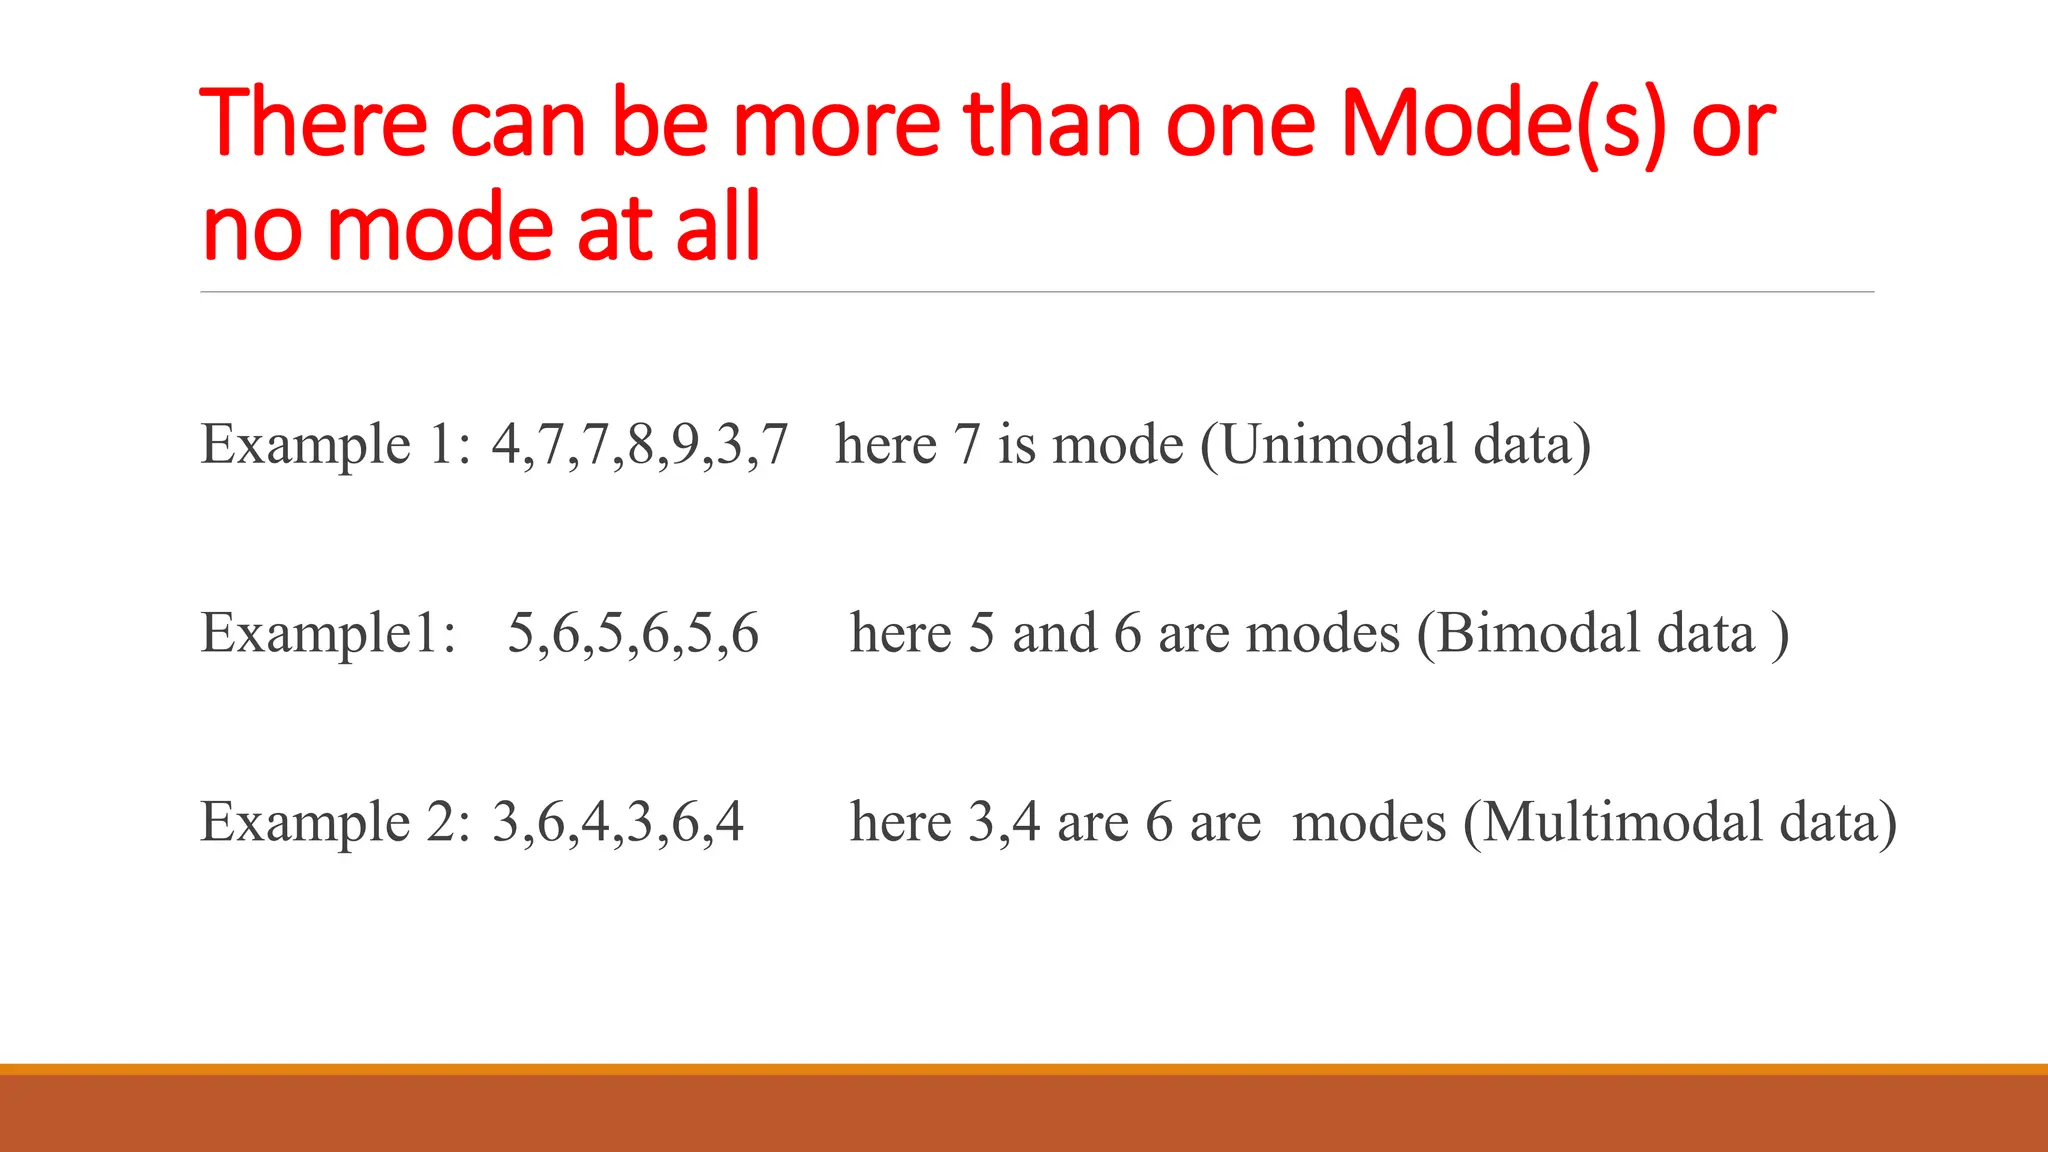
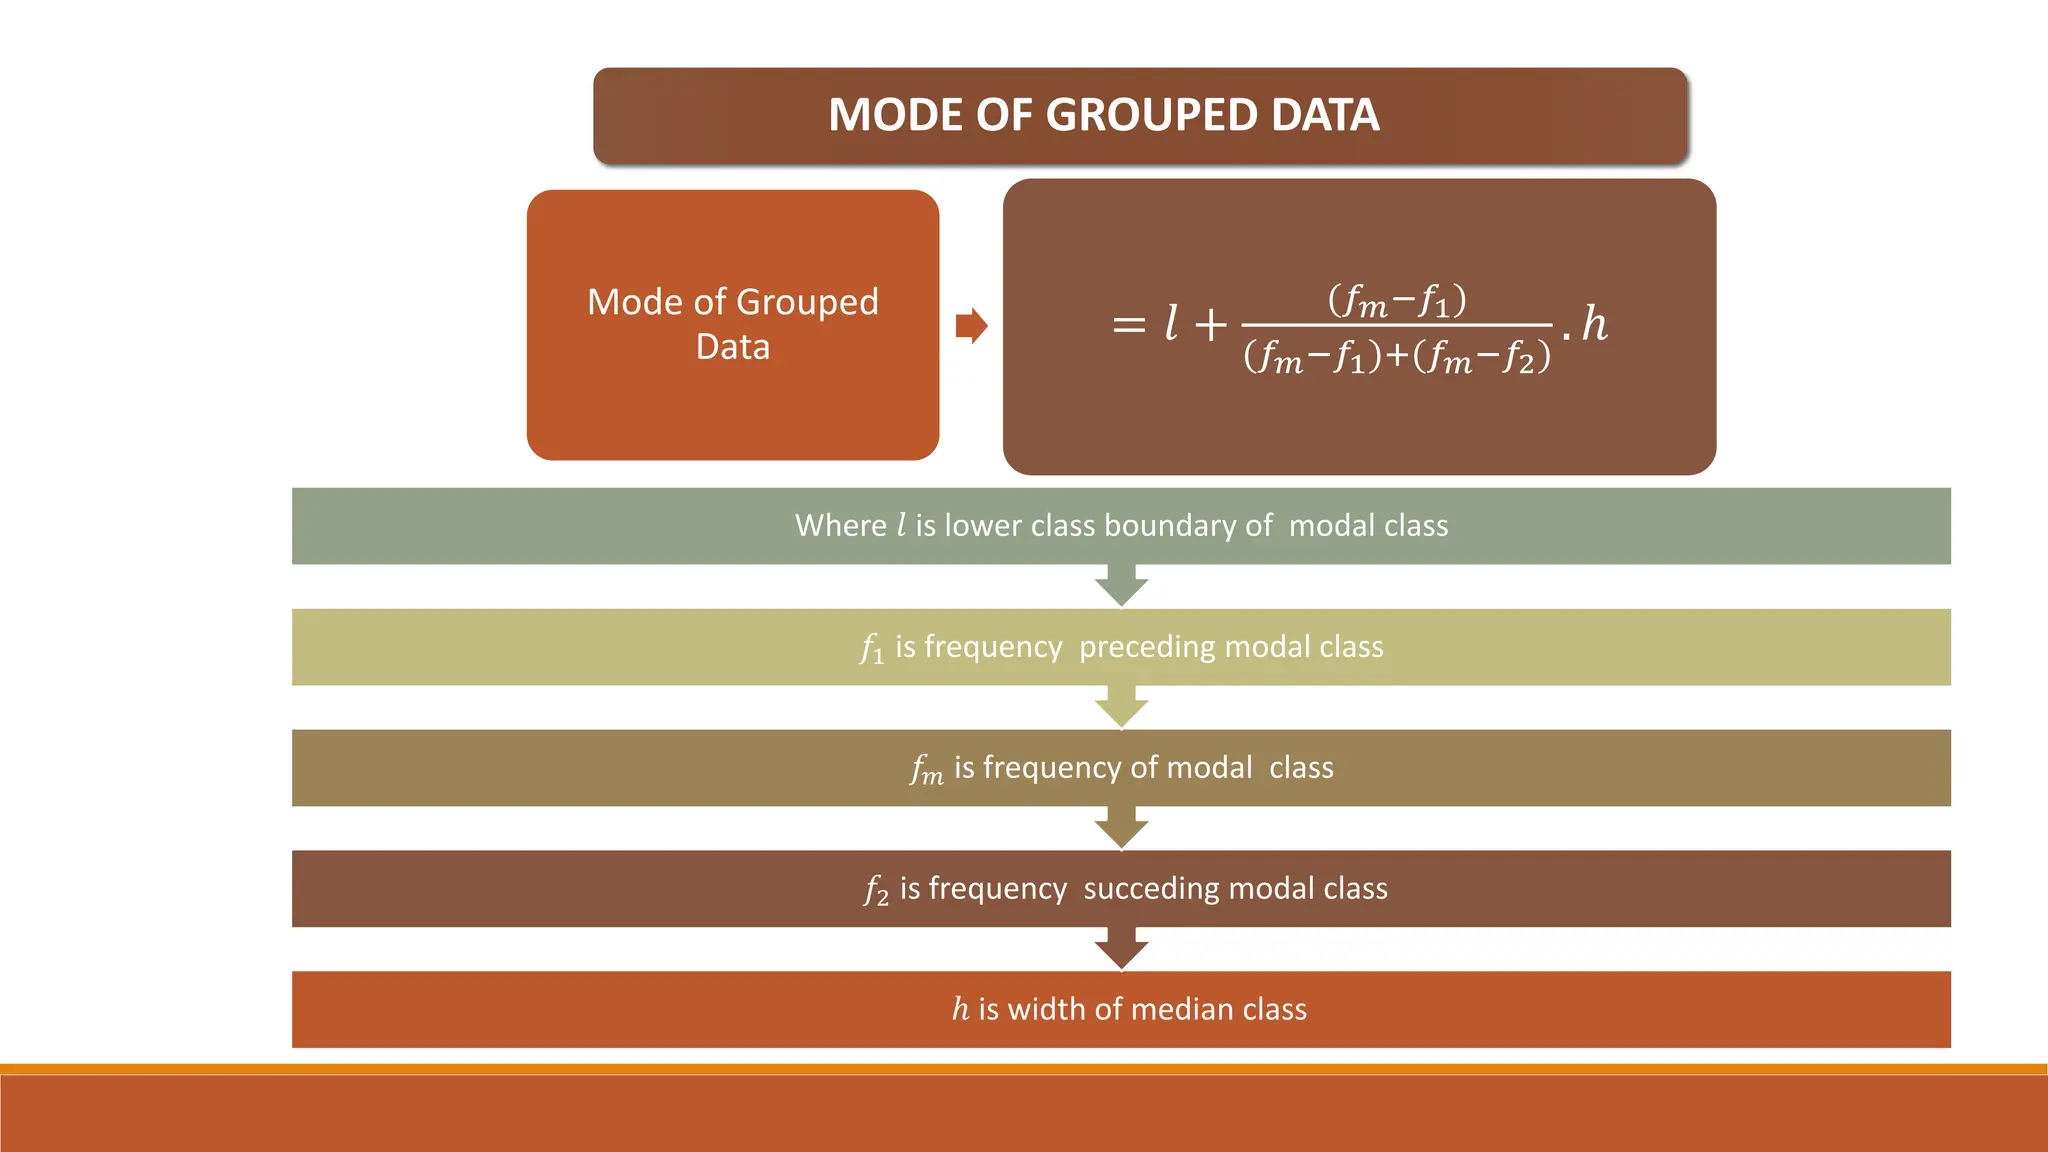
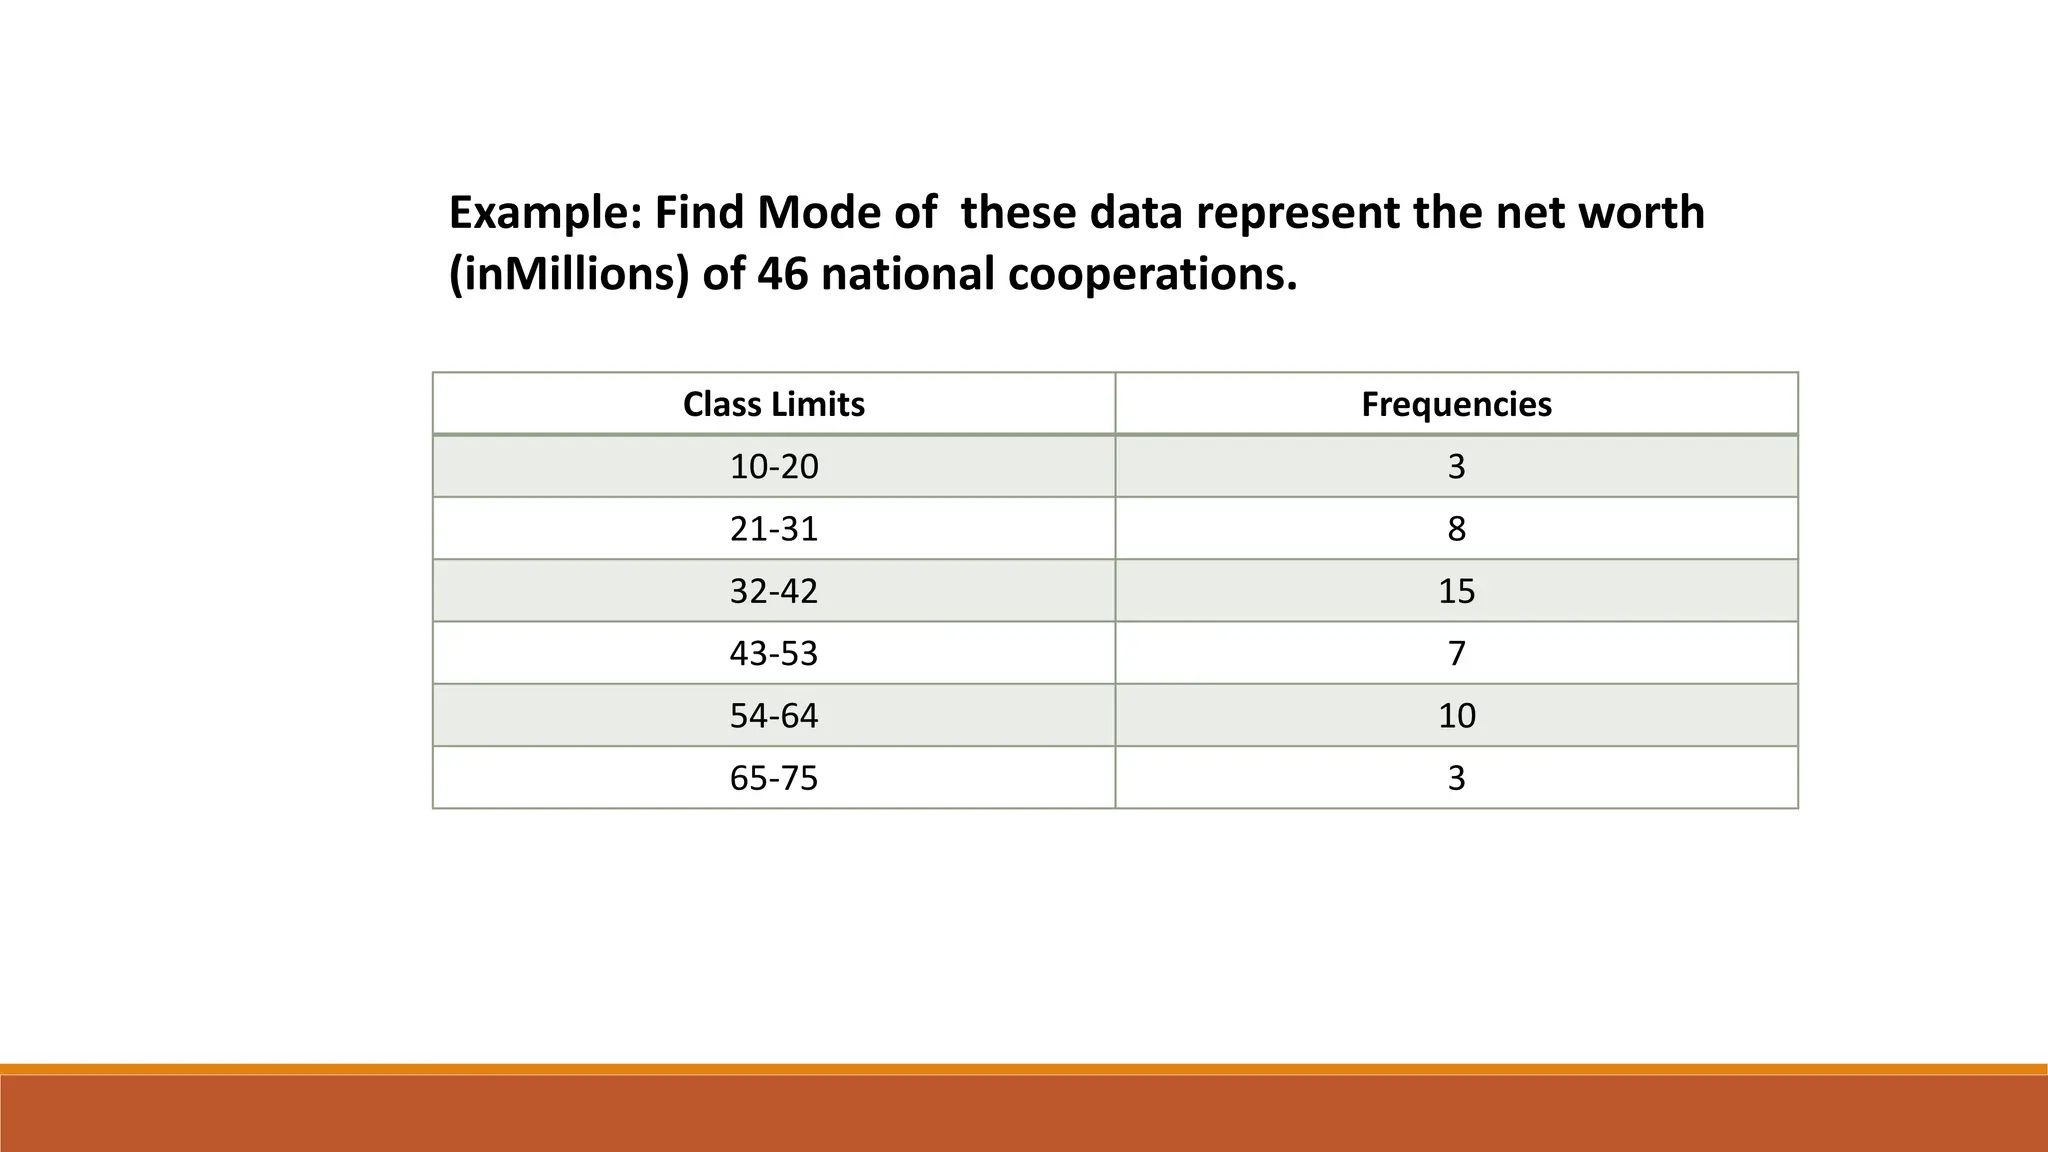
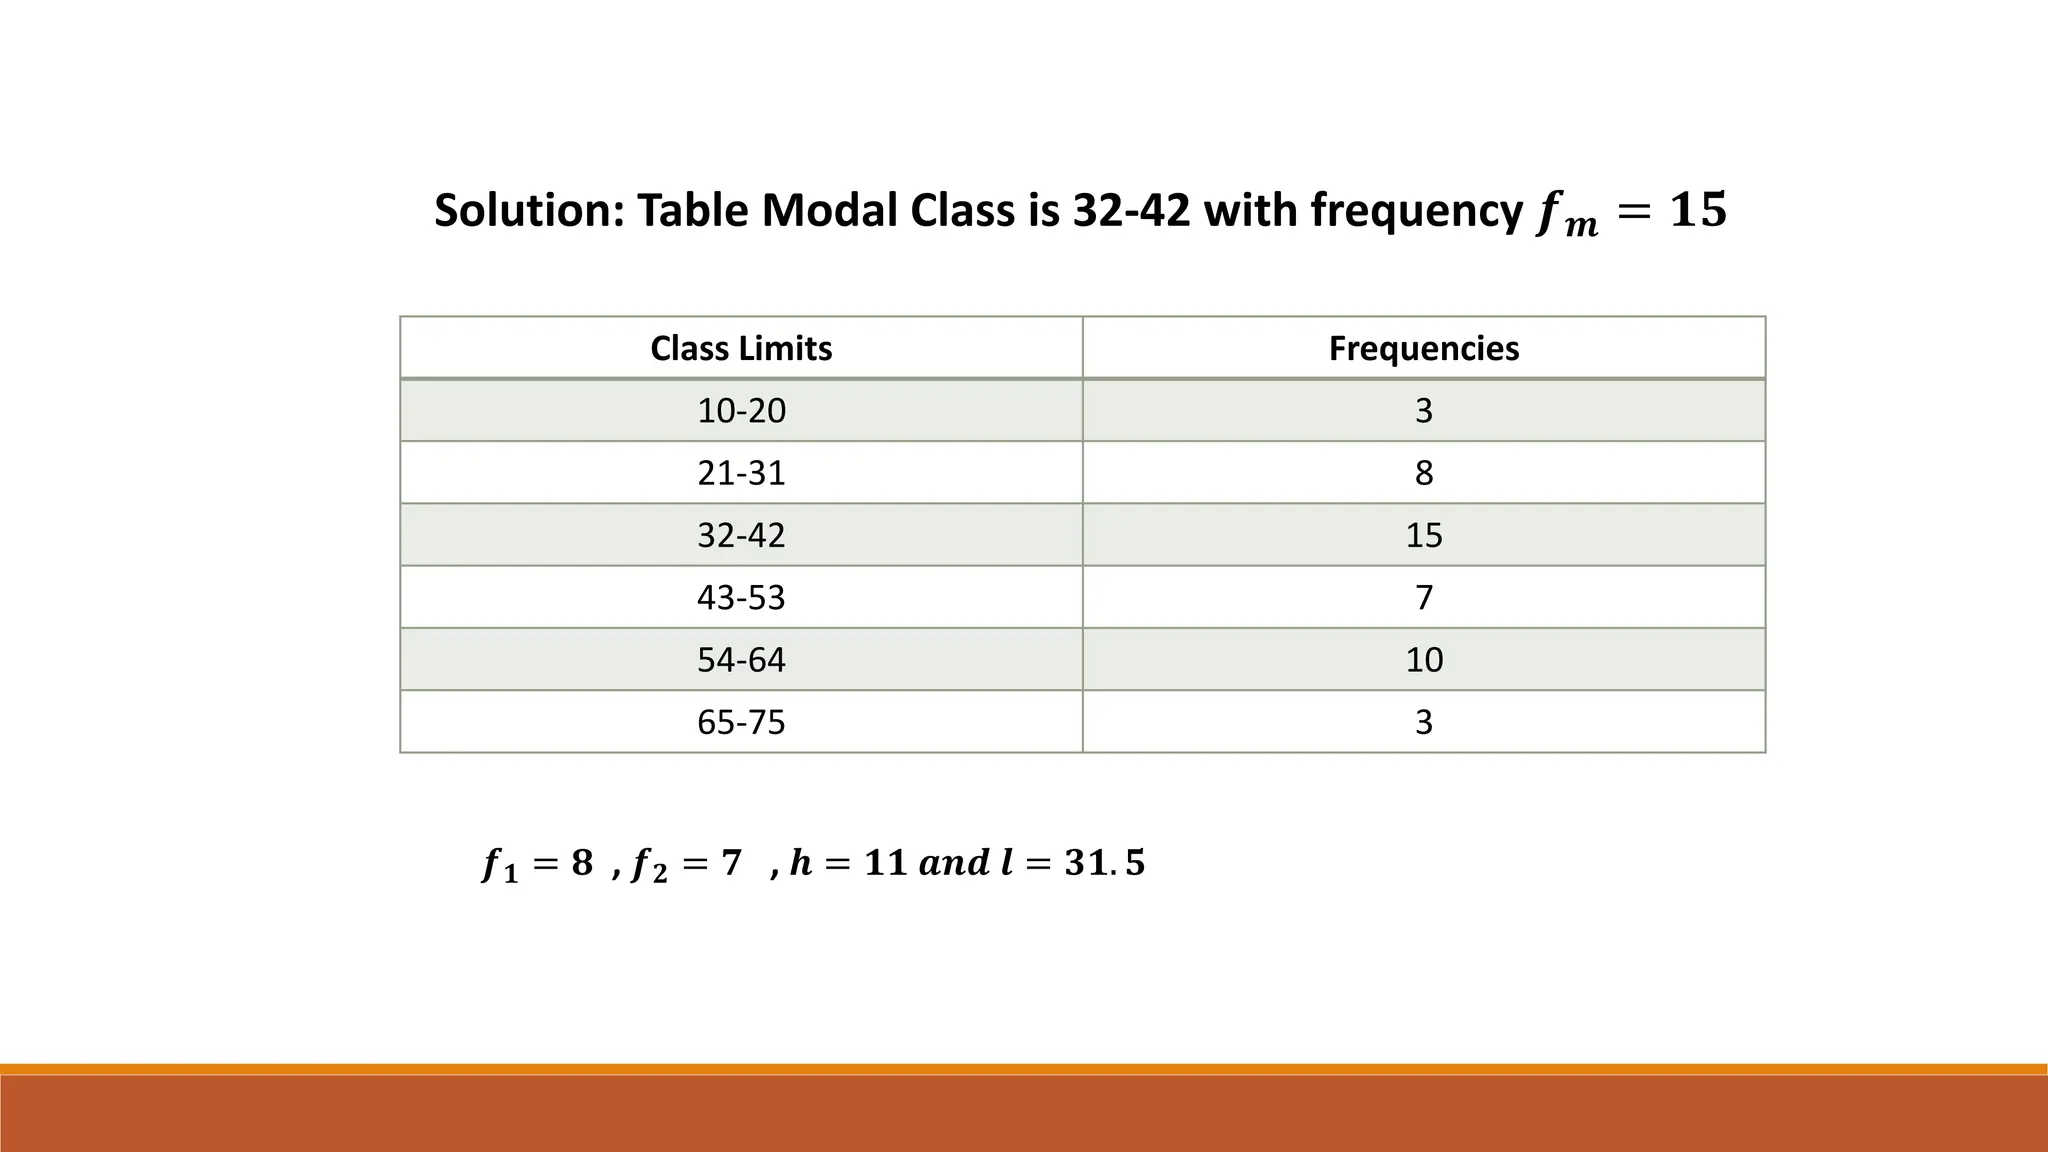
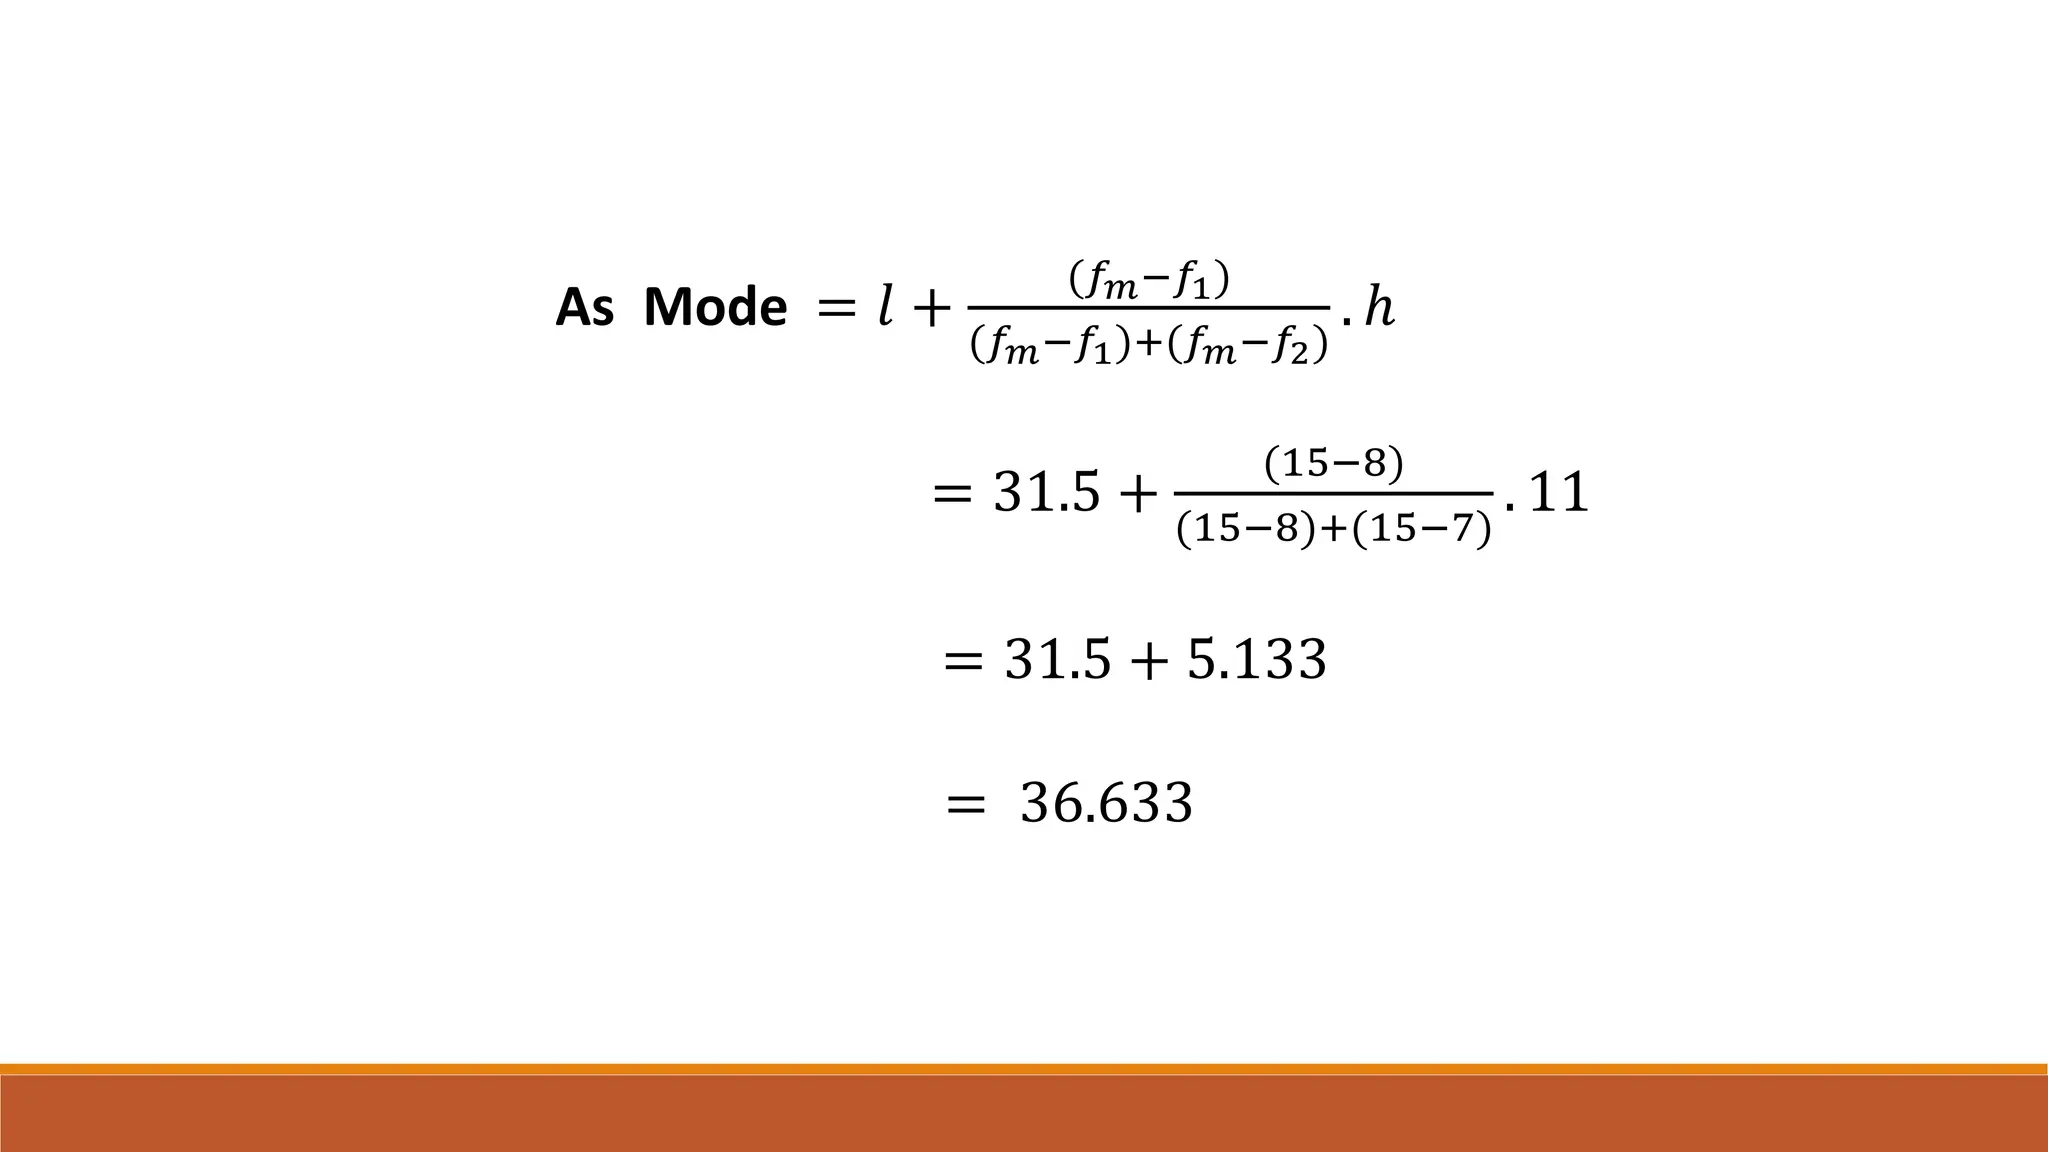
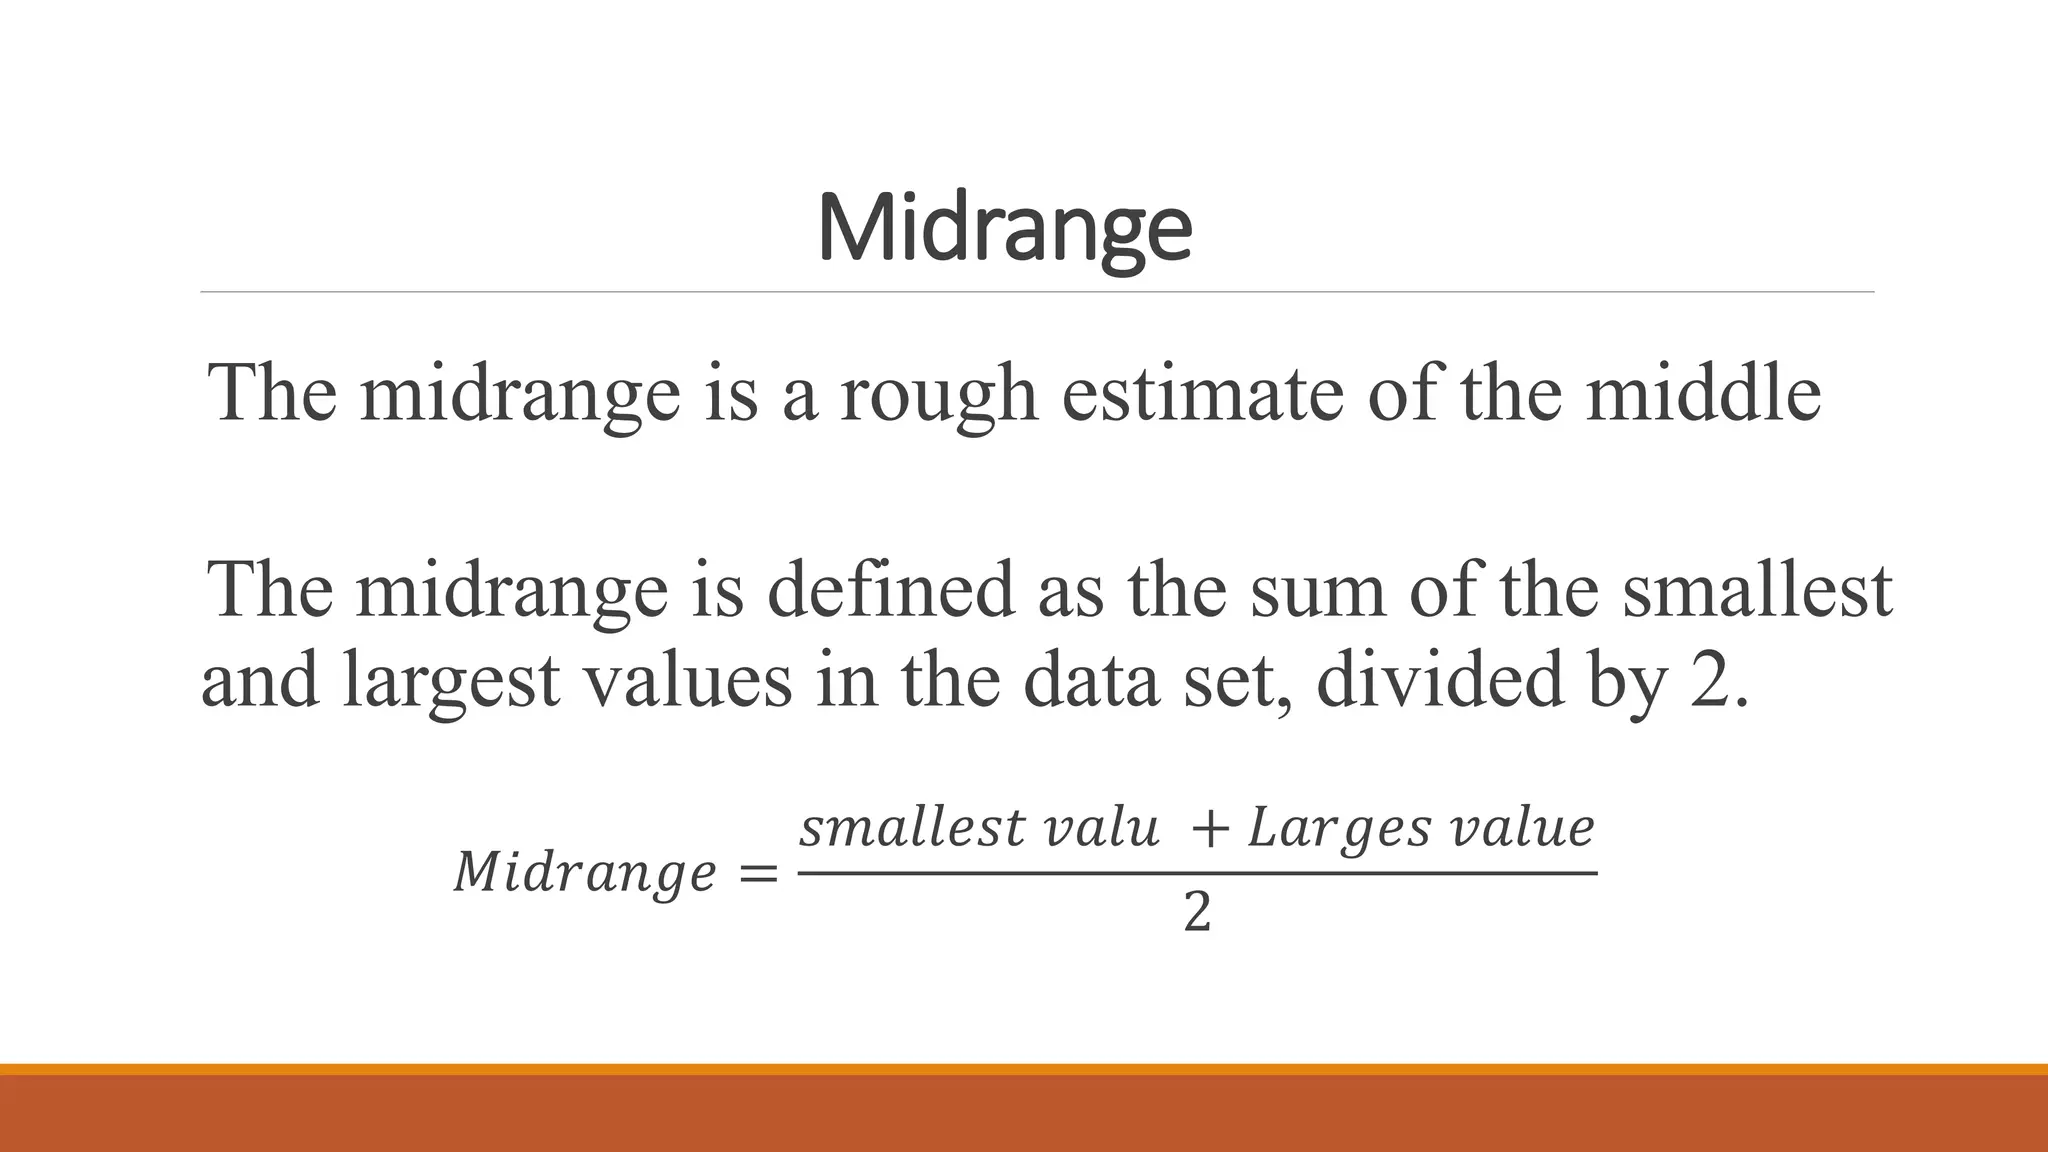
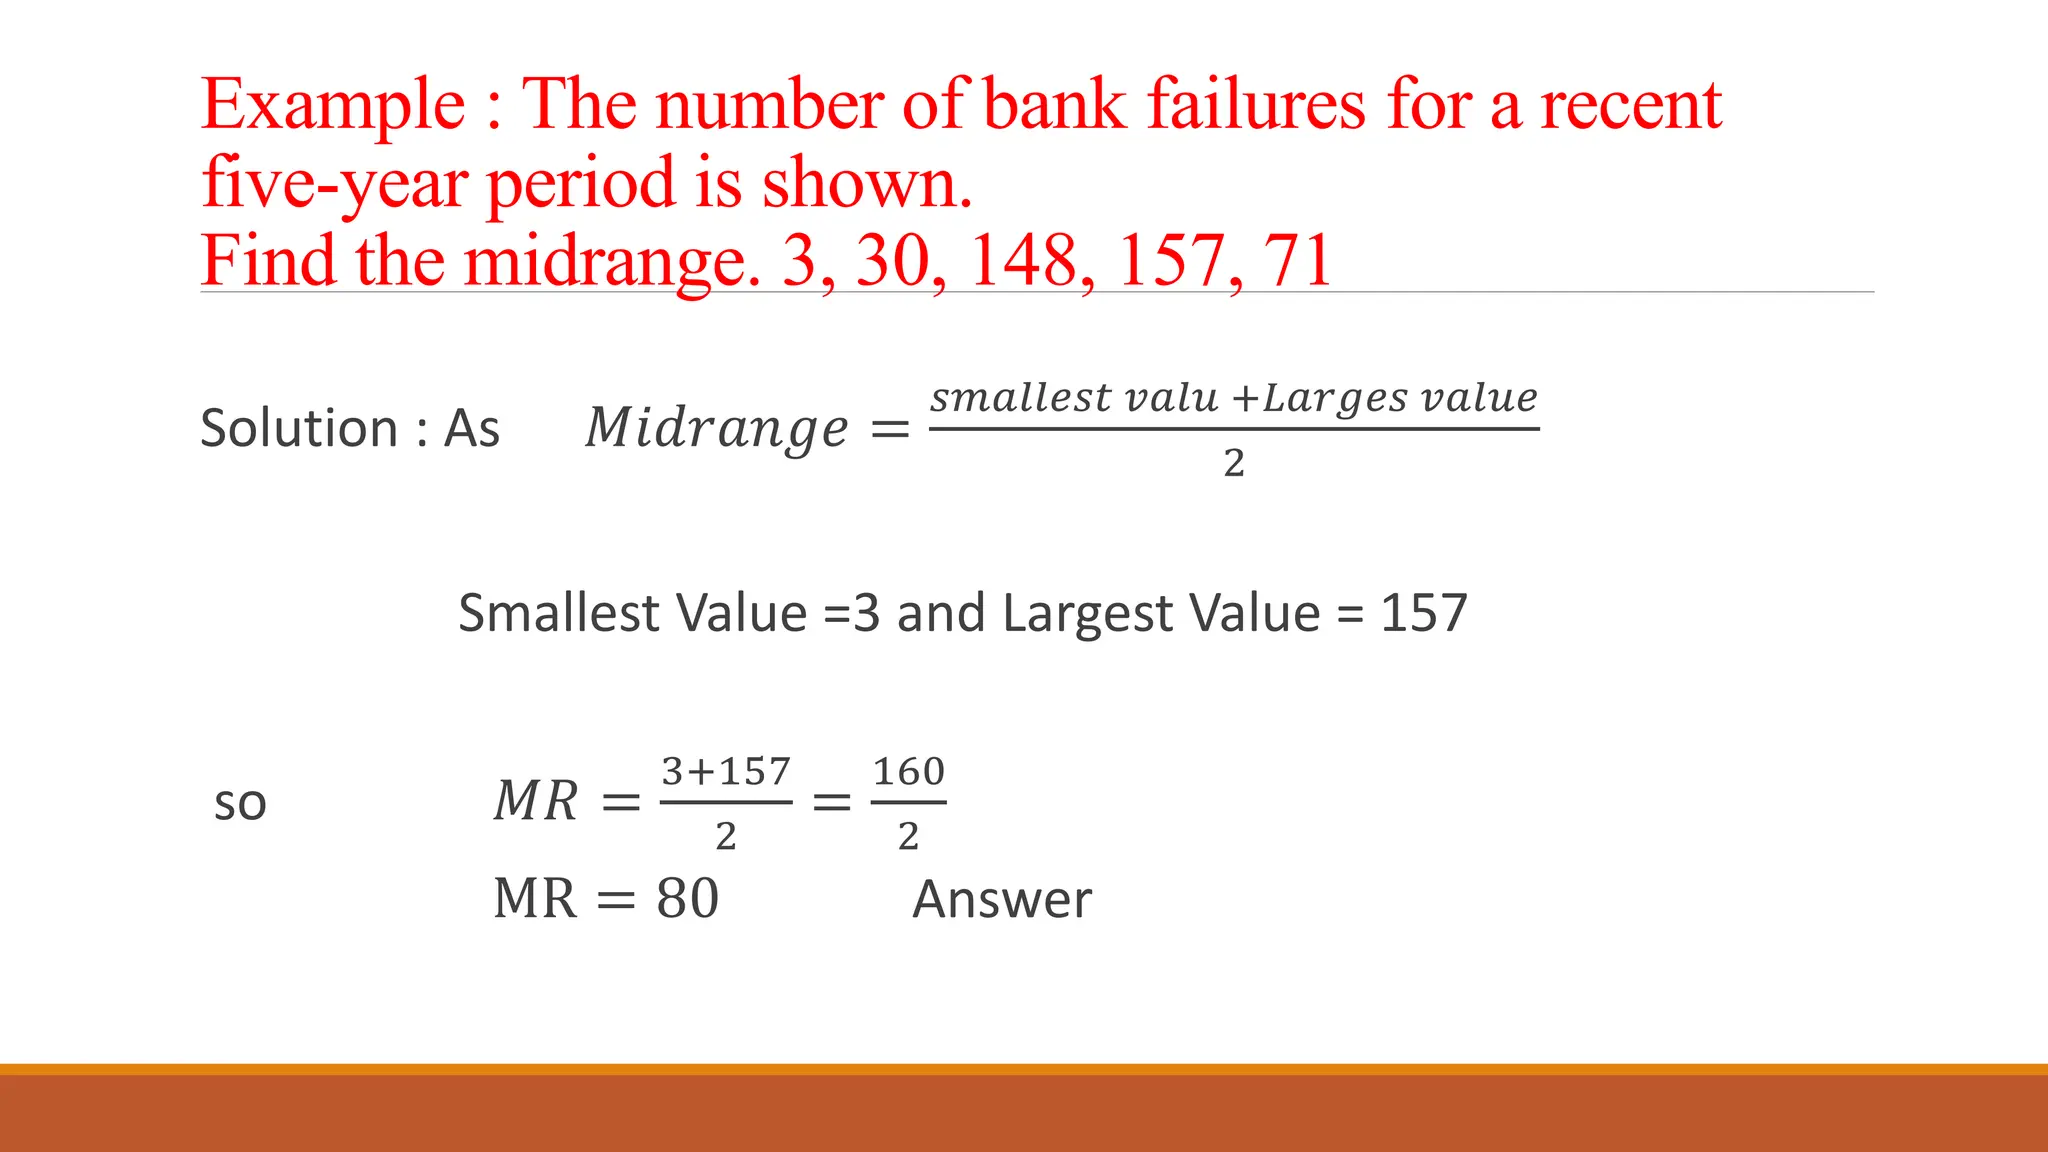
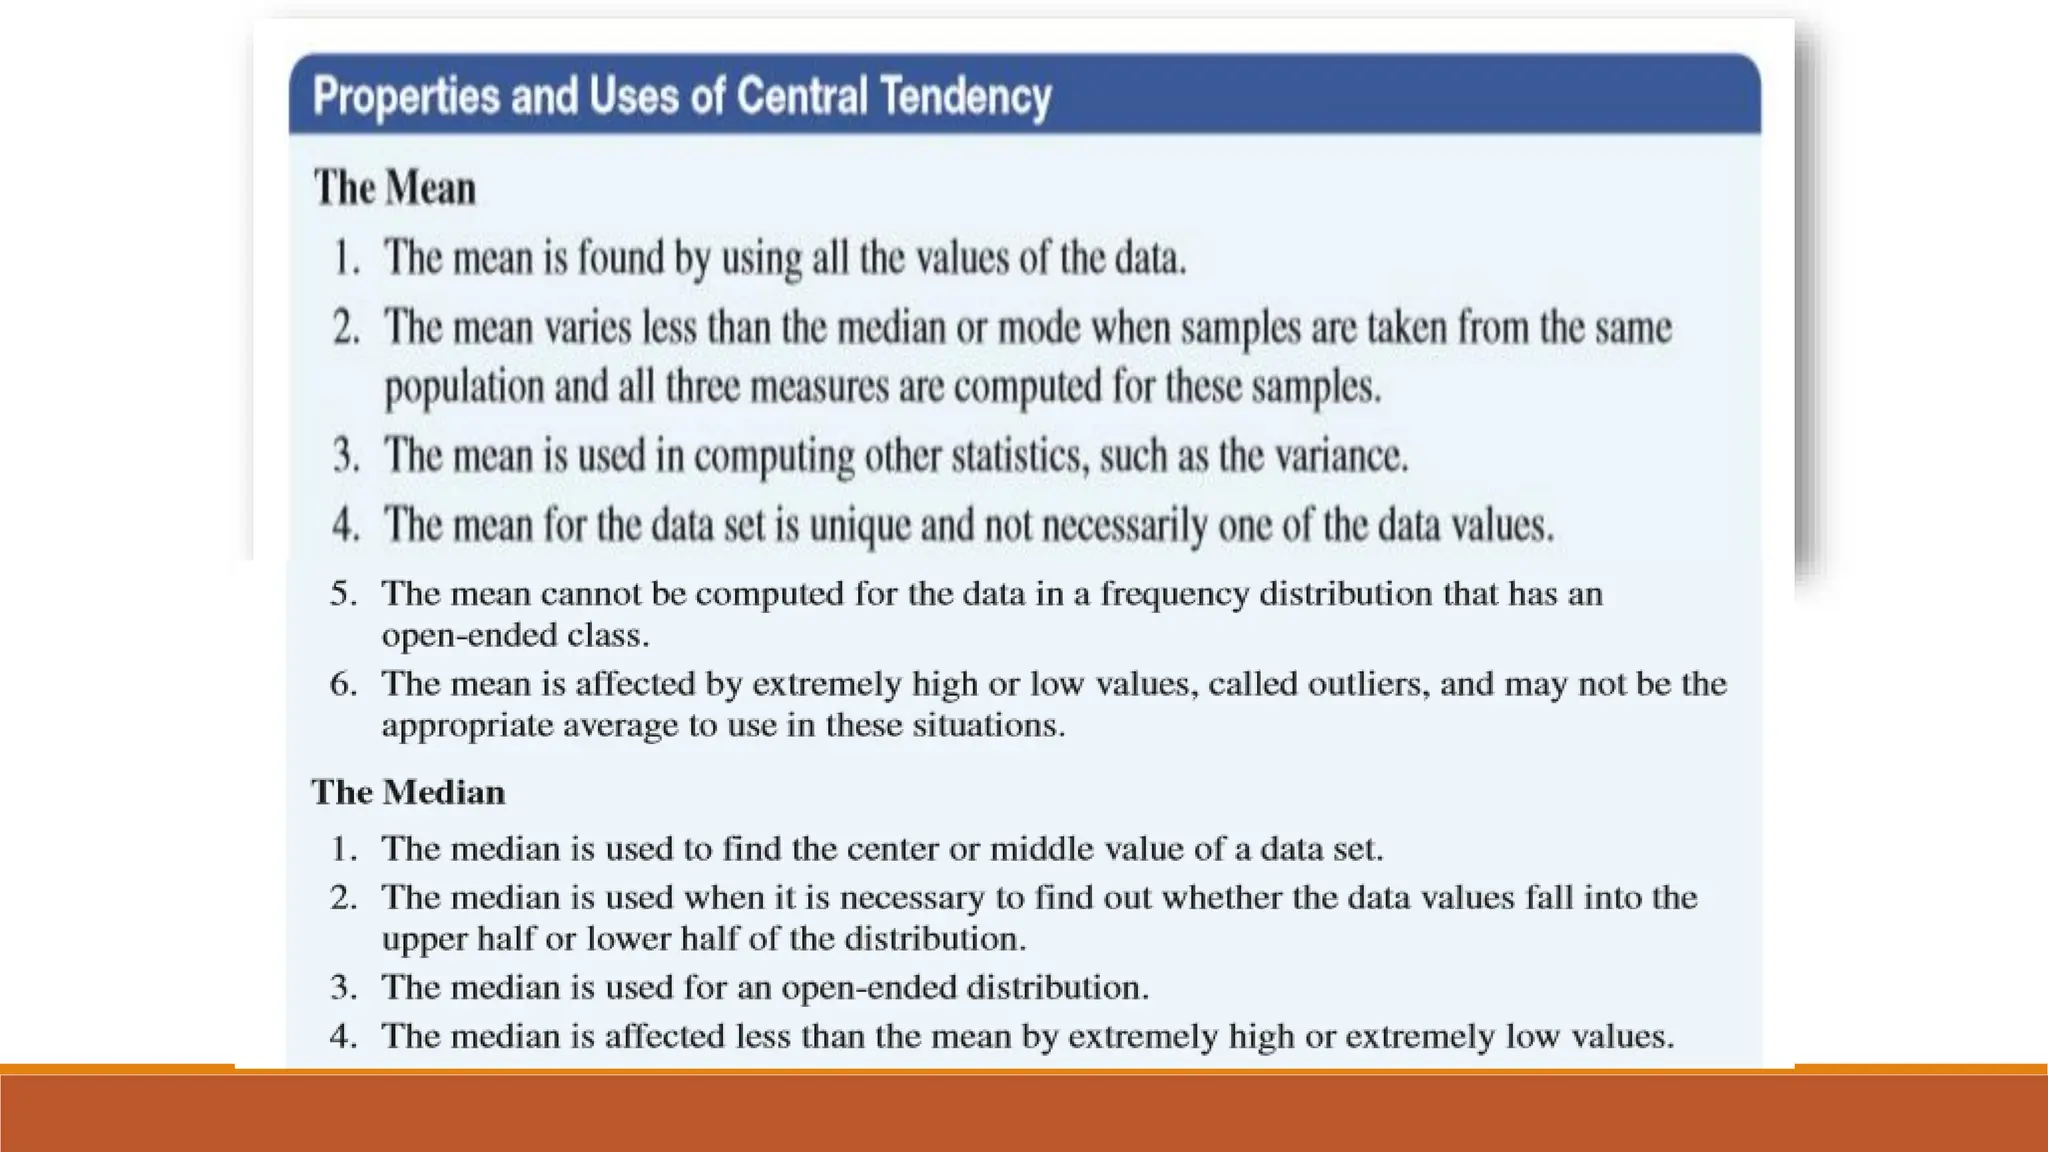
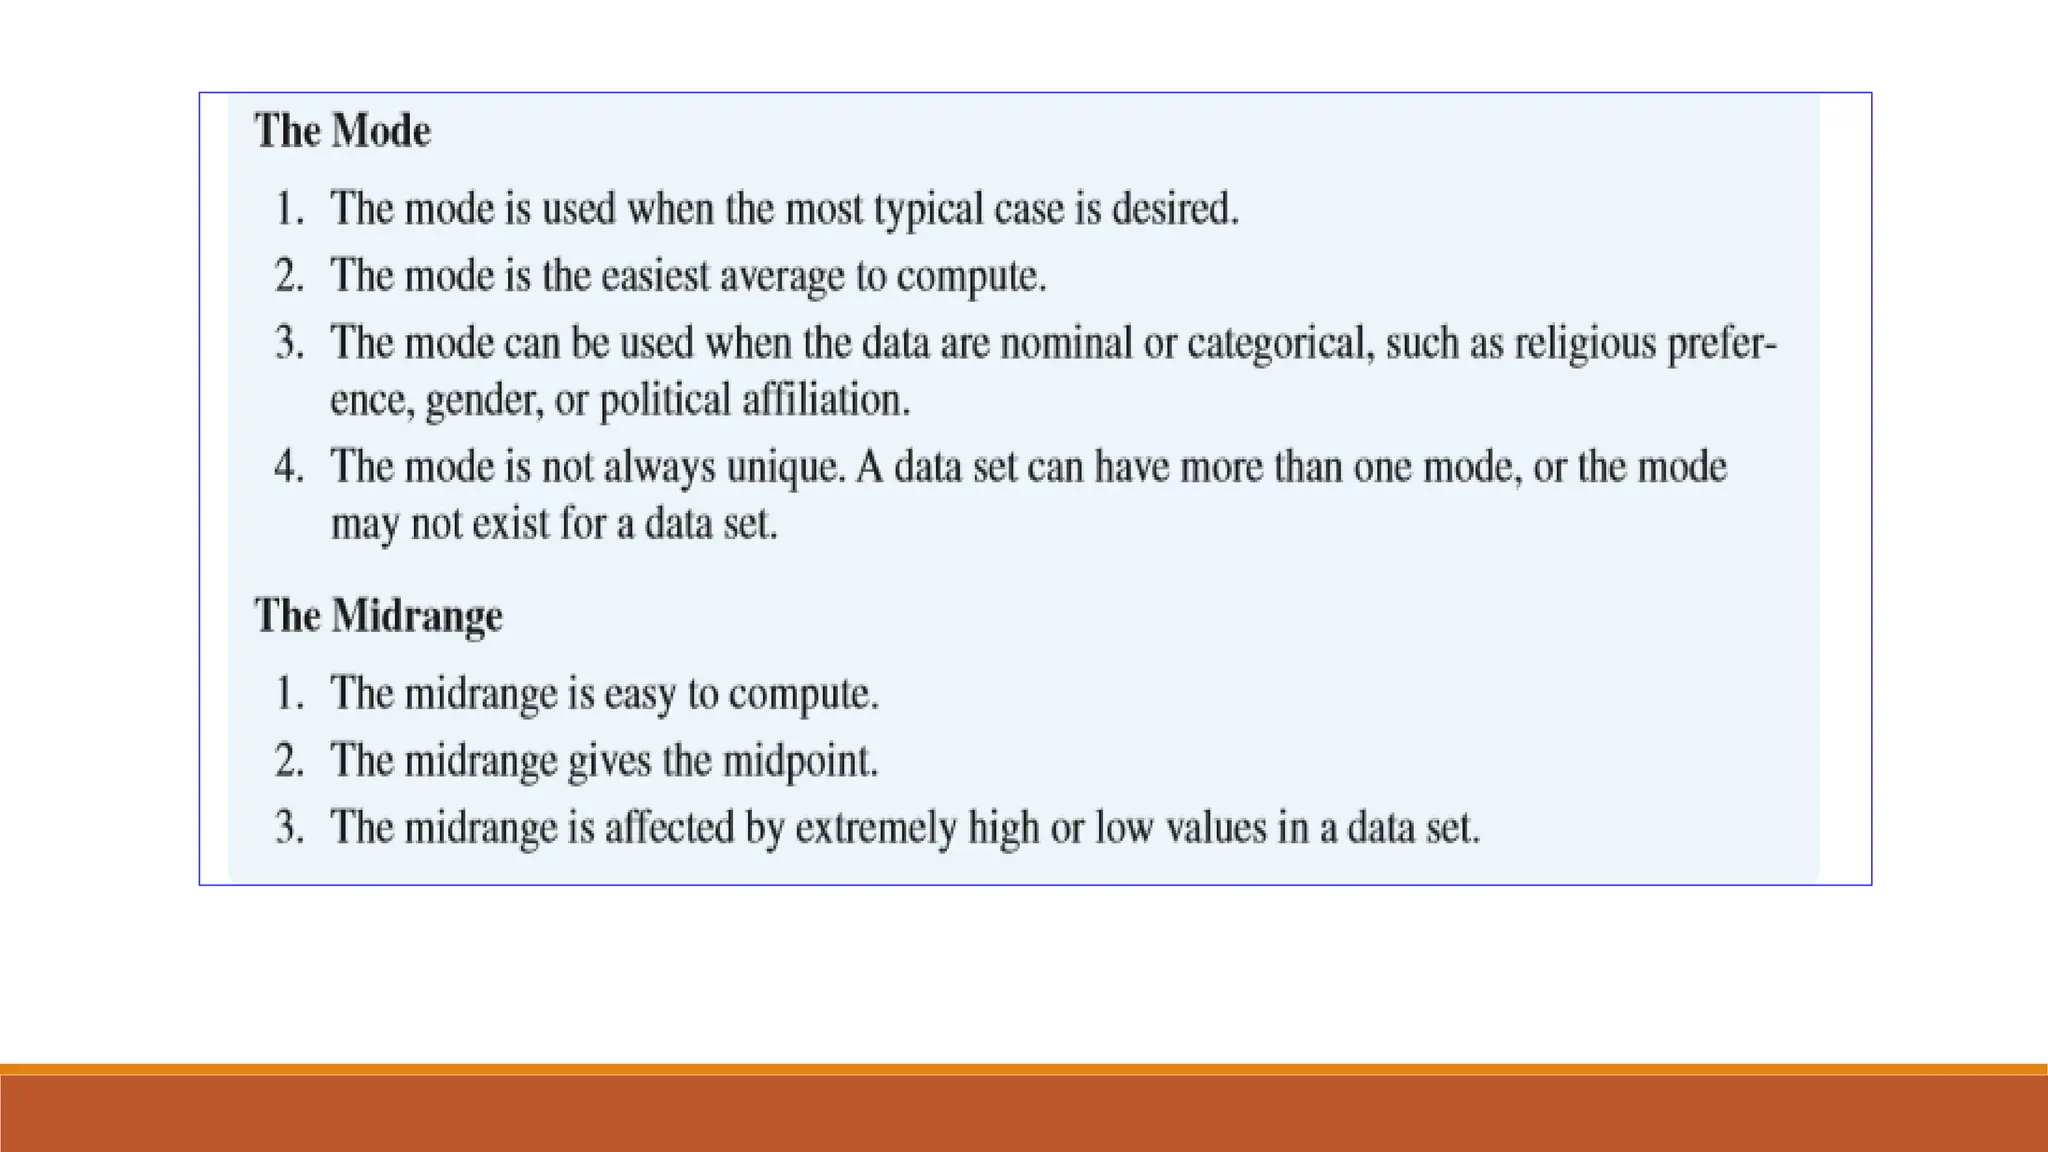
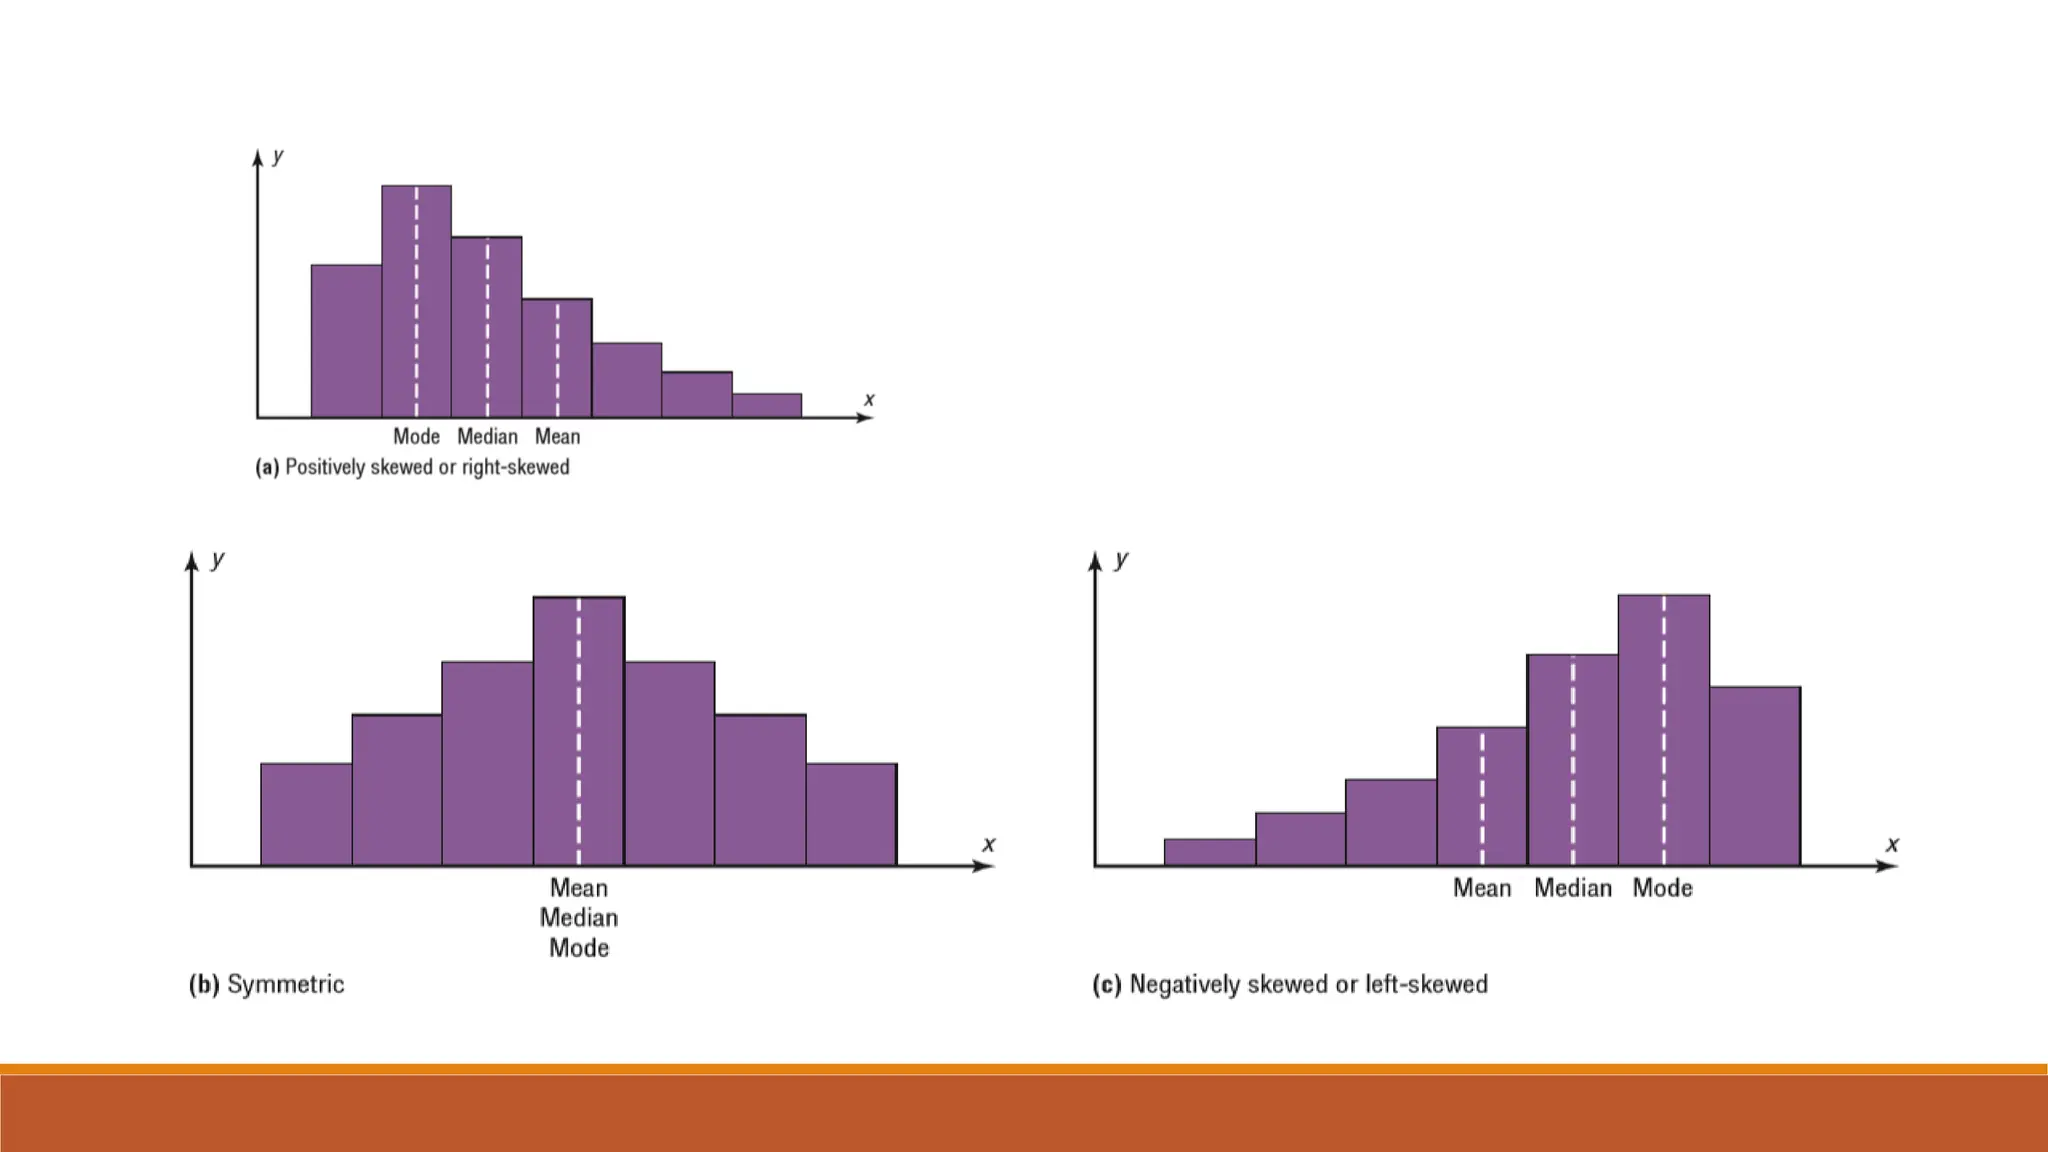
Lecture 3+4
Measure of Central
Tendency
Average
Average (Central Tendency )
Quantities
Observation
the Values
the center of
The average means
Average is a number which represents a whole data.
TYPES OF AVERAGE
Mean
Mode
Median
Midrange
Mean (Arithmetic Mean)
The mean is the sum of the values, divided by the total number of values.
𝐴𝑣𝑒𝑟𝑎𝑔𝑒 =
𝑆𝑢𝑚 𝑜𝑓 𝑣𝑎𝑙𝑢𝑒𝑠
𝑇𝑜𝑡𝑎𝑙 𝑛𝑢𝑚𝑏𝑒𝑟 𝑜𝑓 𝑉𝑎𝑙𝑢𝑒𝑠
ҧ
𝑥 =
𝑥1+𝑥2+𝑥3+𝑥4+⋯+𝑥𝑛
𝑛
ҧ
𝑥 =
σ 𝑥𝑖
𝑛
Example 1 : Find Mean of 5 , 7 , 8 ,10,5
Solution : As 𝐴𝑣𝑒𝑟𝑎𝑔𝑒 =
𝑆𝑢𝑚 𝑜𝑓 𝑣𝑎𝑙𝑢𝑒𝑠
𝑇𝑜𝑡𝑎𝑙 𝑛𝑢𝑚𝑏𝑒𝑟 𝑜𝑓 𝑉𝑎𝑙𝑢𝑒𝑠
So ҧ
𝑥 =
5+7+8+10+5
5
=
35
5
=7 Answer
Example 2 : The number of calls that a local police department
responded to for a sample of 9 months is shown. Find the
mean. 475, 447, 440, 761, 993, 1052, 783, 671, 621
Solution: 𝐴𝑣𝑒𝑟𝑎𝑔𝑒 =
𝑆𝑢𝑚 𝑜𝑓 𝑣𝑎𝑙𝑢𝑒𝑠
𝑇𝑜𝑡𝑎𝑙 𝑛𝑢𝑚𝑏𝑒𝑟 𝑜𝑓 𝑉𝑎𝑙𝑢𝑒𝑠
So ҧ
𝑥 =
475+ 447+ 440+761+993+ 1052+ 783+ 671+ 621
9
ҧ
𝑥 =
6243
9
ത
x ≈ 693.7 (Approximately)
Mean of Grouped Data
Mean for
grouped Data ҧ
𝑥 =
σ 𝑓𝑖𝑥𝑖
𝑛
Where
ҧ
𝑥 is mean
𝑓𝑖 is frequency of class
𝑥𝑖 is mid point of class
𝑛 is cumulative frequencies
Example: Find Mean of these data represent the net worth
(inMillions) of 46 national cooperations.
Class Limits Frequencies
10-20 3
21-31 8
32-42 15
43-53 7
54-64 10
65-75 3
The Weighted Mean
Sometimes you must find the mean of a data set in which not
all values are equally represented.
When there number values of a quantity , we use weighed
mean technique to calculate.
The weighted mean of a variable X is calculated by
multiplying each value by its corresponding weight and
dividing the sum of the products by the sum of the weights.
Example
The Median
The median is the midpoint of the data array.
Before finding this point, the data must be arranged in
ascending or increasing order.
When the data set is ordered, it is called a data array.
Example: The number of tornadoes that have occurred in
the United States over an 7-year period follows. Find the
median. 684, 764, 656, 702, 856, 1133 , 1132
Solution
Step 1 : Arranging the data values in ascending order.
684, 764, 656, 702, 856, 1133 , 1132
Step 2: Data in ascending order
656, 684, 702, 764, 856, 1132, 1133
Step 3: the middle value in the data is 764 .
Hence Median is 764
Example: The number of tornadoes that have occurred in
the United States over an 8-year period follows. Find the
median. 684, 764, 656, 702, 856, 1133 , 1132,1303
Solution
Step 1 : Arranging the data values in ascending order.
684, 764, 656, 702, 856, 1133 , 1132, 1303
Step 2: Data in ascending order
656, 684, 702, 764, 856, 1132, 1133,1303
Step 3: the middle values in the data are 764 and 856
Hence Median is
764+856
2
=
1620
2
= 810 Answer
MEDIAN OF GROUPED DATA
C is cumulative frequency preceding median class
ℎ is width of median class
𝑓 is frequency of median class
𝑛 is sum of frequencies of all classes
Where 𝑙 is lower class boundary
Median of
Grouped Data
= 𝑙 +
ℎ
𝑓
𝑛
2
− 𝐶
Steps for finding the Median
Step 1:
𝑛
2
half of total observations
Step 2 : Median Class
Step 3 : terms of median class 𝑓 𝑎𝑛𝑑 ℎ
Step 4 : Cumulative Frequencies (C) before median
class
Example: Find Median of these data represent the net worth
(inMillions) of 46 national cooperations.
Class Limits Frequencies
10-20 3
21-31 8
32-42 15
43-53 7
54-64 10
65-75 3
Class Limits Frequencies Cummulative Frequency C
10-20 3 3
21-31 8 11
32-42 15 26
43-53 7 33
54-64 10 43
65-75 3 46
෍ 𝑓 = 46
Solution :
32-42 is median class because C is greater than
𝒏
𝟐
here.
So Frquency of median class is 𝑓 = 15
Width of of median class is ℎ = 11 𝑎𝑛𝑑 𝑙 = 31.5
Median for grouped data is given by
= 𝑙 +
ℎ
𝑓
𝑛
2
− 𝐶
= 31.5 +
11
15
46
2
− 11
= 31.5 + 8.8
= 40.3 Answer
Mode
The value that occurs most often in a data set is called the mode.
Example : Find the mode of the temperature ℃ of week of June in Karachi, Sindh
40 , 45 , 44 , 44,43,42 , 44
Solution : Here most frequent number is 44
so 44 is mode
There can be more than one Mode(s) or
no mode at all
Example 1: 4,7,7,8,9,3,7 here 7 is mode (Unimodal data)
Example1: 5,6,5,6,5,6 here 5 and 6 are modes (Bimodal data )
Example 2: 3,6,4,3,6,4 here 3,4 are 6 are modes (Multimodal data)
MODE OF GROUPED DATA
ℎ is width of median class
𝑓2 is frequency succeding modal class
𝑓𝑚 is frequency of modal class
𝑓1 is frequency preceding modal class
Where 𝑙 is lower class boundary of modal class
Mode of Grouped
Data = 𝑙 +
(𝑓𝑚−𝑓1)
(𝑓𝑚−𝑓1)+(𝑓𝑚−𝑓2)
. ℎ
Example: Find Mode of these data represent the net worth
(inMillions) of 46 national cooperations.
Class Limits Frequencies
10-20 3
21-31 8
32-42 15
43-53 7
54-64 10
65-75 3
Solution: Table Modal Class is 32-42 with frequency 𝒇𝒎 = 𝟏𝟓
Class Limits Frequencies
10-20 3
21-31 8
32-42 15
43-53 7
54-64 10
65-75 3
𝒇𝟏 = 𝟖 , 𝒇𝟐 = 𝟕 , 𝒉 = 𝟏𝟏 𝒂𝒏𝒅 𝒍 = 𝟑𝟏. 𝟓
As Mode = 𝑙 +
(𝑓𝑚−𝑓1)
(𝑓𝑚−𝑓1)+(𝑓𝑚−𝑓2)
. ℎ
= 31.5 +
(15−8)
(15−8)+(15−7)
. 11
= 31.5 + 5.133
= 36.633
Midrange
The midrange is a rough estimate of the middle
The midrange is defined as the sum of the smallest
and largest values in the data set, divided by 2.
𝑀𝑖𝑑𝑟𝑎𝑛𝑔𝑒 =
𝑠𝑚𝑎𝑙𝑙𝑒𝑠𝑡 𝑣𝑎𝑙𝑢 + 𝐿𝑎𝑟𝑔𝑒𝑠 𝑣𝑎𝑙𝑢𝑒
2
Example : The number of bank failures for a recent
five-year period is shown.
Find the midrange. 3, 30, 148, 157, 71
Solution : As 𝑀𝑖𝑑𝑟𝑎𝑛𝑔𝑒 =
𝑠𝑚𝑎𝑙𝑙𝑒𝑠𝑡 𝑣𝑎𝑙𝑢 +𝐿𝑎𝑟𝑔𝑒𝑠 𝑣𝑎𝑙𝑢𝑒
2
Smallest Value =3 and Largest Value = 157
so 𝑀𝑅 =
3+157
2
=
160
2
MR = 80 Answer
Lecture 3 & 4 Measure of Central Tendency.pdf

Lecture 3 & 4 Measure of Central Tendency.pdf

  • 1.
    Lecture 3+4 Measure ofCentral Tendency Average
  • 2.
    Average (Central Tendency) Quantities Observation the Values the center of The average means Average is a number which represents a whole data.
  • 3.
  • 4.
    Mean (Arithmetic Mean) Themean is the sum of the values, divided by the total number of values. 𝐴𝑣𝑒𝑟𝑎𝑔𝑒 = 𝑆𝑢𝑚 𝑜𝑓 𝑣𝑎𝑙𝑢𝑒𝑠 𝑇𝑜𝑡𝑎𝑙 𝑛𝑢𝑚𝑏𝑒𝑟 𝑜𝑓 𝑉𝑎𝑙𝑢𝑒𝑠 ҧ 𝑥 = 𝑥1+𝑥2+𝑥3+𝑥4+⋯+𝑥𝑛 𝑛 ҧ 𝑥 = σ 𝑥𝑖 𝑛
  • 5.
    Example 1 :Find Mean of 5 , 7 , 8 ,10,5 Solution : As 𝐴𝑣𝑒𝑟𝑎𝑔𝑒 = 𝑆𝑢𝑚 𝑜𝑓 𝑣𝑎𝑙𝑢𝑒𝑠 𝑇𝑜𝑡𝑎𝑙 𝑛𝑢𝑚𝑏𝑒𝑟 𝑜𝑓 𝑉𝑎𝑙𝑢𝑒𝑠 So ҧ 𝑥 = 5+7+8+10+5 5 = 35 5 =7 Answer
  • 6.
    Example 2 :The number of calls that a local police department responded to for a sample of 9 months is shown. Find the mean. 475, 447, 440, 761, 993, 1052, 783, 671, 621 Solution: 𝐴𝑣𝑒𝑟𝑎𝑔𝑒 = 𝑆𝑢𝑚 𝑜𝑓 𝑣𝑎𝑙𝑢𝑒𝑠 𝑇𝑜𝑡𝑎𝑙 𝑛𝑢𝑚𝑏𝑒𝑟 𝑜𝑓 𝑉𝑎𝑙𝑢𝑒𝑠 So ҧ 𝑥 = 475+ 447+ 440+761+993+ 1052+ 783+ 671+ 621 9 ҧ 𝑥 = 6243 9 ത x ≈ 693.7 (Approximately)
  • 7.
    Mean of GroupedData Mean for grouped Data ҧ 𝑥 = σ 𝑓𝑖𝑥𝑖 𝑛 Where ҧ 𝑥 is mean 𝑓𝑖 is frequency of class 𝑥𝑖 is mid point of class 𝑛 is cumulative frequencies
  • 9.
    Example: Find Meanof these data represent the net worth (inMillions) of 46 national cooperations. Class Limits Frequencies 10-20 3 21-31 8 32-42 15 43-53 7 54-64 10 65-75 3
  • 10.
    The Weighted Mean Sometimesyou must find the mean of a data set in which not all values are equally represented. When there number values of a quantity , we use weighed mean technique to calculate. The weighted mean of a variable X is calculated by multiplying each value by its corresponding weight and dividing the sum of the products by the sum of the weights.
  • 11.
  • 12.
    The Median The medianis the midpoint of the data array. Before finding this point, the data must be arranged in ascending or increasing order. When the data set is ordered, it is called a data array.
  • 13.
    Example: The numberof tornadoes that have occurred in the United States over an 7-year period follows. Find the median. 684, 764, 656, 702, 856, 1133 , 1132 Solution Step 1 : Arranging the data values in ascending order. 684, 764, 656, 702, 856, 1133 , 1132 Step 2: Data in ascending order 656, 684, 702, 764, 856, 1132, 1133 Step 3: the middle value in the data is 764 . Hence Median is 764
  • 14.
    Example: The numberof tornadoes that have occurred in the United States over an 8-year period follows. Find the median. 684, 764, 656, 702, 856, 1133 , 1132,1303 Solution Step 1 : Arranging the data values in ascending order. 684, 764, 656, 702, 856, 1133 , 1132, 1303 Step 2: Data in ascending order 656, 684, 702, 764, 856, 1132, 1133,1303 Step 3: the middle values in the data are 764 and 856 Hence Median is 764+856 2 = 1620 2 = 810 Answer
  • 15.
    MEDIAN OF GROUPEDDATA C is cumulative frequency preceding median class ℎ is width of median class 𝑓 is frequency of median class 𝑛 is sum of frequencies of all classes Where 𝑙 is lower class boundary Median of Grouped Data = 𝑙 + ℎ 𝑓 𝑛 2 − 𝐶
  • 16.
    Steps for findingthe Median Step 1: 𝑛 2 half of total observations Step 2 : Median Class Step 3 : terms of median class 𝑓 𝑎𝑛𝑑 ℎ Step 4 : Cumulative Frequencies (C) before median class
  • 17.
    Example: Find Medianof these data represent the net worth (inMillions) of 46 national cooperations. Class Limits Frequencies 10-20 3 21-31 8 32-42 15 43-53 7 54-64 10 65-75 3
  • 18.
    Class Limits FrequenciesCummulative Frequency C 10-20 3 3 21-31 8 11 32-42 15 26 43-53 7 33 54-64 10 43 65-75 3 46 ෍ 𝑓 = 46 Solution : 32-42 is median class because C is greater than 𝒏 𝟐 here. So Frquency of median class is 𝑓 = 15 Width of of median class is ℎ = 11 𝑎𝑛𝑑 𝑙 = 31.5
  • 19.
    Median for groupeddata is given by = 𝑙 + ℎ 𝑓 𝑛 2 − 𝐶 = 31.5 + 11 15 46 2 − 11 = 31.5 + 8.8 = 40.3 Answer
  • 20.
    Mode The value thatoccurs most often in a data set is called the mode. Example : Find the mode of the temperature ℃ of week of June in Karachi, Sindh 40 , 45 , 44 , 44,43,42 , 44 Solution : Here most frequent number is 44 so 44 is mode
  • 21.
    There can bemore than one Mode(s) or no mode at all Example 1: 4,7,7,8,9,3,7 here 7 is mode (Unimodal data) Example1: 5,6,5,6,5,6 here 5 and 6 are modes (Bimodal data ) Example 2: 3,6,4,3,6,4 here 3,4 are 6 are modes (Multimodal data)
  • 22.
    MODE OF GROUPEDDATA ℎ is width of median class 𝑓2 is frequency succeding modal class 𝑓𝑚 is frequency of modal class 𝑓1 is frequency preceding modal class Where 𝑙 is lower class boundary of modal class Mode of Grouped Data = 𝑙 + (𝑓𝑚−𝑓1) (𝑓𝑚−𝑓1)+(𝑓𝑚−𝑓2) . ℎ
  • 23.
    Example: Find Modeof these data represent the net worth (inMillions) of 46 national cooperations. Class Limits Frequencies 10-20 3 21-31 8 32-42 15 43-53 7 54-64 10 65-75 3
  • 24.
    Solution: Table ModalClass is 32-42 with frequency 𝒇𝒎 = 𝟏𝟓 Class Limits Frequencies 10-20 3 21-31 8 32-42 15 43-53 7 54-64 10 65-75 3 𝒇𝟏 = 𝟖 , 𝒇𝟐 = 𝟕 , 𝒉 = 𝟏𝟏 𝒂𝒏𝒅 𝒍 = 𝟑𝟏. 𝟓
  • 25.
    As Mode =𝑙 + (𝑓𝑚−𝑓1) (𝑓𝑚−𝑓1)+(𝑓𝑚−𝑓2) . ℎ = 31.5 + (15−8) (15−8)+(15−7) . 11 = 31.5 + 5.133 = 36.633
  • 26.
    Midrange The midrange isa rough estimate of the middle The midrange is defined as the sum of the smallest and largest values in the data set, divided by 2. 𝑀𝑖𝑑𝑟𝑎𝑛𝑔𝑒 = 𝑠𝑚𝑎𝑙𝑙𝑒𝑠𝑡 𝑣𝑎𝑙𝑢 + 𝐿𝑎𝑟𝑔𝑒𝑠 𝑣𝑎𝑙𝑢𝑒 2
  • 27.
    Example : Thenumber of bank failures for a recent five-year period is shown. Find the midrange. 3, 30, 148, 157, 71 Solution : As 𝑀𝑖𝑑𝑟𝑎𝑛𝑔𝑒 = 𝑠𝑚𝑎𝑙𝑙𝑒𝑠𝑡 𝑣𝑎𝑙𝑢 +𝐿𝑎𝑟𝑔𝑒𝑠 𝑣𝑎𝑙𝑢𝑒 2 Smallest Value =3 and Largest Value = 157 so 𝑀𝑅 = 3+157 2 = 160 2 MR = 80 Answer