Download to read offline
![International Journal of Modern Research in Engineering and Technology (IJMRET)
www.ijmret.org Volume 3 Issue 11 ǁ November 2018.
w w w . i j m r e t . o r g I S S N : 2 4 5 6 - 5 6 2 8 Page 15
Study on the LandCover Classification using UAV Imagery
Kang JoonGu1
, Kim JongTae2
*, Yeo HongKoo1
1
(Department of Land, Water and Environment Research, Korea Institute of Civil Engineering and Building
Technology, Republic of Korea)
2
(Nature & Technology Inc., Republic of Korea)
ABSTRACT : The study was carried out using the UAV for analyzing the characteristics of debris in order to
present the methodology to estimate the quantitative amount of debris caught in small river facilities. A total of
six small rivers that maintained the form of a natural river were selected for collecting UAV images, and the
grouping of each target in the image was carried out using the object-based classification method, and based on
the object-based classification result of the UAV images, the land cover classification for the status of factors
causing the generation of debris for six target sections was carried out by applying the screen digitizing method.
In addition, in order to verify the accuracy of the classification result, the error matrix was performed, securing
the reliability of the result. The accuracy analysis result showed that for all six target sections, the overall
accuracy was 93.95% and the Kappa coefficient was 0.93, showing an excellent result.
KEYWORDS : Debris, land cover classification, river,screen digitizing method,UAV imagery
I. INTRODUCTION
A low-resolution satellite image can be
obtained repeatedly on a short cycle, but for a
space with a relatively small area such as a small
river, such an image has low spatial resolution so
that it is not suitable for monitoring purposes. On
the other hand, a high-resolution satellite image
enables periodic monitoring, but due to the
limitations imposed by costs and time periods, it is
not suitable for monitoring a small river. In
addition, a satellite image using a manned aircraft
can be applicable in the right place, but it is too
costly.
As a measure to solve and supplement this type
of problem, monitoring using UAV (unmanned
aerial vehicle) is emphasized as an excellent
countermeasure, and studies regarding remote
sensing of a river using a drone are being carried
out actively both at home and abroad among
various application fields [1-4].
Especially, the technology using the UAV has
features that enables regular monitoring to be
carried out in the case of a disaster and
environmental elements (grass, tree, etc.) that may
become debris can be classified in a narrow basin
such as small river basin. In addition, the remote
sensing method using a hyperspectral image
whereby a unique wavelength range can be
detected has also been launched [5-6] and studies
regarding the investigation and analysis of tidal
current using a drone are also being carried out [7-
8].
However, river monitoring and field application
cases remain at the level of basic research, and
almost no analysis of causes for debris in a small
river using a drone has been carried out.
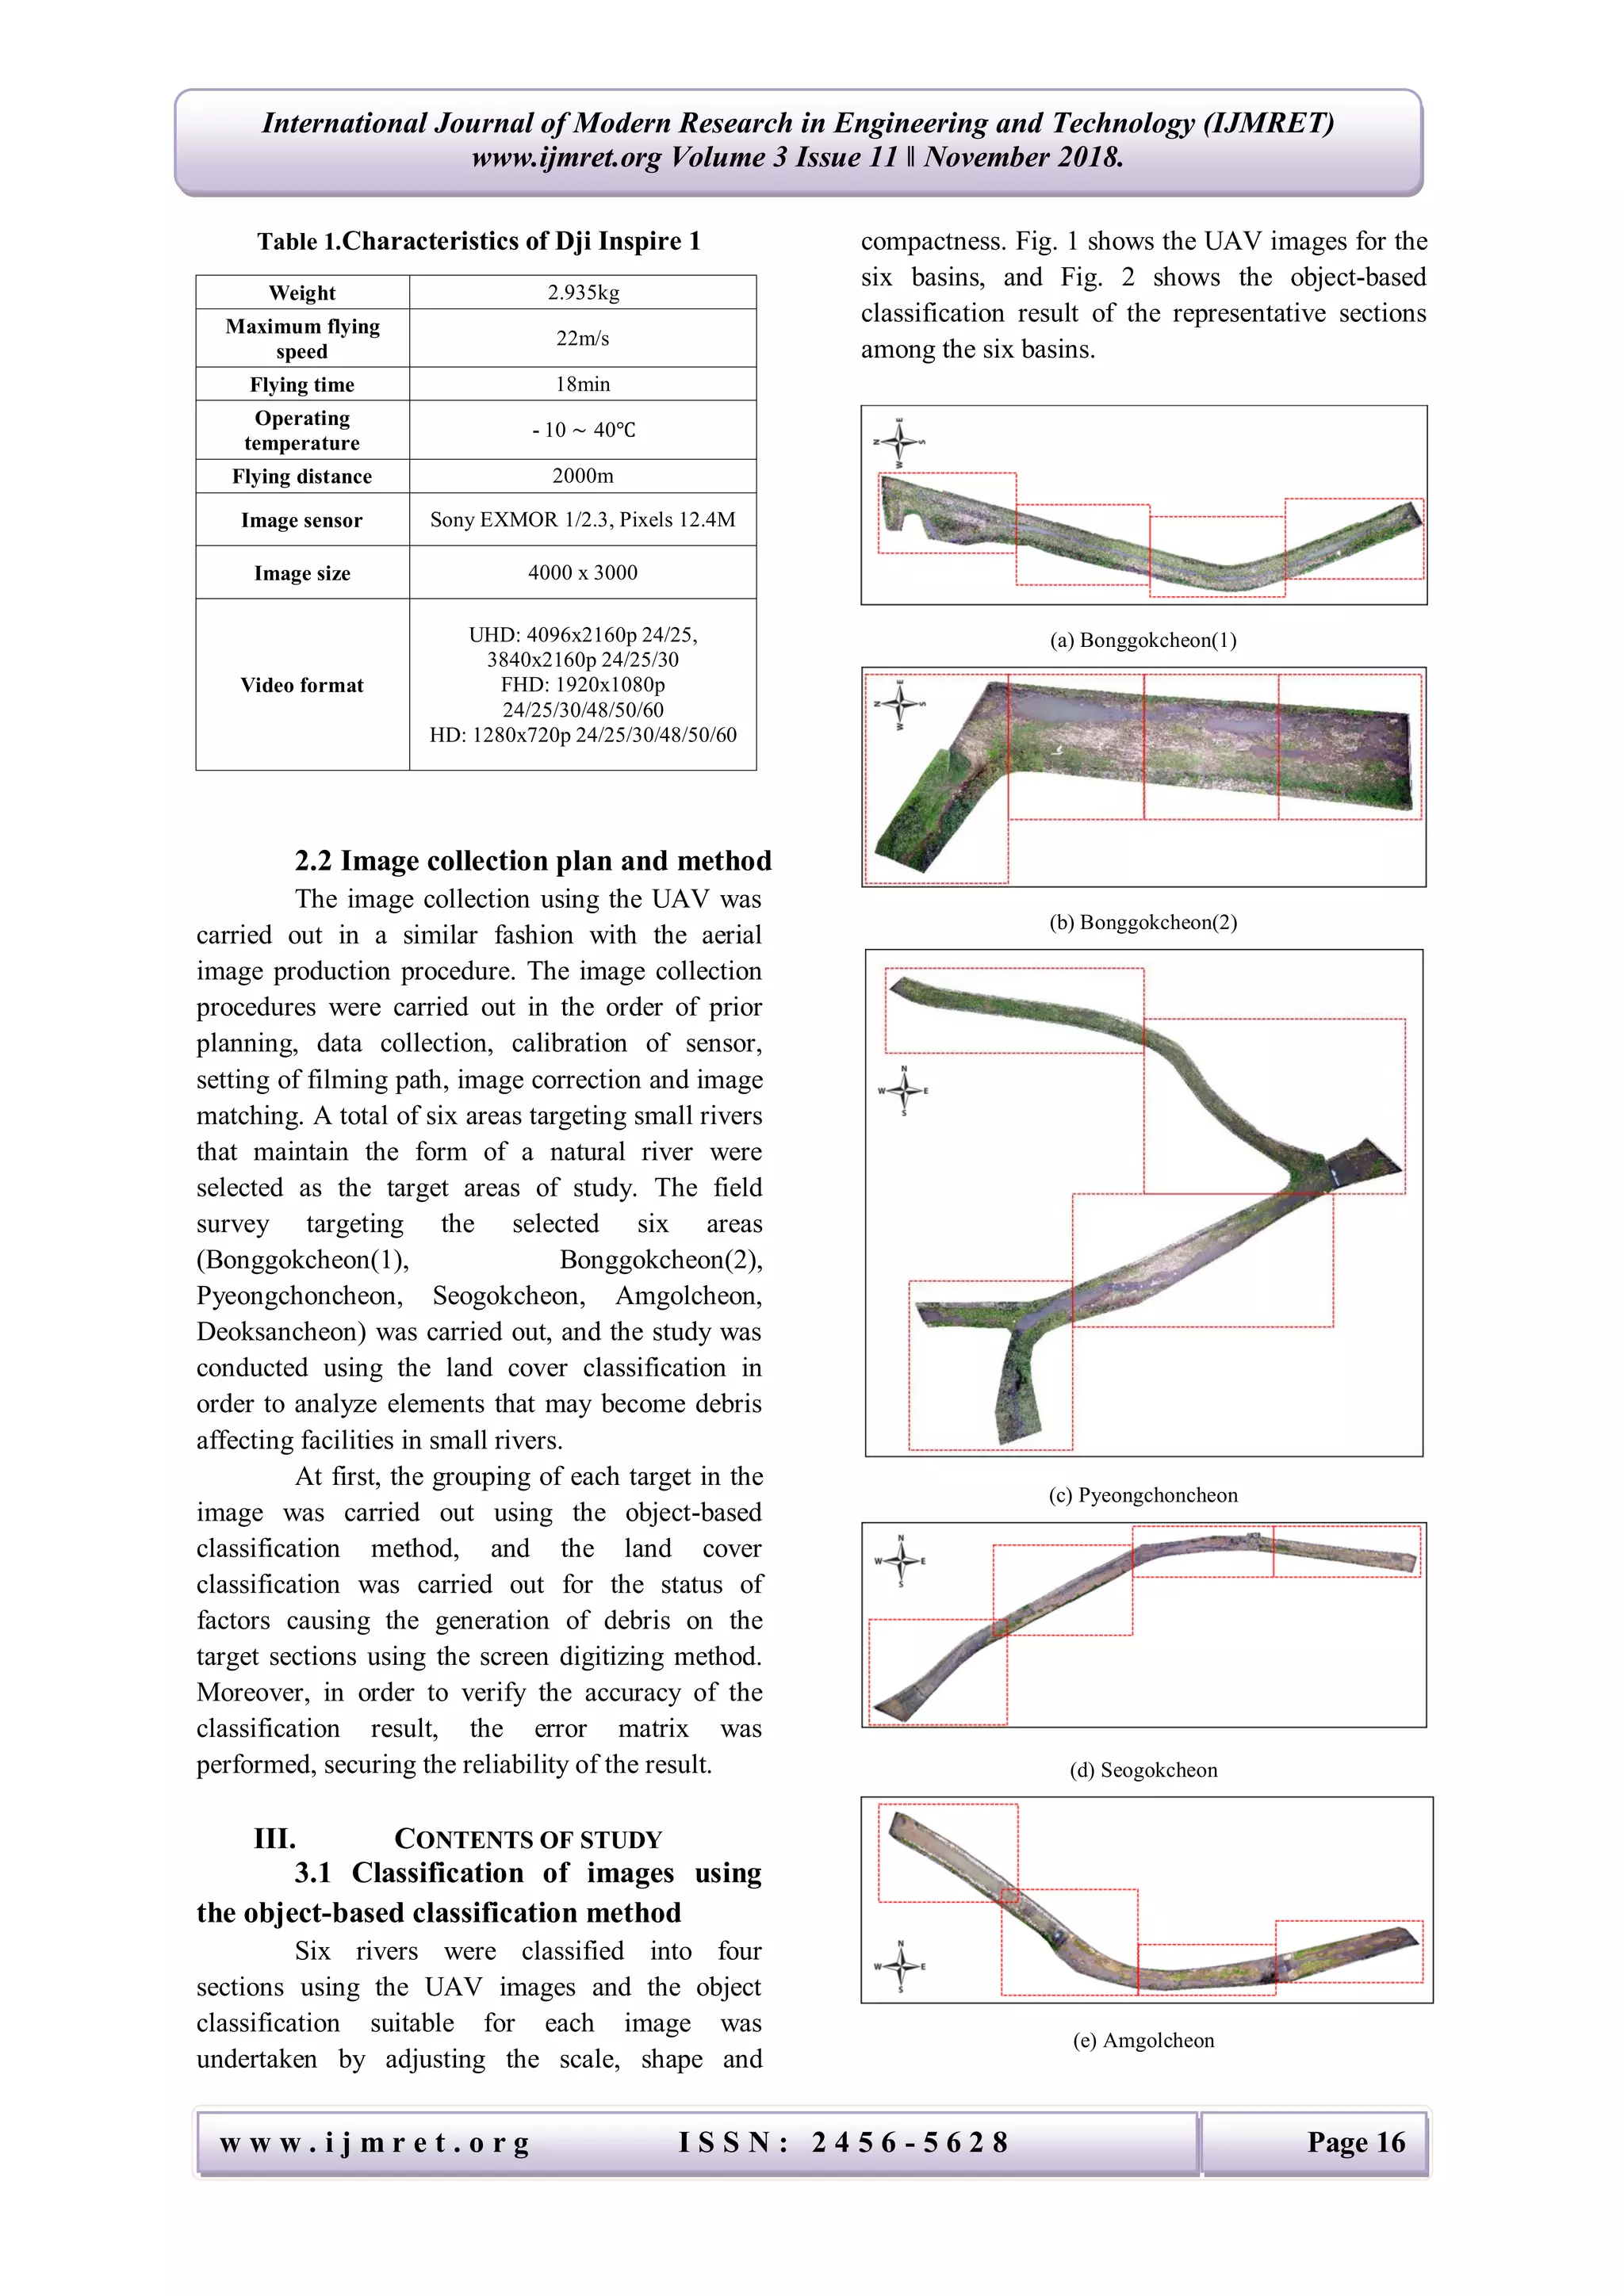
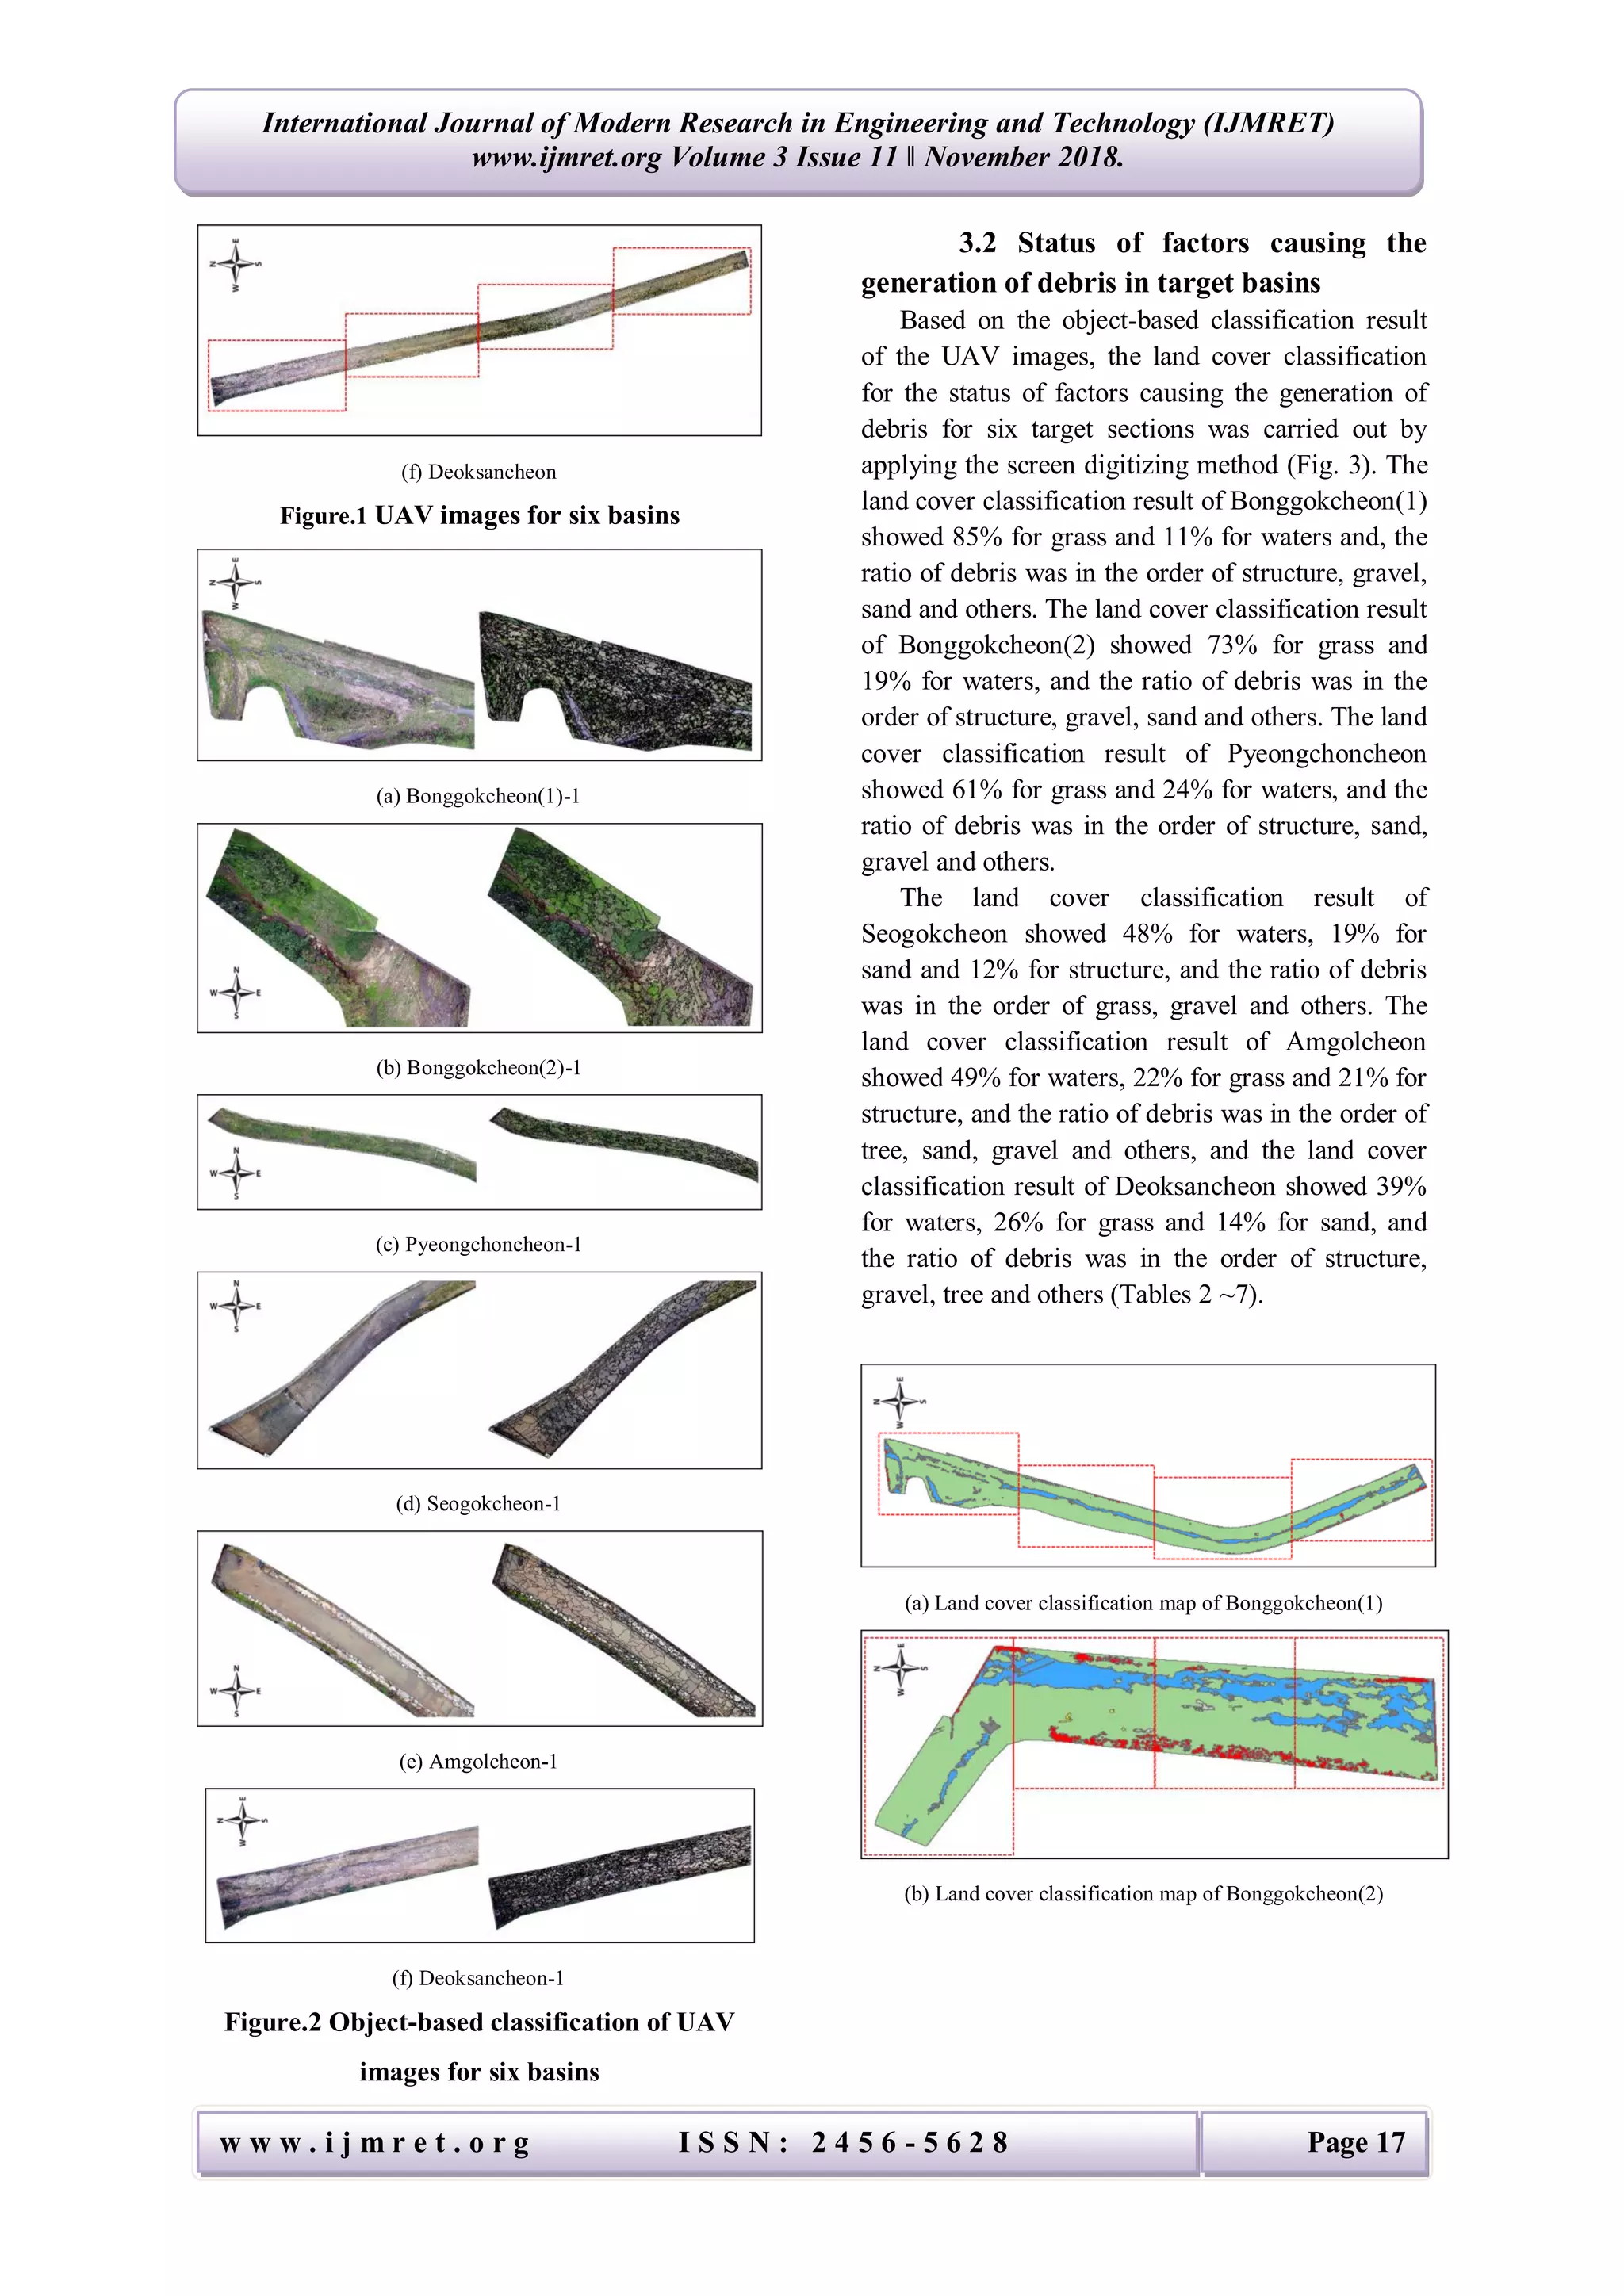
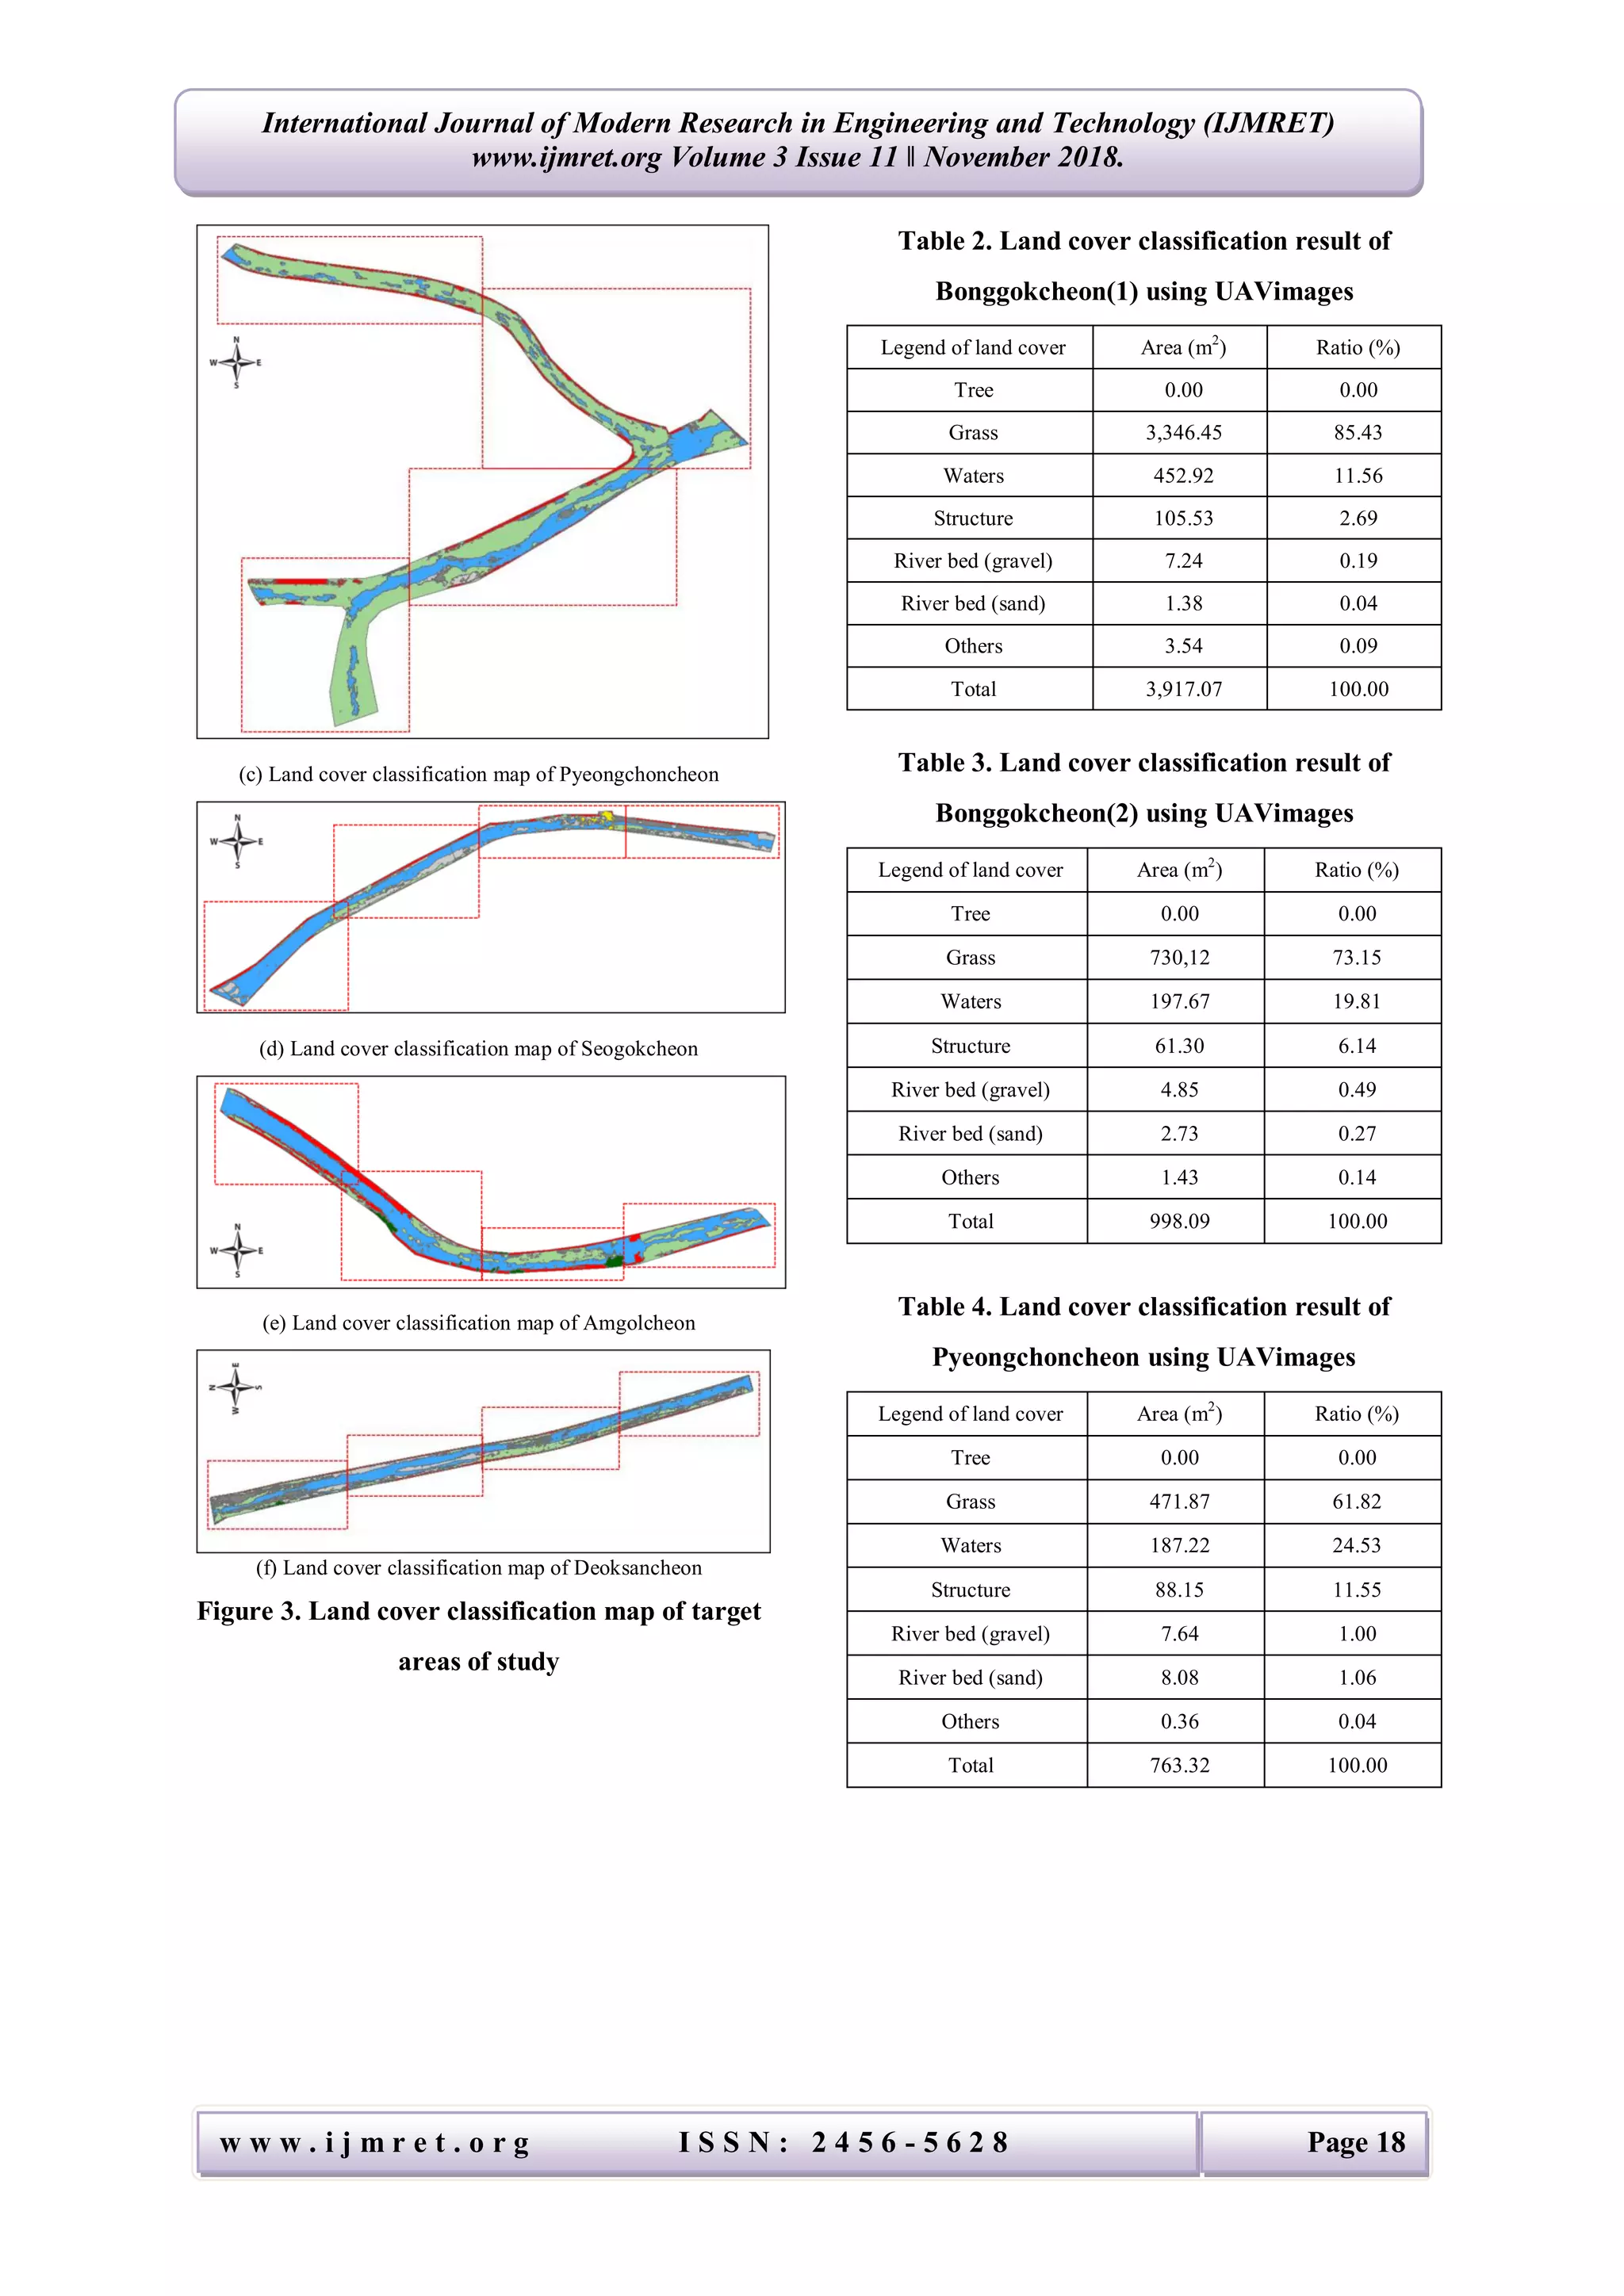
Therefore, image collection was carried out for
six river basins using the UAV and proper object
classification for each image was carried out by
adjusting the scale, shape and compactness. Based
on the object-based classification result of the UAV
images, the land cover classification for the status
of factors causing the generation of debris was
carried out by applying the screen digitizing
method.
II. RESEARCH METHOD
2.1 Characteristics of UAV
The UAV used for carrying out the analysis of
causes and characteristics for the occurrence of
debris using the land cover classification was DJI
’ s Inspire 1.0 that featured 22 m/s for the
maximum speed, 18 minutes for the flying time and
2 km for the flying distance and it was equipped
with the Sony EXMOR 1/2.3 image sensor. Table 1
shows the characteristics of UAV.](https://image.slidesharecdn.com/03111522-190108071301/75/Study-on-the-LandCover-Classification-using-UAV-Imagery-1-2048.jpg)
![w w w . i j m r e t . o r g I S S N : 2 4 5 6 - 5 6 2 8 Page 21
International Journal of Modern Research in Engineering and Technology (IJMRET)
www.ijmret.org Volume 3 Issue 11 ǁ November 2018.
(Error matrix)
Landcover
classificationdata
Referencedata(fieldinvestigationandvisualreading)
River
bed
(gravel)
River
bed
(sand)
Others Facility Grass Tree Waters Total
User’s
accuracy
(%)
Landcover
classification
Riverbed
(gravel)
9 1 - - - - - 10 90.0
Riverbed
(sand)
- 10 - - - - - 10 100.0
Others - - 9 - 1 - - 10 90.0
Facility - - - 10 - - - 10 100.0
Grass - - - 1 9 - - 10 90.0
Tree - - - - - 10 - 10 100.0
Waters - - - - - - 10 10 100.0
Total 9 11 9 11 10 10 10 70 -
User’s
accuracy
(%)
100.0 90.9 100.0 90.9 90.0 100.0 100.0 - -
Overallaccuracy(%) 95.71
Kappacoefficient 0.95(Excellent)
Table 15. Accuracy analysis of all target areas
(Error matrix)
Landcover
classificationdata
Referencedata(fieldinvestigationandvisualreading)
River
bed
(gravel)
River
bed
(sand)
Others Facility Grass Tree Waters Total
User’s
accuracy
(%)
Landcover
classification
Riverbed
(gravel)
55 3 - 1 1 - - 60 91.7
Riverbed
(sand)
1 52 - - 7 - - 60 86.7
Others 1 - 52 2 5 - - 60 86.7
Facility - - - 60 - - - 60 100.0
Grass - 1 - 1 58 - - 60 96.7
Tree - - - - - 20 - 20 100.0
Waters - - - - - - 60 60 100.0
Total 57 56 52 64 71 20 60 380 -
User’s
accuracy
(%)
96.5 92.9 100.0 93.8 81.7 100.0 100.0 - -
Overallaccuracy(%) 93.95
Kappacoefficient 0.93(Excellent)
IV. CONCLUSION
The study was carried out using the UAV for
analyzing the characteristics of debris in order to
present the methodologyto estimate the quantitative
amount of debris caught in small river facilities. At
first, the control line for compensating the scale of
UAV image was installed, and the images were
taken from various directions in order to calculate
the accumulated amount of debris. A total of six
small rivers that maintained the form of a natural
river were selected for collecting UAV images, and
the grouping of each target in the image was
carried out using the object-based classification
method, and the land cover classification was
carried out for the status of factors causing the
generation of debris on the target sections using the
screen digitizing method. In addition, in order to
verify the accuracy of the classification result, the
error matrix was performed, securing the reliability
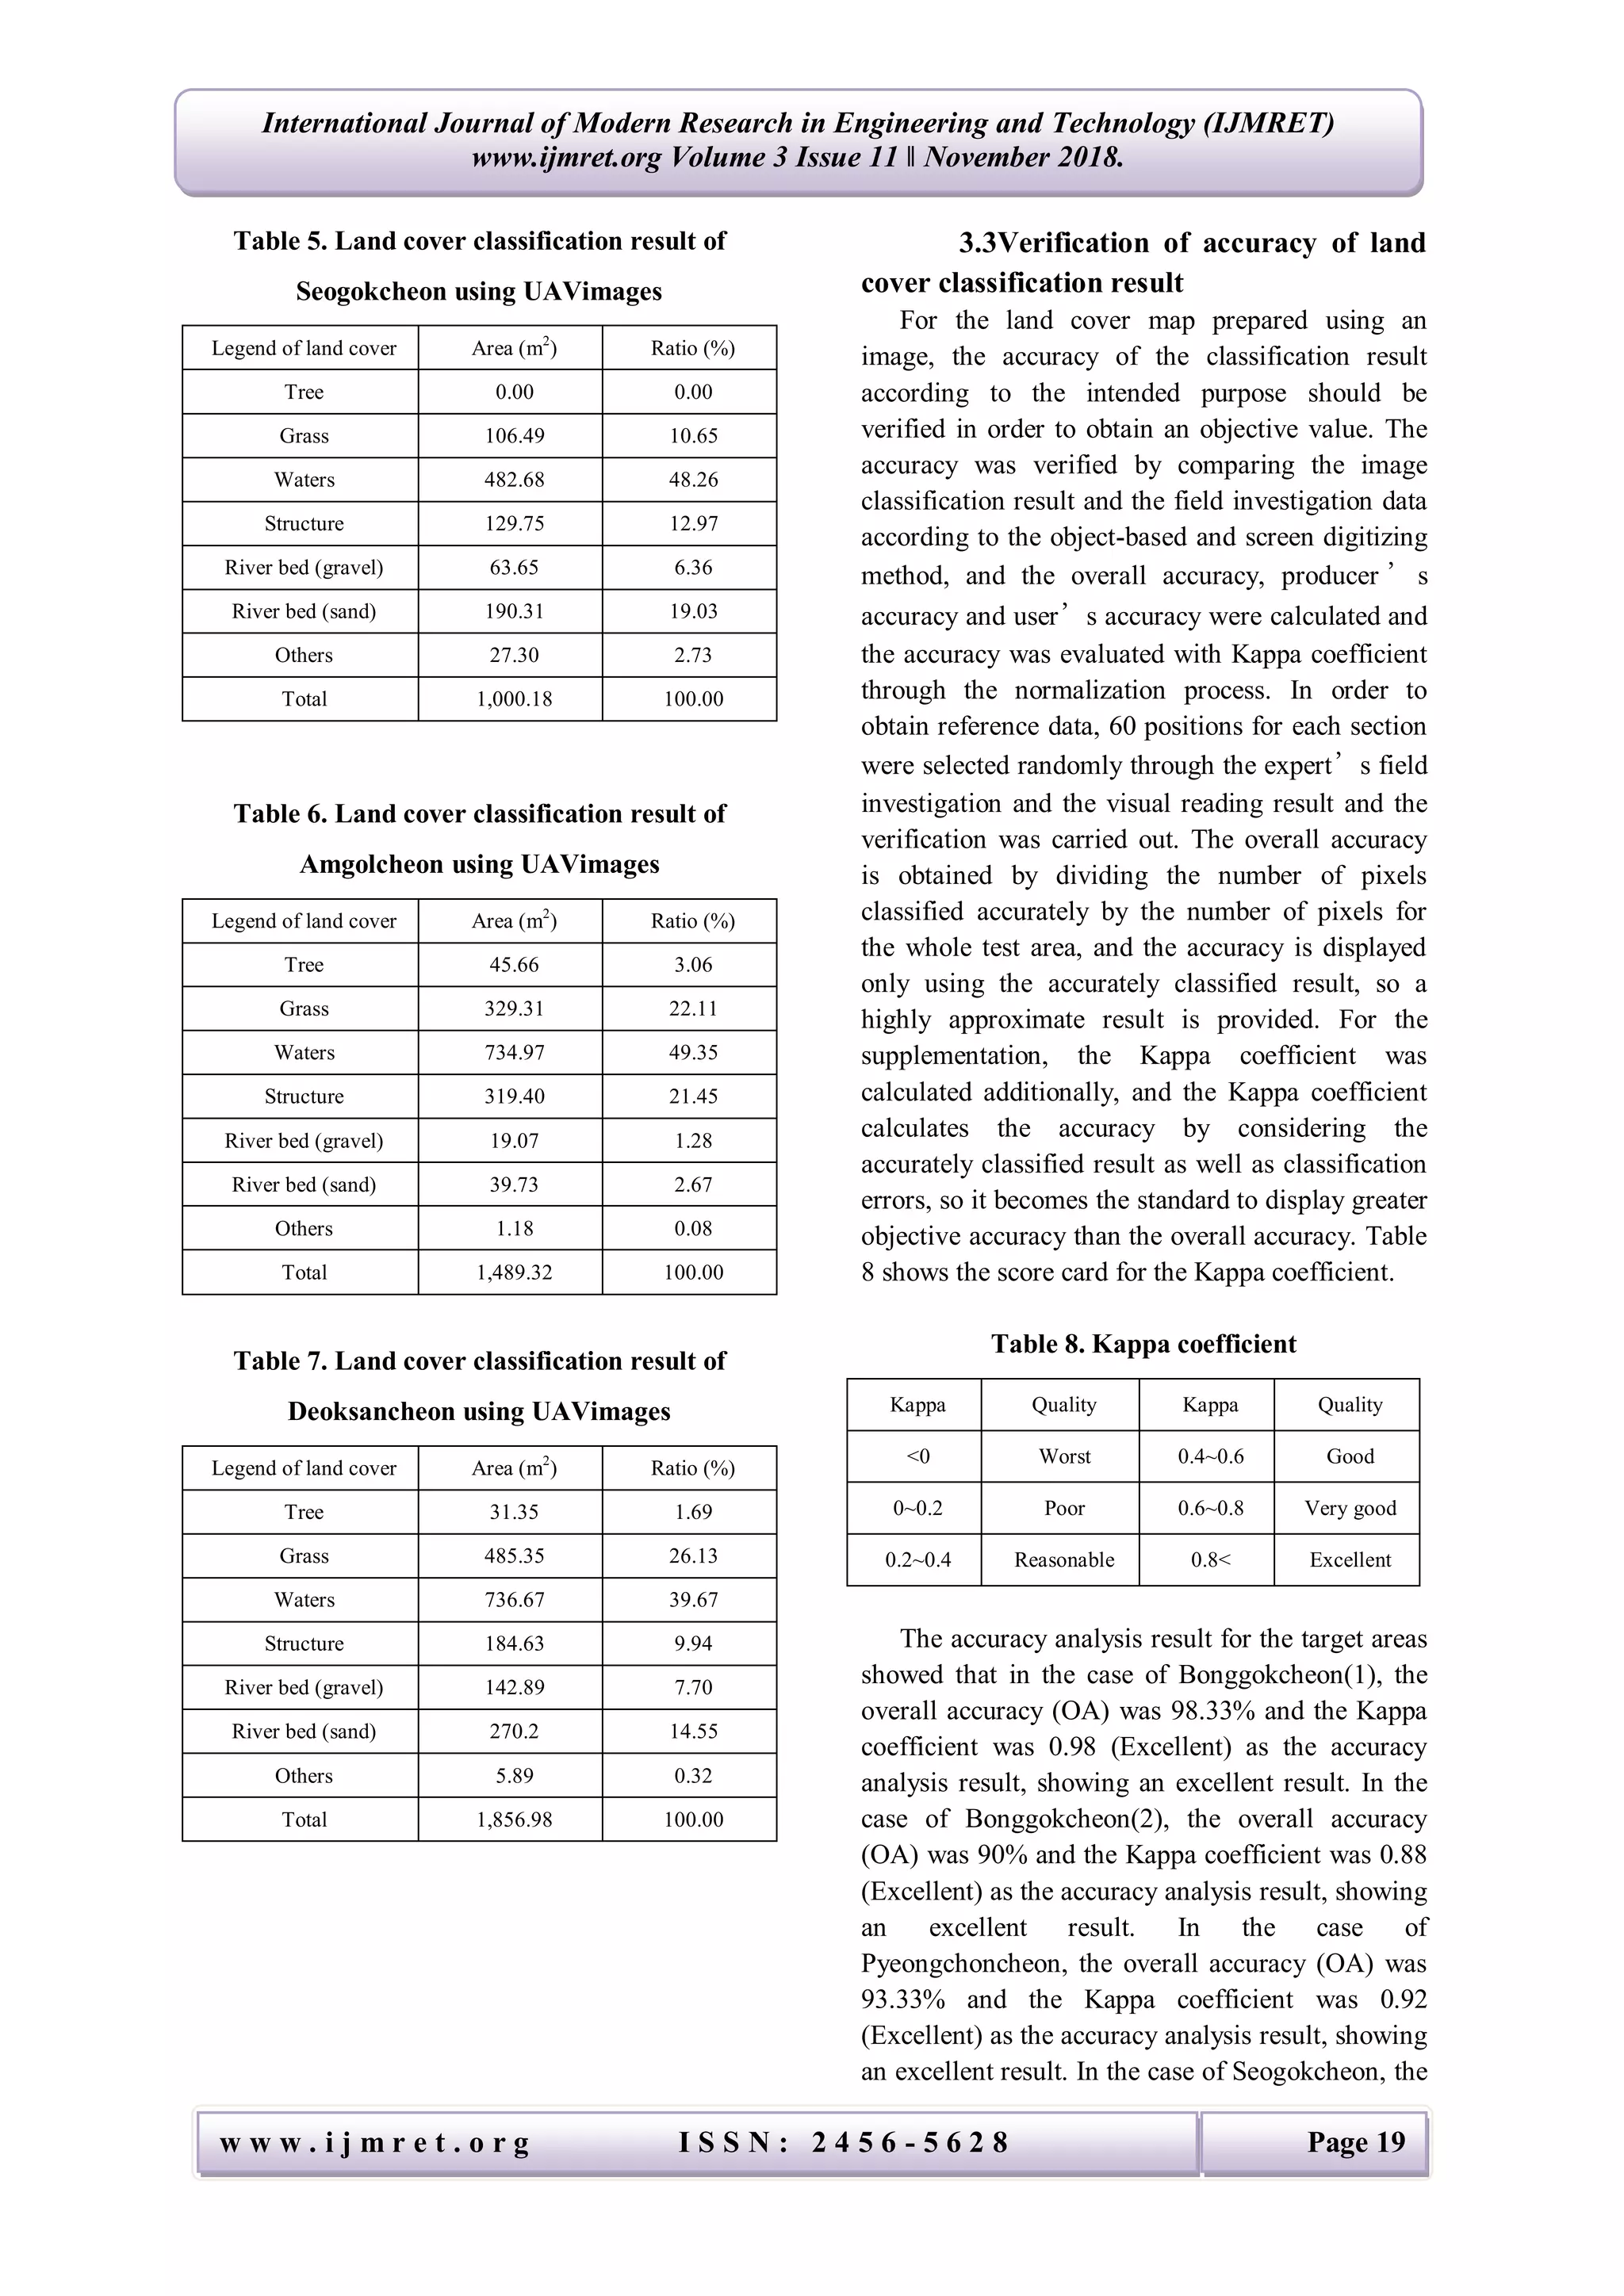
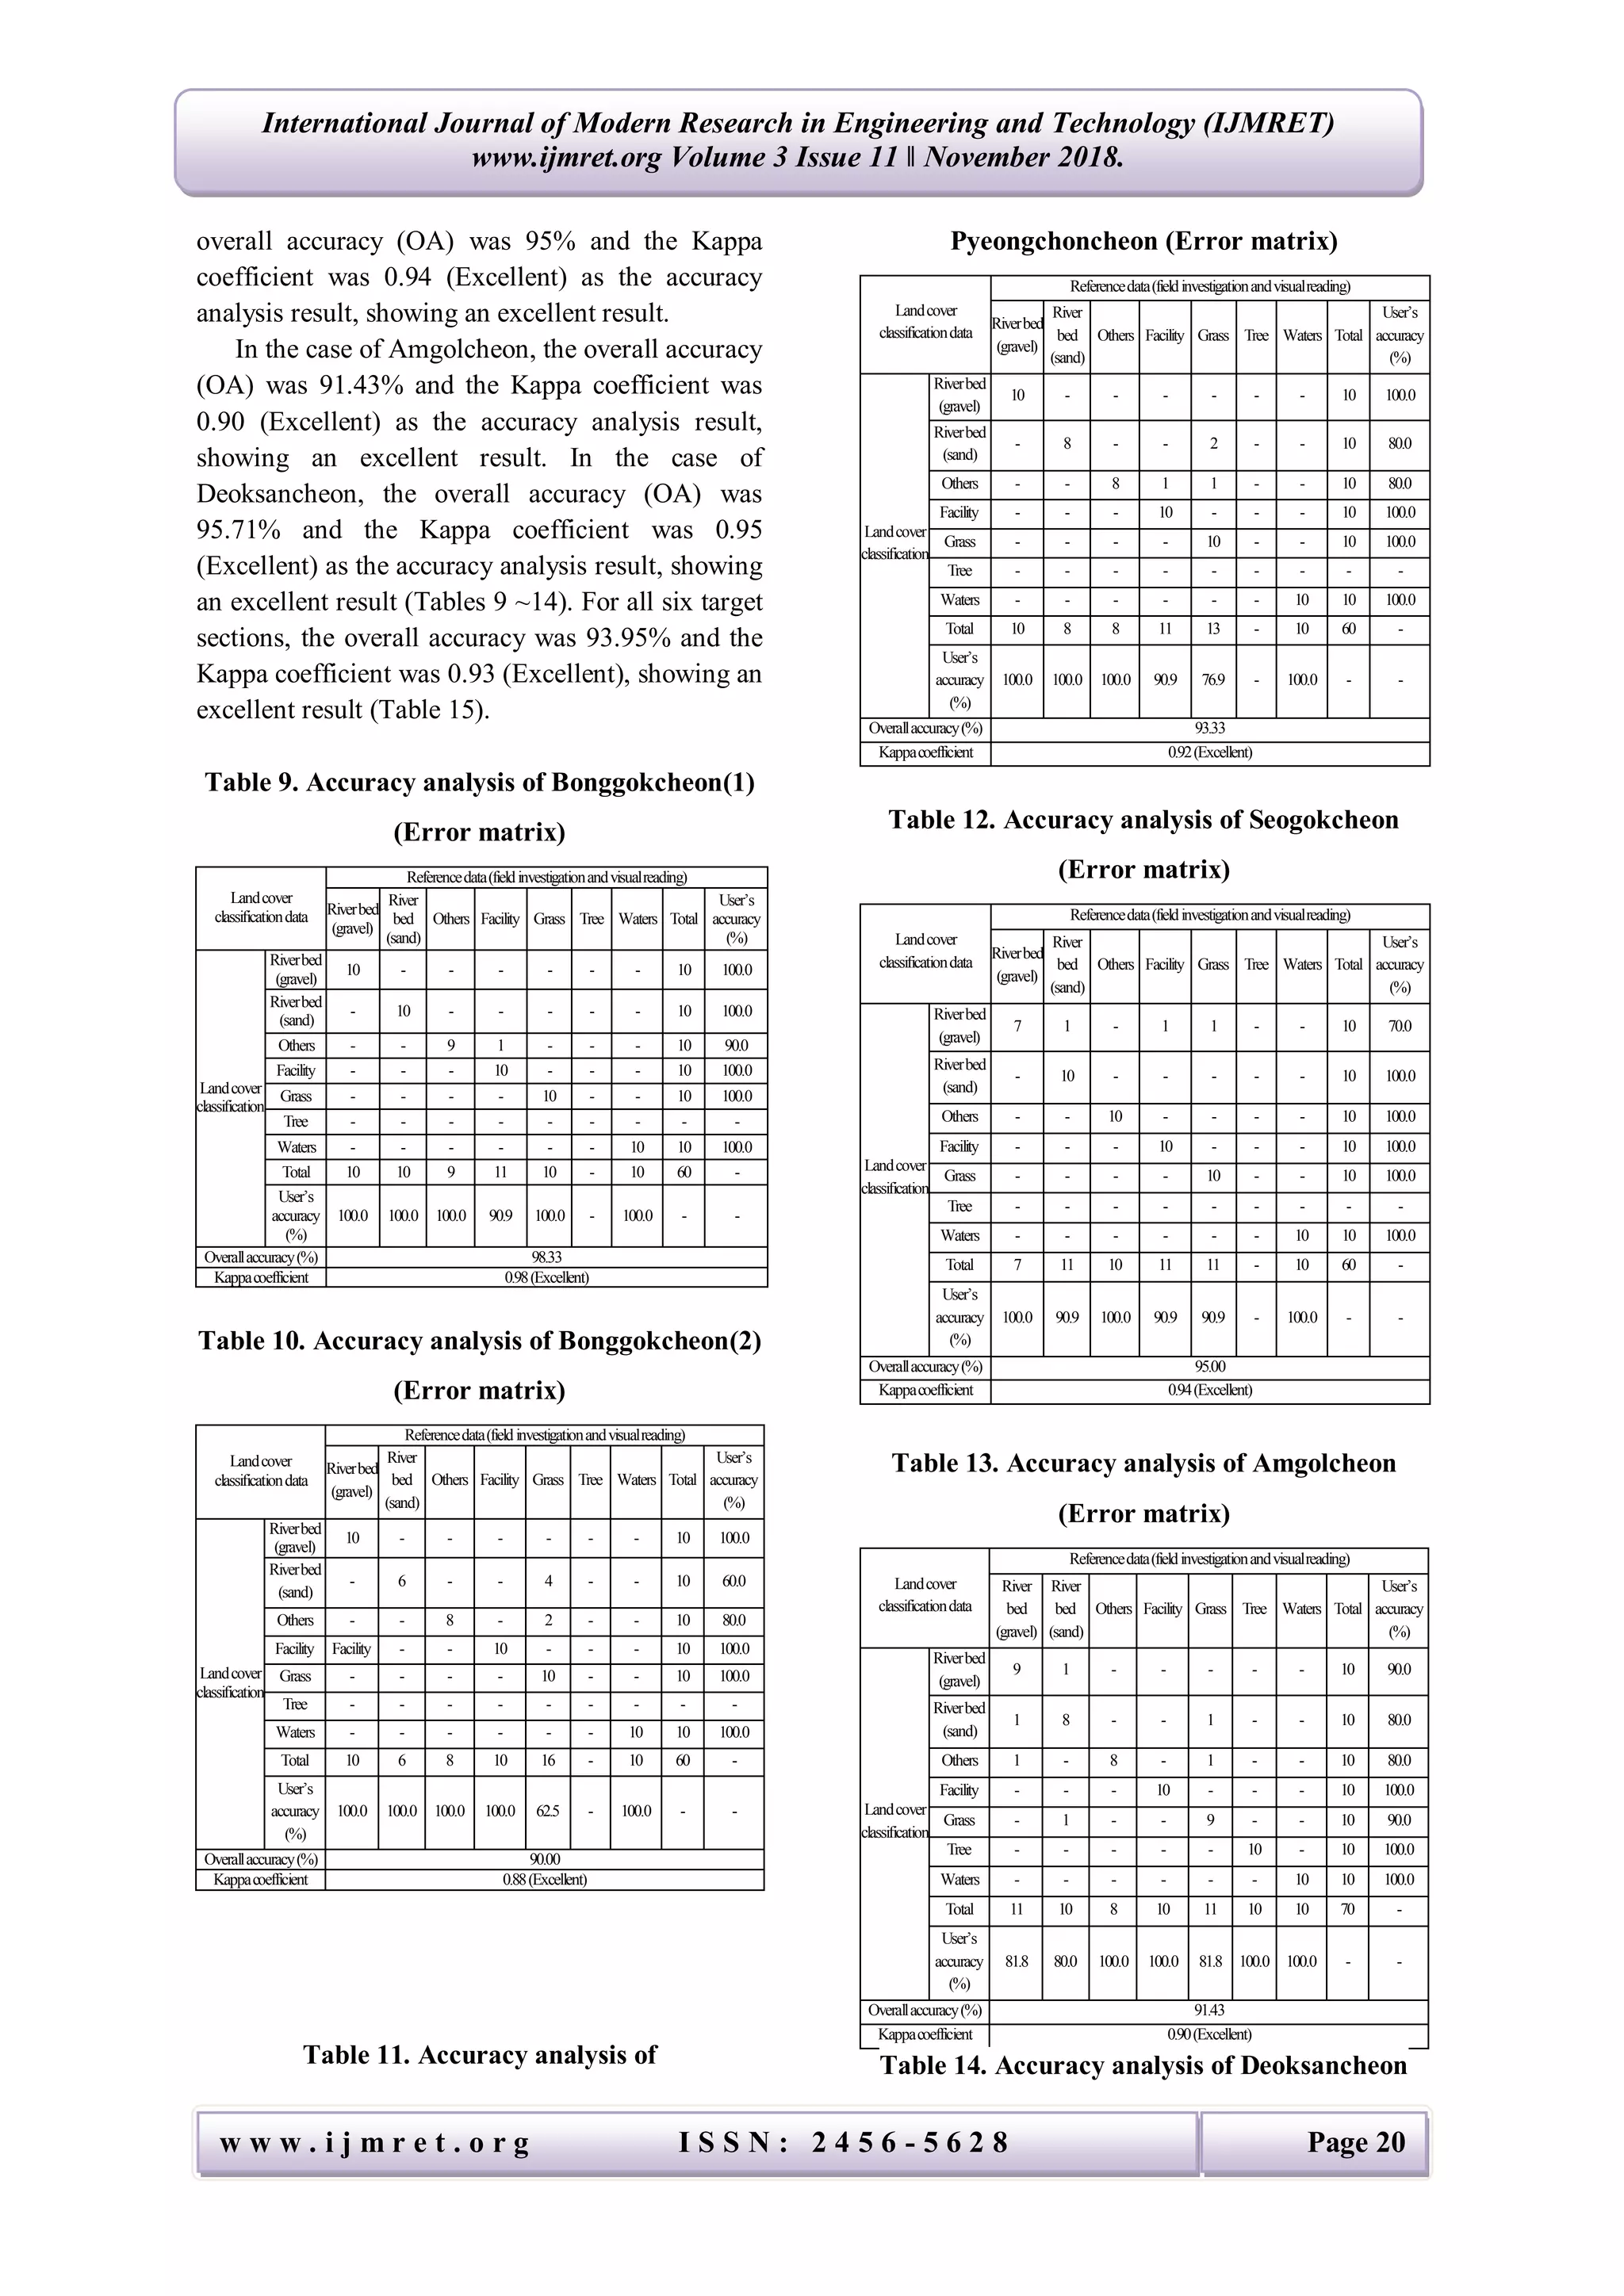
of the result. The accuracy analysis result showed
that for all six target sections, the overall accuracy
was 93.95% and the Kappa coefficient was 0.93
(Excellent), showing an excellent result.
V. Acknowledgements
This research was supported by a
grant(16AWMP-B121100-01) from the Water
Management Research Program funded by
Ministry of Land, Infrastructure and Transport of
Korean government.
REFERENCES
[1] J. Mckean, D. Isaak, and W. Wright, Improving Stream
Studies With a Small- Footprint Green Lidar, Earth &
Space Science News, 90(39), 2009, 341-42.
[2] T. Allouis, J.S. Bailly, Y. Pastol, and C. Le Roux,
Comparison of LiDAR waveform processing methods for
very shallow water bathymetry using Raman, near-infrared
and green signals, Earth Surf. Process. Landf., 35, 2010,
640–50.
[3] A. Lucieer, Z. Malenovsky, T. Veness, and L. Wallace,
Hyper UAS—Imaging Spectroscopy from a Multirotor
Unmanned Aircraft System, Journal of Field Robotics,
31(4), 2014, 571-90.
[4] J. McLean, Bathymetric Mapping From a Small UAV
Compact, Lightweight Lidar System, Sea Technology,
56(8), 2015, 23-26.
[5] E.L. Hestir, V.E. Brando, M. Bresciani, C. Giardino, and E.
Matta, Measuring freshwater aquatic ecosystems: The
need for a hyperspectral global mapping satellite mission,
remote Sensing of Environment, 167, 2015, 181-95.
[6] D.V. Merwe, and K.P. Price, Harmful Algal Bloom
Characterization at Ultra-High Spatial and Temporal
Resolution Using Small Unmanned Aircraft Systems,
Toxins-Open Access Toxinology Journal, 7(4), 2015,
1065-1078.
[7] T. Fráter, T. Juzsakova, J. Lauer, L. Dióssy, and A. Rédey,
Unmanned Aerial Vehicles inEnvironmental Monitoring—
An Efficient Way for Remote Sensing, Journal of
Environmental Science and Engineering, 4, 2015, 85-91.
[8] T. Su, and H. Chou, Application of Multispectral Sensors
Carried on Unmanned Aerial Vehicle (UAV) to Trophic
State Mapping of Small Reservoirs: A Case Study of Tain-
Pu Reservoir in Kinmen, Taiwan, Remote Sensing, 2015,
10078-10097.](https://image.slidesharecdn.com/03111522-190108071301/75/Study-on-the-LandCover-Classification-using-UAV-Imagery-7-2048.jpg)

The study examines land cover classification using UAV imagery to analyze debris characteristics in small river facilities, achieving an overall accuracy of 93.95% and a kappa coefficient of 0.93. Six natural rivers were selected for UAV image collection, and object-based classification methods were applied to assess factors contributing to debris generation. The findings indicate a high effectiveness of UAV technology in monitoring and classifying land cover in small river basins.


![Heritage hetherington lidar_pdf[1]](https://cdn.slidesharecdn.com/ss_thumbnails/heritagehetheringtonlidarpdf1-100701210824-phpapp02-thumbnail.jpg?width=640&height=640&fit=bounds)