SlideShare a Scribd company logo
Research Inventy: International Journal Of Engineering And Science
Vol.4, Issue 1 (January 2014), PP 37-45
Issn(e): 2278-4721, Issn(p):2319-6483, Www.Researchinventy.Com

Delineation of Magnetic Zones of Sokoto Basin, in Northwestern
Nigeria, Using Aeromagnetic Data.
Bonde,D. S.*1; Udensi E.E2; Momoh M1.
1

Department of physics, Kebbi State University of Science and Technology, Aliero.
2
Department of physics, Federal University Technology, Minna.

ABSTRACT:The Sokoto Sedimentary Basin in northwestern Nigeria, is situated between latitudes 10 o 30″ N to
14o 00″ N and longitude 3o30″ E to 7o 00″ E with an estimated area of 59,570 km 2.We used visual interpolation
method to digitized twenty nine aeromagnetic maps of the Basin, the data obtained was used to produce the
Total Magnetic Intensity and the Residual Maps. The Residual Magnetic Map was subjected to Upward
continuation techniques; applied at 2km, 3km, 5km, 7km, 10km and 15km. The results of the studies delineated
areas of higher sedimentations such as Isah, Rabah, Talata/Mafara and Gandi in the northeastern part of the
area. These areas of relatively thicker sediments, identified in this study, are therefore the most probable sites
for prospect of hydrocarbon accumulation in the area.

KEYWORDS:Magnetic Anomaly,Total magnetic Intensity Map, Residual map.
I.

INTRODUCTION

The earth and its contents have long been of concern to mankind. Man has tried to unravel its
complexity and delve into its origin via various geophysical methods. The subsurface has been of particular
concern to geoscientists, who seek to investigate it using diverse means, some for the purpose of having
knowledge, while others do it for exploration of economic resources such as minerals and hydrocarbons. With
the advances in technology and the need to have a clearer picture of the earth subsurface and its contents, the
earth
scientists
have deemed it necessary to utilize the properties associated with earth’s interior.
Geophysics involves the application of physical principles and quantitative physical measurements in order to
study the earth’s interior. The analysis of these measurements can reveal how the earth interior varies both
vertically and laterally, and the interpretation of which can reveal meaningful information on the geological
structures beneath Dobrin (1976).By working at different scales, geophysical methods may be applied to a wide
range of investigations from studies of the entire earth to exploration of a localized region of the upper crust for
engineering or other purposes (Kearey et al., 2004). A wide range of geophysical methods exist for each of
which there is an operative physical property to which the method is sensitive. The type of physical property to
which a method responds clearly determines its range of application.
Thus, for instance, magnetic method is very suitable for locating buried magnetic ore bodies because of
their magnetic susceptibility. Similarly, seismic and electrical methods are suitable for locating water table,
because saturated rock may be distinguished from dry rock by its higher seismic velocity and higher electrical
conductivity (Kearey et al., 2004). In exploration for subsurface resources, the geophysical methods are capable
of detecting and delineating local features of potential interest. Geophysical methods for detecting
discontinuities, faults, joints and other basement structures, include the following: magnetics, seismic,
resistivity, electrical, potential field, well logging, gravity, radiometric, thermal etc (Corell andGrauch,1985) .
Some geophysical methods such as gamma- ray spectrometry and remote sensing measure surface
attributes; others, such as thermal and some electrical methods are limited to detecting relatively shallow
subsurface geological features. Geophysical modeling provides generalized and no-unique solution to questions
concerning the concerning the geometry of the subsurface geologic structures (Reeves, 2005).Most economic
minerals, oil, gas, and groundwater lie concealed beneath the earth surface, thus hidden from direct view. The
presence and magnitude of these resources can only be ascertained by geophysical investigations of the
subsurface geologic structures in the area.In study of sedimentary basins for hydrocarbon potentials; depth
estimation of the sediments is very crucial because all other necessary conditions for hydrocarbon maturation
depend on the thickness of the basin. Therefore If the area under investigation has no previous
geological information and the primary aim of the study is to search for hydrocarbon deposits; the first question
that must be answered, is whether the sedimentary basin is large enough and thick enough to justify any further
investigations ( Reynolds,1990).Other criteria for assessing a basin for possible hydrocarbon accumulation are
as follows:

37
Delineation Of Magnetic Zones Of Sokoto Basin…






Source rock: The presence of a source rock with adequate organic materials of various types determines
whether oil or gas will be sourced in the process of hydrocarbon generation.
Reservoir rock: Reservoir rock ensures that hydrocarbon generated are accommodated in pore spaces that
exists between the grains in the subsurface.
Seal: seals are normally without pore spaces ensures that hydrocarbon generated in the reservoir rocks are
kept in place and prevented from migrating to the surface and subsequent loss.
Paleotemperatures: Paleotemperatures or ancient Paleotemperatures are responsible for generation of
hydrocarbon from organic matter.
Trap:The trap ensures that oil sealed in place does not migrate and be lost.

In this study, aeromagnetic data of Sokoto Basin was used to produce total magnetic intensity and residual
magnetic maps of the basin. The residual map was subjected to Upward continuation techniques; applied at
2km, 3km, 5km, 7km, 10km and 15km to delineate areas of higher sedimentation which might favor
accumulation of hydrocarbon..
1.1 The study area
The study area is the Sokoto Sedimentary Basin, in northwestern Nigeria (Figure1.1).The Sokoto Basin lies
between longitudes 3030″E and 6o58″E and latitudes 10o 20″N and 14o 00″N with an estimated area of 59,570
km2.The Basin is covered by twenty- nine half-degree aeromagnetic maps (8-13; 26-32; 48-54; 71-74; 94-97;
and 116-119) of the Geology Survey of Nigeria, now renamed the Nigerian Geological Survey Agency (NGSA).

The Sokoto Sedimentary Basin forms the southeastern segment of a large synclinal basin, the Iullemmeden
basin. The Iullemmeden basin (Figure 1.2) lies entirely with the Pan African province of West Africa; which
encompasses parts of Algeria, Mali, and republics of Benin and Niger. The Basin is bounded to the north by the
massifs of the Adrar des Iforas, Hoggar and Air regions. To the west, it is connected to the Taoudeni Basin by
the Gao trough. To the east the Iullemmeden Basin is contiguous with the Chad Basin, through the Damergou
area. In the south, the basement rocks of northern Nigeria delimit the Iullemmeden basin. The center of the
Iullemmeden basin is located north of Niamey in the republic of Niger.

38
Delineation Of Magnetic Zones Of Sokoto Basin…
1.2
Aim and objectives of the study
The aim of the present study is to apply upward continuation techniques on the residual magnetic intensity map
of Sokoto sedimentary basin with a view of delineating magnetic zones
The objectives of the study include the following:
 To delineate magnetic zones in sokoto basin using upward continuation techniques.
 To determine the economic potentials of the basin in terms of hydrocarbon prospects.
 The study would generate and upgrade the existing geophysical database of the study area.

II.

MATERIALS AND METHODS

The study area is covered by twenty nine aeromagnetic maps of total field intensity in half –degree
sheets. These maps are obtained from the Nigerian Geological Survey Agency (NGSA), now renamed the
Nigerian Geological Survey Agency (NGSA)).The Agency carried out an airborne magnetic survey of
substantial part of Nigeria between 1974 and 1980. The magnetic information consists of flight lines plotted on
a continuous strip chart or tape records. The data were collected at a nominal flight altitude of 152.4m along N-S
flight lines spaced approximately 2 km apart. The magnetic data collected were published in the form ½ degree
aeromagnetic maps on a scale of 1:100,000. The magnetic values were plotted at 10nT (nano Tesla) interval.
The maps are numbered, and names of places and coordinates (longitude and latitudes) written for easy
reference and identification. The actual magnetic values were reduced by 25,000gamma before plotting the
contour map. This implies that the value 25,000 gamma is to be added to the contour values so as to obtain the
actual magnetic field at a given point. A correction based on the International Geomagnetic Reference Field,
(IGRF,) and epoch date January 1, 1974 was included in all the maps.
The visual interpolation method,that is the method of digitizing on Grid Layout was used to obtain the
data
from field intensity aeromagnetic maps covering the study area. The data from each digitized map is
recorded in a 19 by 19 coding sheet which contains the longitude, latitude and the name of the town flown and
the sheet number. The unified composite dataset for the study area was produced after removing the edge effect.
Surfer 8 Geosoftware was used to import the data set. The dataset consists of three columns (longitude,latitude
and magnetic values). The composite map was produced using Oasis Montaj..
2.1 Production of Regional and Residual Maps
The residual magnetic field of the study area was produced by subtracting the regional field from the
total magnetic field using the Polynomial fitting method. The computer program Aerosupermap was used to
generate the coordinates of the total intensity field data values. This super data file, for all the magnetic values
was used for production of composite aeromagnetic map of the study area using Oasis Montaj software version
7.2 A program was used to derive the residual magnetic values by subtracting values of regional field from the
total magnetic field values to produce the residual magnetic map and the regional map.
2.2Upward Continuation
Upward continuation is used in order to simplify the appearance of regional magnetic maps by
suppressing the effects due to local features. The proliferation of local magnetic anomalies often obscures the
regional features with an overabundance of detail. Upward continuation thus smoothed out these disturbances
without impairing the main regional features.The main purpose of upward continuation is to view the magnetic
field intensity at a height above flight level so as to eliminate short wavelength anomalies by emphasizing
longer ones reflecting regional features. The total magnetic field of the earth obeys coulomb’s inverse square
law
(TMI a 1/r2)

2.1

it falls off rapidly with height i r.
A potential field measured on a given observation plane at a constant height can be calculated as though the
observations were made on different plane, either higher (upward continuation) or lower (downward
continuation).
The equation of the wave number domain filter to produce upward continuation is simply:
F = e- hw
Where (h) is the continuation height.

2.2

39
Delineation Of Magnetic Zones Of Sokoto Basin…
This function decays steadily with increasing wave number, attenuating the height wavenumbers more severely,
thus producing a map in which more regional features predominate.
Similarly the equation of the wave number domain filter to produce downward continuation is:
F = ehw
2.3
This is a curve, which is zero at wave number and increases exponentially at higher wavenumber,
thus emphasizing the effect of shallow sources and noise. Noise removal is therefore an essential first step
before downward continuation is applied,and continuation depths should not exceed real source depths.
Some careful experimentation is usually necessary to obtain acceptable result (Reeves, 2005).

III.

RESULTS AND ANALYSIS

The total magnetic intensity map ﴾TMI﴿ of the Sokoto sedimentary basin produced from this study using Oasis
Montaj is as shown in Figure 3.1.

Figure 3.1 The total magnetic intensity map ﴾TMI﴿
The TMI map of Sokoto sedimentary basin can be divided into main three sections, though minor
depressions exist scattered all over area. The northern part of the Sokoto basin is characterized by low magnetic
intensity values represented by dark-green-blue color. Whereas the southern part is dominated by high magnetic
intensity values indicated by red color. The two sections are separated by a zone characterized by medium
magnetic intensity values area depicted by yellow-orange color. These high magnetic intensity values, which
dominate the southern part of the Sedimentary basin are caused probably by near surface igneous rocks of
high values of magnetic susceptibilities. The low amplitudes are most likely due to sedimentary rocks and other
non-magnetic sources. In general, high magnetic values arise from igneous and crystalline basement rocks.
Whereas low magnetic values are usually from sedimentary rocks or altered basement rocks. The sedimentary
thickness of the Sokoto basin in general, appears to increases from south to north. This collaborates well with
earlier findings of 2D Seismic surveys conducted by ELF and Mobil Companies carried out in 1979.Inspection
of the total magnetic intensity map (TMI) of the study area( Figure 3.1)does not show any general or particular
trend. However, northeast- southwest trend is observed in the north central part of the total magnetic intensity
map of the study area. Ananaba and Ajakaiye﴾1989﴿based on lineament of LANDSAT images, identified
predominate tectonic trends in the NE –SW, NW-SE directions over the entire basin and in particular over parts
of the country rejuvenated during tectonic phase of the pan Africa Oregency.Umego, ﴾1990﴿, in a study of
aeromagnetic field over the Sokoto basin, identified the existence of NE-SW trending anomalies as the
predominant magnetic features in the area. He observed that the sediments in the basin were not subjected to a

40
Delineation Of Magnetic Zones Of Sokoto Basin…
remarkable degree of faulting as only NW-SE trending faults have been observed in the vicinity of Dange( sheet
No.29) and Gilbedi villages within the study.
3.1 Regional Magnetic Intensity Map
The regional magnetic intensity map of the study area (Figure 3.2) produced using Oasis Montaj.

Figure 3.2 The regional magnetic intensity map of the study area.
The regional magnetic values ranges from 7830nano tesla to 7870nano tesla and the values decreases
from south to north indicating there is a fill of sediments more in the northern part of the basin than in the
southern part of the study areaThe trend of the regional map of the study areas is in the east-west direction. The
regional trend is attributed to effects of deeper heterogeneity of the earth crust.
The regional map (Figure 3.2) agrees well with the total magnetic intensity map obtained from the study.
3.2 Residual Magnetic Intensity Map
Figure 3.3 is the residual magnetic intensity maps of the study area obtained from the total magnetic intensity
map produced using Surfer 8, while Figure 3.4 the residual magnetic intensity maps of the study area obtained
from the total magnetic intensity map produced using a Oasis Montaj.

41
Delineation Of Magnetic Zones Of Sokoto Basin…

13

120
100

12.5

latitude

80
60
40

12

20
0
-20
11.5
-40
-60
-80
11

-100
-120
-140

10.5
3.5

-160
4

4.5

5

5.5

6

6.5

Figure 3.3 the residual magnetic intensity maps of the study area(Surfer8)
longitude

Figure 4.6: The residual magnetic map of the study area

Figure 3.4 the residual magnetic intensity maps of the study area(Oasis Montaj)

42
Delineation Of Magnetic Zones Of Sokoto Basin…
The magnetic intensity values ranges from -10 nano tesla to 40 nano tesla. Negative magnetic intensity values
are more predominant in the northern section of the study area while the southwest has more of positive
magnetic intensity values. Northeast –Southwest trends are observed in the north central part of the TMI map.
3.3 TMI Upward continued at 2km
The total magnetic intensity map of the study area was upward continued at 2 km to produce Figure
3.6 At the height of 2 km, the shorter wavelength anomalies are visible, though slightly refined than the total
magnetic intensity map. Four sections can be observed.At the bottom side of the map (latitude 11 o 00″N to 12o
00″N and longitude 3o 30″E to 5o 00″E), is predominantly pink color with few traces of green and blue colors. A
light pink color is observed in the middle of this portion. Within the range of longitude 3o 30″E to 5o 00″E and
latitude 12o 00″N to 13 o 00″N is a section characterized by yellow color with few traces of green and blue
pigments.The third section is the area defined by latitude 12 o00″N to 13 o30″N and longitude 3o 30″E to 6o
00″E. Green color dominates this portion of the map.At the extreme northern part of the map, approximately the
ranges of longitude 4 o 30″E to 6 o 30″E and latitude 12 o.00″N to 13 o30″N, blue and dark- blue colors are
prevalent in this area. This is the section of the study area having the highest sedimentary thickness.

Figure 3.6

Figure 3.7

Figure 3.9

Figure 3.8

Figure 3.10

Figure 3.11

TMI Upward continued at 3km
The map of upward continuation to 3 km is shown in Figure 4.7 This figure shows that there is a net
difference between the TMI maps at this flight level. Here, the short wavelength anomalies have begun
disappearing thereby consolidating longer wavelength, anomaly units are getting enhanced. Concrete links
between same anomaly types are clearly visible and distinct. We can see that yellow to velvet color shaded
anomalies are on the other hand maturing by enhancing blue color shaded anomalies. The map can be divided
into four sections. At the bottom side of the map (latitude 11 o 00″N to 12o 00″N and longitude 3o 30″E to 5o
00″E), is predominantly pink color with few traces of green and blue colors. A light pink color is observed in
the middle of this portion.Within the range of longitude 3 o 30″E to 5o 00″E and latitude 12o 00″N to 13 o 00″N is

43
Delineation Of Magnetic Zones Of Sokoto Basin…
a section characterized by yellow color with few traces of green and blue pigments.Green color dominates the
portion of the map defined by latitude 12 o00″N to 13 o30″N and longitude 3o 30″E to 6o 00″E.
At approximately the ranges of longitude 4 o 30″E to 6 o 30″E and latitude 12 o.00″N to 13 o30″N,(at the extreme
northern part of the map) blue and dark- blue colors are prevalent in this area which indicates areas of highest
sedimentary thicknesses
TMI Upward continued at 5km
The upward continuation of the total magnetic field map at 5 km is shown in Figure 4.8 The map
shows that basement features are standing out at the detriment of shallow sedimentary features. Basement
structures and the lineaments in the study area are here well defined because erratic signals are filtered. Fault
boundaries between basement and sedimentary areas can be clearly seen. At the bottom side of the map (latitude
11o 00″N to 12o 00″N and longitude 3o 30″E to 5o 00″E), is predominantly pink color with few traces of green
and blue colors. A light pink color is observed in the middle of this portion. Within the range of longitude 3o
30″E to 5o 00″E and latitude 12o 00″N to 13 o 00″N is a section characterized by yellow color with few traces of
green and blue pigments. The third section is the area defined by latitude 12 o00″N to 13 o30″N and longitude
3o 30″E to 6o 00″E. Green color dominates this portion of the map. Areas around bounded by longitude 4 o 30″E
to 6 o 30″E and latitude 12 o.00″N to 13 o30″N, blue and dark- blue colors are prevalent in this area. This is the
section having the highest sedimentary thickness in the study area.
TMI Upward continued at 7km
The map of the upward continuation 7 km height above flight level is shown in Figure 4.9 At this
height, basement structures occupy much more portion of the study area. Low magnetic areas are found to be
northern part. At 7 km depth, the erratic signals are very minimal , hence basement structures and lineaments in
the study area are here well defined at this depth. Around the areas bounded by latitude 11o 00″N to 12o 00″N
and longitude 3o 30″E to 5o 00″E, is predominantly pink color with few traces of green and blue colors. A light
pink color is noticeable in the middle of this portion. Within the range of longitude 3o 30″E to 5o 00″E and
latitude 12o 00″N to 13 o 00″N is a section characterized by yellow color with few traces of green and blue
pigments. The third section is the area defined by latitude 12 o00″N to 13 o30″N and longitude 3o 30″E to 6o
00″E. Green color dominates this portion of the map. At the extreme northern part of the map, approximately
the ranges of longitude 4 o 30″E to 6 o 30″E and latitude 12 o.00″N to 13 o30″N, blue and dark- blue colors are
common in the area . This particular section of the study area shows the highest sediments.
TMI Upward continued at 10 km
The map of the upward continuation at 10 km height above flight level is sho 4.10. At this height,
basement structures appeared quite distinct from the sedimentary areas. Areas of lowest magnetic values, (i.e
areas of thicker deposits of sediments) found to be at northeast part of the study area. The forth section of this
map, particularly the area defined by longitude 5 o30″E to 6o 30″E and latitude12o 00″N to13o 00″N is large a
portion of dark blue color ; clearly an indication of the area having the highest sedimentary thickness in the
study area.At the bottom side of the map (latitude 11 o 00″N to 12o 00″N and longitude 3o 30″E to 5o 00″E), is
predominantly pink color with few traces of green and blue colors. A light pink color is observed in the middle
of this portion.The area bounded by longitude 3 o 30″E to 5o 00″E and latitude 12o 00″N to 13 o 00″N is a section
characterized by yellow color with few traces of green and blue pigments. The third section is the area defined
by latitude 12 o00″N to 13 o30″N and longitude 3o 30″E to 6o 00″E. Green color dominates this portion of the
map.At the extreme northern part of the map, approximately the ranges of longitude 4 o 30″E to 6 o 30″E and
latitude 12 o.00″N to 13 o30″N, blue and dark- blue colors are prevalent in this area. This is the section having
the highest sedimentary thickness in the study area.
TMI Upward continued at 15km
The map of the upward continuation at 15 km height above flight level is shown in Figure 4.11. At this
height, basement structures appeared quite distinct from the sedimentary areas. Areas of lowest magnetic
values, (i.e areas of thicker deposits of sediments) found to be at northeast part of the study area. The forth
section of this map, particularly the area defined by longitude 5 o30″E to 6o 30″E and latitude12o 00″N to13o
00″N is large portion of dark blue color ; clearly and indication of the area having the highest sedimentary
thickness in the study area. This area is found to be in sheets numbers 11 (Rabah) and 12 (Isah) of the index
map of Nigeria .comparison and close observation of the maps of downward continuation at depths of 2 km, 3
km, 5 km, 7 km and 10 km clearly show progressive disappearance of disturbances (noises) due to the shallow
effect of the magnetic anomalies, thereby enhancing the regional effects distinctively. The northern part of the
study area is generally characterized with low magnetic values, an indication of either thicker sediments in the

44
Delineation Of Magnetic Zones Of Sokoto Basin…
region, or deep seated anomalies. Figures 3.10 and 3.11clearly show the regional effects and the maps trend
wise resembles the total magnetic intensity map as well as the regional map of the study area.

IV.

CONCLUSION AND RECOMMENDATIONS

The analysis of the total magnetic intensity map (TMI), the regional map, the residual map, the the
upward continuation maps at 2km, 3km, 5km, 7km, 10km and 15km of Sokoto basin, all indicate that the basin
is shallower in the south and thicker in the north which borders with Niger Republic Upward continuation
results delineated Rabah , Isah, Gandi and Mafara areas having highest sedimentation in the study area. The
result collaborates with those obtained by other researchers that conducted studies in some sections of the basin;
notably are results of studies by Umego (1990), Adetonaet al.,( 2007),Uwah. (1984) and Udensi (2013).
Exploration of the Nigerian inland basins is worth given a push. Hydrocarbons if discovered and harnessed
findings will increase the country’s reserve and boost productivity. All these will have economic and strategic
benefits for the country. There is therefore the need to take advantage of modern geophysical methods in the
exploration of Nigerian inland basins.

REFERENCES
[1]
[2]
[3]
[4]
[5]
[6]
[7]
[8]
[9]
[10]
[11]
[12]
[13]
[14]

Adetona, A.A.,Udensi, E.E and Agelaga, A.G. (2007), Determination of depth to buried magnetic rocks under the lower Sokoto
basin using aeromagnetic data. Nigerian Journal of physics Vol.19 (2), Pp 275-283.
.Ananaba, S.E. and Ajakaiye, D.E. (1989), Evidence of tectonic control of mineralization in Nigeria from Lineament density
analysis: A landsat – study int. Journal of remote sensing.Vol(8) Pp. 144-1453.
Ayuba,B.H. (1999), A three dimensional interpretation of aeromagnetic Anomaly near Dange village, Sokoto State Nigeria.
Unpublish MSc Thesis. Physics Department Ahmadu Bello University Zaria, Nigeria
Corell, L. and Grouch, V.J.S. (1985), Mapping basement zones from magnetic data in the san juan basin; New Mexico: presented
at the 52nd Annual International Meeting, Society or exploration, geophysicists, Dallas U.S.A.
Dobrin, M.B. (1976), Introduction to Geophysical Prospecting. Mc-Graw Hill Books Co (3rd Ed.) N.Y. Pp. 630
Kearey, P, Brooks, M. and Hill, I. (2004), An Introduction to Geophysical Exploration. Third• Edition, Blackwell Pub.
Nigerian Geology Survey Agency,(1976), Geology Map of Nigeria. Scale1:2,00 000. Geology Survey of Nigeria, Kaduna, Nigeria
Oasis Montaj Version 7.2 softwareinc.
Reeves, C. ( 2005);Aeromagnetic Surveys; Principles, Practice and Interpretation, Training Programme, NGSA, Nigeria.
Reynolds, J.M. (1990): An introduction to applied and environmental Geophysics, John Willey and sons Limited Pp 116 – 207.
Surfer (R) version 8.01 2002 Golden software inc.
Udensi,E.E.,(2013),Subduing the Earth with Exploration Geophysics; My contribution, Inaugural Lecture series No.24 of Federal
University of Technology, Minna.,Nigeria.
Umego,M. (1990),Structural interpretation of gravity and Aeromagnetic Anomalies over Sokoto Basin, north’ Western Nigeria.
Unpublished PhD Thesis, Department of Physics, Ahmadu Bello University, Zaria, Nigeria.
Uwah, EJ.(1984), Investigation of radiometric anomalies by nuclear and other methods; A case study of Sokoto Basin of Nigeria.
Unpublished Ph.D Thesis.Ahmadu Bello University Zaria. Nigeria

45

More Related Content

What's hot

Integrated Geophysical Approach for Rapid & Cost Effective Site Investigation...
Integrated Geophysical Approach for Rapid & Cost Effective Site Investigation...Integrated Geophysical Approach for Rapid & Cost Effective Site Investigation...
Integrated Geophysical Approach for Rapid & Cost Effective Site Investigation...
IEI GSC
 
Mineral mapping and applications of imaging spectroscopy
Mineral mapping and applications of imaging spectroscopyMineral mapping and applications of imaging spectroscopy
Mineral mapping and applications of imaging spectroscopyRemote Sensing GEOIMAGE
 
Integration of data for mineral explorataion
Integration of data for mineral explorataionIntegration of data for mineral explorataion
Integration of data for mineral explorataion
krishanunath1
 
Archaeological and groundwater investigations
Archaeological and groundwater investigationsArchaeological and groundwater investigations
Archaeological and groundwater investigations
Zaidoon Taha
 
29
2929
Role of Geophysics in the Oil and Gas Industry
Role of Geophysics in the Oil and Gas IndustryRole of Geophysics in the Oil and Gas Industry
Role of Geophysics in the Oil and Gas Industry
Musisi Norbert
 
WETLAND MAPPING USING RS AND GIS
WETLAND MAPPING USING RS AND GISWETLAND MAPPING USING RS AND GIS
WETLAND MAPPING USING RS AND GISAbhiram Kanigolla
 
Applications of remote sensing in geological aspects
Applications of remote sensing in geological aspectsApplications of remote sensing in geological aspects
Applications of remote sensing in geological aspects
Pramoda Raj
 
The use of geoinformatics in mineral exploration and exploitation
The use of geoinformatics in mineral exploration and exploitationThe use of geoinformatics in mineral exploration and exploitation
The use of geoinformatics in mineral exploration and exploitation
Marguerite Walsh
 
ASSESSMENT OF SOIL SALINITY USING REMOTE SENSING
ASSESSMENT OF SOIL SALINITY USING REMOTE SENSINGASSESSMENT OF SOIL SALINITY USING REMOTE SENSING
ASSESSMENT OF SOIL SALINITY USING REMOTE SENSING
Abhiram Kanigolla
 
Study on the LandCover Classification using UAV Imagery
Study on the LandCover Classification using UAV ImageryStudy on the LandCover Classification using UAV Imagery
Study on the LandCover Classification using UAV Imagery
International Journal of Modern Research in Engineering and Technology
 
Remote Sensing And GIS Application In Mineral , Oil , Ground Water MappingMin...
Remote Sensing And GIS Application In Mineral , Oil , Ground Water MappingMin...Remote Sensing And GIS Application In Mineral , Oil , Ground Water MappingMin...
Remote Sensing And GIS Application In Mineral , Oil , Ground Water MappingMin...Swetha A
 
Spectral Depth Analysis of Parts of Upper Benue Trough and Borno Basin, North...
Spectral Depth Analysis of Parts of Upper Benue Trough and Borno Basin, North...Spectral Depth Analysis of Parts of Upper Benue Trough and Borno Basin, North...
Spectral Depth Analysis of Parts of Upper Benue Trough and Borno Basin, North...
International Journal of Science and Research (IJSR)
 
A2100107
A2100107A2100107
A2100107
ajmrdjournals
 
ÖNCEL AKADEMİ: İSTANBUL DEPREMİ
ÖNCEL AKADEMİ: İSTANBUL DEPREMİÖNCEL AKADEMİ: İSTANBUL DEPREMİ
ÖNCEL AKADEMİ: İSTANBUL DEPREMİ
Ali Osman Öncel
 
Gissa 2013-6 10-Iuma Martinez
Gissa  2013-6 10-Iuma MartinezGissa  2013-6 10-Iuma Martinez
Gissa 2013-6 10-Iuma Martinez
IUMA MARTINEZ
 
Collection and Interpretation of Remote Sensing Data, Kasper Johansen, Univer...
Collection and Interpretation of Remote Sensing Data, Kasper Johansen, Univer...Collection and Interpretation of Remote Sensing Data, Kasper Johansen, Univer...
Collection and Interpretation of Remote Sensing Data, Kasper Johansen, Univer...becnicholas
 
Seagrass mapping and monitoring along the coast of Crete, Greece. Mid-Term Pr...
Seagrass mapping and monitoring along the coast of Crete, Greece. Mid-Term Pr...Seagrass mapping and monitoring along the coast of Crete, Greece. Mid-Term Pr...
Seagrass mapping and monitoring along the coast of Crete, Greece. Mid-Term Pr...
Universität Salzburg
 
An Automated Approach of Shoreline Detection Applied to Digital Videos using ...
An Automated Approach of Shoreline Detection Applied to Digital Videos using ...An Automated Approach of Shoreline Detection Applied to Digital Videos using ...
An Automated Approach of Shoreline Detection Applied to Digital Videos using ...
Dwi Putra Asana
 
Remote sensing presentation
Remote sensing presentationRemote sensing presentation
Remote sensing presentation
Sukirtee Chejara
 

What's hot (20)

Integrated Geophysical Approach for Rapid & Cost Effective Site Investigation...
Integrated Geophysical Approach for Rapid & Cost Effective Site Investigation...Integrated Geophysical Approach for Rapid & Cost Effective Site Investigation...
Integrated Geophysical Approach for Rapid & Cost Effective Site Investigation...
 
Mineral mapping and applications of imaging spectroscopy
Mineral mapping and applications of imaging spectroscopyMineral mapping and applications of imaging spectroscopy
Mineral mapping and applications of imaging spectroscopy
 
Integration of data for mineral explorataion
Integration of data for mineral explorataionIntegration of data for mineral explorataion
Integration of data for mineral explorataion
 
Archaeological and groundwater investigations
Archaeological and groundwater investigationsArchaeological and groundwater investigations
Archaeological and groundwater investigations
 
29
2929
29
 
Role of Geophysics in the Oil and Gas Industry
Role of Geophysics in the Oil and Gas IndustryRole of Geophysics in the Oil and Gas Industry
Role of Geophysics in the Oil and Gas Industry
 
WETLAND MAPPING USING RS AND GIS
WETLAND MAPPING USING RS AND GISWETLAND MAPPING USING RS AND GIS
WETLAND MAPPING USING RS AND GIS
 
Applications of remote sensing in geological aspects
Applications of remote sensing in geological aspectsApplications of remote sensing in geological aspects
Applications of remote sensing in geological aspects
 
The use of geoinformatics in mineral exploration and exploitation
The use of geoinformatics in mineral exploration and exploitationThe use of geoinformatics in mineral exploration and exploitation
The use of geoinformatics in mineral exploration and exploitation
 
ASSESSMENT OF SOIL SALINITY USING REMOTE SENSING
ASSESSMENT OF SOIL SALINITY USING REMOTE SENSINGASSESSMENT OF SOIL SALINITY USING REMOTE SENSING
ASSESSMENT OF SOIL SALINITY USING REMOTE SENSING
 
Study on the LandCover Classification using UAV Imagery
Study on the LandCover Classification using UAV ImageryStudy on the LandCover Classification using UAV Imagery
Study on the LandCover Classification using UAV Imagery
 
Remote Sensing And GIS Application In Mineral , Oil , Ground Water MappingMin...
Remote Sensing And GIS Application In Mineral , Oil , Ground Water MappingMin...Remote Sensing And GIS Application In Mineral , Oil , Ground Water MappingMin...
Remote Sensing And GIS Application In Mineral , Oil , Ground Water MappingMin...
 
Spectral Depth Analysis of Parts of Upper Benue Trough and Borno Basin, North...
Spectral Depth Analysis of Parts of Upper Benue Trough and Borno Basin, North...Spectral Depth Analysis of Parts of Upper Benue Trough and Borno Basin, North...
Spectral Depth Analysis of Parts of Upper Benue Trough and Borno Basin, North...
 
A2100107
A2100107A2100107
A2100107
 
ÖNCEL AKADEMİ: İSTANBUL DEPREMİ
ÖNCEL AKADEMİ: İSTANBUL DEPREMİÖNCEL AKADEMİ: İSTANBUL DEPREMİ
ÖNCEL AKADEMİ: İSTANBUL DEPREMİ
 
Gissa 2013-6 10-Iuma Martinez
Gissa  2013-6 10-Iuma MartinezGissa  2013-6 10-Iuma Martinez
Gissa 2013-6 10-Iuma Martinez
 
Collection and Interpretation of Remote Sensing Data, Kasper Johansen, Univer...
Collection and Interpretation of Remote Sensing Data, Kasper Johansen, Univer...Collection and Interpretation of Remote Sensing Data, Kasper Johansen, Univer...
Collection and Interpretation of Remote Sensing Data, Kasper Johansen, Univer...
 
Seagrass mapping and monitoring along the coast of Crete, Greece. Mid-Term Pr...
Seagrass mapping and monitoring along the coast of Crete, Greece. Mid-Term Pr...Seagrass mapping and monitoring along the coast of Crete, Greece. Mid-Term Pr...
Seagrass mapping and monitoring along the coast of Crete, Greece. Mid-Term Pr...
 
An Automated Approach of Shoreline Detection Applied to Digital Videos using ...
An Automated Approach of Shoreline Detection Applied to Digital Videos using ...An Automated Approach of Shoreline Detection Applied to Digital Videos using ...
An Automated Approach of Shoreline Detection Applied to Digital Videos using ...
 
Remote sensing presentation
Remote sensing presentationRemote sensing presentation
Remote sensing presentation
 

Viewers also liked

Gbs connectsfinal
Gbs connectsfinalGbs connectsfinal
Gbs connectsfinal
SunBeam Marketing Solutions
 
Jobsket Spring 2GX Madrid
Jobsket Spring 2GX MadridJobsket Spring 2GX Madrid
Jobsket Spring 2GX Madrid
Jobsket
 
Identify Group Presentation
Identify Group PresentationIdentify Group Presentation
Identify Group Presentation
twood28
 
Taller de Grails
Taller de GrailsTaller de Grails
Taller de Grails
Jobsket
 
Desarrollo con Java y metodologías agiles
Desarrollo con Java y metodologías agilesDesarrollo con Java y metodologías agiles
Desarrollo con Java y metodologías agiles
Jobsket
 
Frameworks de Desarrollo Web Grails
Frameworks de Desarrollo Web GrailsFrameworks de Desarrollo Web Grails
Frameworks de Desarrollo Web Grails
Esteban Saavedra
 
Introducción a ala Computación Vestible y a la Computación Ubicua
Introducción a ala Computación Vestible y a la Computación UbicuaIntroducción a ala Computación Vestible y a la Computación Ubicua
Introducción a ala Computación Vestible y a la Computación Ubicua
Esteban Saavedra
 

Viewers also liked (7)

Gbs connectsfinal
Gbs connectsfinalGbs connectsfinal
Gbs connectsfinal
 
Jobsket Spring 2GX Madrid
Jobsket Spring 2GX MadridJobsket Spring 2GX Madrid
Jobsket Spring 2GX Madrid
 
Identify Group Presentation
Identify Group PresentationIdentify Group Presentation
Identify Group Presentation
 
Taller de Grails
Taller de GrailsTaller de Grails
Taller de Grails
 
Desarrollo con Java y metodologías agiles
Desarrollo con Java y metodologías agilesDesarrollo con Java y metodologías agiles
Desarrollo con Java y metodologías agiles
 
Frameworks de Desarrollo Web Grails
Frameworks de Desarrollo Web GrailsFrameworks de Desarrollo Web Grails
Frameworks de Desarrollo Web Grails
 
Introducción a ala Computación Vestible y a la Computación Ubicua
Introducción a ala Computación Vestible y a la Computación UbicuaIntroducción a ala Computación Vestible y a la Computación Ubicua
Introducción a ala Computación Vestible y a la Computación Ubicua
 

Similar to D41037045

Geophysical studies on Dahab area, South Sinai. Egypt
Geophysical studies on Dahab area, South Sinai. EgyptGeophysical studies on Dahab area, South Sinai. Egypt
Geophysical studies on Dahab area, South Sinai. Egypt
osamaabdelraouf1
 
Depth Estimation and Source Location of Magnetic Anomalies from a Basement Co...
Depth Estimation and Source Location of Magnetic Anomalies from a Basement Co...Depth Estimation and Source Location of Magnetic Anomalies from a Basement Co...
Depth Estimation and Source Location of Magnetic Anomalies from a Basement Co...
IOSR Journals
 
2 d seismic refraction tomography investigation of a sewage treatment site
2 d seismic refraction tomography investigation of a sewage treatment site2 d seismic refraction tomography investigation of a sewage treatment site
2 d seismic refraction tomography investigation of a sewage treatment site
Alexander Decker
 
Structural interpretation of abakiliki – ugep, using
Structural interpretation of abakiliki – ugep, usingStructural interpretation of abakiliki – ugep, using
Structural interpretation of abakiliki – ugep, using
Alexander Decker
 
Application of radiometric surveys to delineate between sedimentary terrain a...
Application of radiometric surveys to delineate between sedimentary terrain a...Application of radiometric surveys to delineate between sedimentary terrain a...
Application of radiometric surveys to delineate between sedimentary terrain a...
Alexander Decker
 
Structural Trends from Airborne Gravity Data of Delta State, Nigeria
Structural Trends from Airborne Gravity Data of Delta State, NigeriaStructural Trends from Airborne Gravity Data of Delta State, Nigeria
Structural Trends from Airborne Gravity Data of Delta State, Nigeria
Associate Professor in VSB Coimbatore
 
C251221
C251221C251221
Integrated ERT and Magnetic Surveys in a Mineralization Zone in Erkowit - Red...
Integrated ERT and Magnetic Surveys in a Mineralization Zone in Erkowit - Red...Integrated ERT and Magnetic Surveys in a Mineralization Zone in Erkowit - Red...
Integrated ERT and Magnetic Surveys in a Mineralization Zone in Erkowit - Red...
IJERA Editor
 
Interpretation of Structural Terrace of Sheets: 303, 304 and 305 using Geophy...
Interpretation of Structural Terrace of Sheets: 303, 304 and 305 using Geophy...Interpretation of Structural Terrace of Sheets: 303, 304 and 305 using Geophy...
Interpretation of Structural Terrace of Sheets: 303, 304 and 305 using Geophy...
IIJSRJournal
 
Field lab
Field labField lab
Field lab
BisankaKing
 
Chiguata_magnetic_prospection.pdf
Chiguata_magnetic_prospection.pdfChiguata_magnetic_prospection.pdf
Chiguata_magnetic_prospection.pdf
manuelabarca9
 
International Refereed Journal of Engineering and Science (IRJES)
International Refereed Journal of Engineering and Science (IRJES)International Refereed Journal of Engineering and Science (IRJES)
International Refereed Journal of Engineering and Science (IRJES)
irjes
 
230958-Article Text-560527-1-10-20220831.pdf
230958-Article Text-560527-1-10-20220831.pdf230958-Article Text-560527-1-10-20220831.pdf
230958-Article Text-560527-1-10-20220831.pdf
DUSABEMARIYA
 
Similarities between gravity and magnetics and application of different geoph...
Similarities between gravity and magnetics and application of different geoph...Similarities between gravity and magnetics and application of different geoph...
Similarities between gravity and magnetics and application of different geoph...
Jyoti Khatiwada
 
Geophysical methods
Geophysical methodsGeophysical methods
Geophysical methods
Ngatcha Bryan
 
Lithological Investigation at Tombia and Opolo Using Vertical Electrical Soun...
Lithological Investigation at Tombia and Opolo Using Vertical Electrical Soun...Lithological Investigation at Tombia and Opolo Using Vertical Electrical Soun...
Lithological Investigation at Tombia and Opolo Using Vertical Electrical Soun...
IJLT EMAS
 
Jurnal geomagnet mitchell johnson
Jurnal geomagnet mitchell johnsonJurnal geomagnet mitchell johnson
Jurnal geomagnet mitchell johnsonAswar Syafnur
 
IODP uses Syqwest's Bathy 2010 3.5 khz chirp profiler to conduct geo physical...
IODP uses Syqwest's Bathy 2010 3.5 khz chirp profiler to conduct geo physical...IODP uses Syqwest's Bathy 2010 3.5 khz chirp profiler to conduct geo physical...
IODP uses Syqwest's Bathy 2010 3.5 khz chirp profiler to conduct geo physical...
Drive Customers
 

Similar to D41037045 (20)

Geophysical studies on Dahab area, South Sinai. Egypt
Geophysical studies on Dahab area, South Sinai. EgyptGeophysical studies on Dahab area, South Sinai. Egypt
Geophysical studies on Dahab area, South Sinai. Egypt
 
Depth Estimation and Source Location of Magnetic Anomalies from a Basement Co...
Depth Estimation and Source Location of Magnetic Anomalies from a Basement Co...Depth Estimation and Source Location of Magnetic Anomalies from a Basement Co...
Depth Estimation and Source Location of Magnetic Anomalies from a Basement Co...
 
2 d seismic refraction tomography investigation of a sewage treatment site
2 d seismic refraction tomography investigation of a sewage treatment site2 d seismic refraction tomography investigation of a sewage treatment site
2 d seismic refraction tomography investigation of a sewage treatment site
 
Structural interpretation of abakiliki – ugep, using
Structural interpretation of abakiliki – ugep, usingStructural interpretation of abakiliki – ugep, using
Structural interpretation of abakiliki – ugep, using
 
Application of radiometric surveys to delineate between sedimentary terrain a...
Application of radiometric surveys to delineate between sedimentary terrain a...Application of radiometric surveys to delineate between sedimentary terrain a...
Application of radiometric surveys to delineate between sedimentary terrain a...
 
Structural Trends from Airborne Gravity Data of Delta State, Nigeria
Structural Trends from Airborne Gravity Data of Delta State, NigeriaStructural Trends from Airborne Gravity Data of Delta State, Nigeria
Structural Trends from Airborne Gravity Data of Delta State, Nigeria
 
C251221
C251221C251221
C251221
 
Integrated ERT and Magnetic Surveys in a Mineralization Zone in Erkowit - Red...
Integrated ERT and Magnetic Surveys in a Mineralization Zone in Erkowit - Red...Integrated ERT and Magnetic Surveys in a Mineralization Zone in Erkowit - Red...
Integrated ERT and Magnetic Surveys in a Mineralization Zone in Erkowit - Red...
 
Interpretation of Structural Terrace of Sheets: 303, 304 and 305 using Geophy...
Interpretation of Structural Terrace of Sheets: 303, 304 and 305 using Geophy...Interpretation of Structural Terrace of Sheets: 303, 304 and 305 using Geophy...
Interpretation of Structural Terrace of Sheets: 303, 304 and 305 using Geophy...
 
Gi2511541161
Gi2511541161Gi2511541161
Gi2511541161
 
Gi2511541161
Gi2511541161Gi2511541161
Gi2511541161
 
Field lab
Field labField lab
Field lab
 
Chiguata_magnetic_prospection.pdf
Chiguata_magnetic_prospection.pdfChiguata_magnetic_prospection.pdf
Chiguata_magnetic_prospection.pdf
 
International Refereed Journal of Engineering and Science (IRJES)
International Refereed Journal of Engineering and Science (IRJES)International Refereed Journal of Engineering and Science (IRJES)
International Refereed Journal of Engineering and Science (IRJES)
 
230958-Article Text-560527-1-10-20220831.pdf
230958-Article Text-560527-1-10-20220831.pdf230958-Article Text-560527-1-10-20220831.pdf
230958-Article Text-560527-1-10-20220831.pdf
 
Similarities between gravity and magnetics and application of different geoph...
Similarities between gravity and magnetics and application of different geoph...Similarities between gravity and magnetics and application of different geoph...
Similarities between gravity and magnetics and application of different geoph...
 
Geophysical methods
Geophysical methodsGeophysical methods
Geophysical methods
 
Lithological Investigation at Tombia and Opolo Using Vertical Electrical Soun...
Lithological Investigation at Tombia and Opolo Using Vertical Electrical Soun...Lithological Investigation at Tombia and Opolo Using Vertical Electrical Soun...
Lithological Investigation at Tombia and Opolo Using Vertical Electrical Soun...
 
Jurnal geomagnet mitchell johnson
Jurnal geomagnet mitchell johnsonJurnal geomagnet mitchell johnson
Jurnal geomagnet mitchell johnson
 
IODP uses Syqwest's Bathy 2010 3.5 khz chirp profiler to conduct geo physical...
IODP uses Syqwest's Bathy 2010 3.5 khz chirp profiler to conduct geo physical...IODP uses Syqwest's Bathy 2010 3.5 khz chirp profiler to conduct geo physical...
IODP uses Syqwest's Bathy 2010 3.5 khz chirp profiler to conduct geo physical...
 

More from inventy

Experimental Investigation of a Household Refrigerator Using Evaporative-Cool...
Experimental Investigation of a Household Refrigerator Using Evaporative-Cool...Experimental Investigation of a Household Refrigerator Using Evaporative-Cool...
Experimental Investigation of a Household Refrigerator Using Evaporative-Cool...
inventy
 
Copper Strip Corrossion Test in Various Aviation Fuels
Copper Strip Corrossion Test in Various Aviation FuelsCopper Strip Corrossion Test in Various Aviation Fuels
Copper Strip Corrossion Test in Various Aviation Fuels
inventy
 
Additional Conservation Laws for Two-Velocity Hydrodynamics Equations with th...
Additional Conservation Laws for Two-Velocity Hydrodynamics Equations with th...Additional Conservation Laws for Two-Velocity Hydrodynamics Equations with th...
Additional Conservation Laws for Two-Velocity Hydrodynamics Equations with th...
inventy
 
Comparative Study of the Quality of Life, Quality of Work Life and Organisati...
Comparative Study of the Quality of Life, Quality of Work Life and Organisati...Comparative Study of the Quality of Life, Quality of Work Life and Organisati...
Comparative Study of the Quality of Life, Quality of Work Life and Organisati...
inventy
 
A Study of Automated Decision Making Systems
A Study of Automated Decision Making SystemsA Study of Automated Decision Making Systems
A Study of Automated Decision Making Systems
inventy
 
Crystallization of L-Glutamic Acid: Mechanism of Heterogeneous β -Form Nuclea...
Crystallization of L-Glutamic Acid: Mechanism of Heterogeneous β -Form Nuclea...Crystallization of L-Glutamic Acid: Mechanism of Heterogeneous β -Form Nuclea...
Crystallization of L-Glutamic Acid: Mechanism of Heterogeneous β -Form Nuclea...
inventy
 
Evaluation of Damage by the Reliability of the Traction Test on Polymer Test ...
Evaluation of Damage by the Reliability of the Traction Test on Polymer Test ...Evaluation of Damage by the Reliability of the Traction Test on Polymer Test ...
Evaluation of Damage by the Reliability of the Traction Test on Polymer Test ...
inventy
 
Application of Kennelly’model of Running Performances to Elite Endurance Runn...
Application of Kennelly’model of Running Performances to Elite Endurance Runn...Application of Kennelly’model of Running Performances to Elite Endurance Runn...
Application of Kennelly’model of Running Performances to Elite Endurance Runn...
inventy
 
Development and Application of a Failure Monitoring System by Using the Vibra...
Development and Application of a Failure Monitoring System by Using the Vibra...Development and Application of a Failure Monitoring System by Using the Vibra...
Development and Application of a Failure Monitoring System by Using the Vibra...
inventy
 
The Management of Protected Areas in Serengeti Ecosystem: A Case Study of Iko...
The Management of Protected Areas in Serengeti Ecosystem: A Case Study of Iko...The Management of Protected Areas in Serengeti Ecosystem: A Case Study of Iko...
The Management of Protected Areas in Serengeti Ecosystem: A Case Study of Iko...
inventy
 
Size distribution and biometric relationships of little tunny Euthynnus allet...
Size distribution and biometric relationships of little tunny Euthynnus allet...Size distribution and biometric relationships of little tunny Euthynnus allet...
Size distribution and biometric relationships of little tunny Euthynnus allet...
inventy
 
Removal of Chromium (VI) From Aqueous Solutions Using Discarded Solanum Tuber...
Removal of Chromium (VI) From Aqueous Solutions Using Discarded Solanum Tuber...Removal of Chromium (VI) From Aqueous Solutions Using Discarded Solanum Tuber...
Removal of Chromium (VI) From Aqueous Solutions Using Discarded Solanum Tuber...
inventy
 
Effect of Various External and Internal Factors on the Carrier Mobility in n-...
Effect of Various External and Internal Factors on the Carrier Mobility in n-...Effect of Various External and Internal Factors on the Carrier Mobility in n-...
Effect of Various External and Internal Factors on the Carrier Mobility in n-...
inventy
 
Transient flow analysis for horizontal axial upper-wind turbine
Transient flow analysis for horizontal axial upper-wind turbineTransient flow analysis for horizontal axial upper-wind turbine
Transient flow analysis for horizontal axial upper-wind turbine
inventy
 
Choice of Numerical Integration Method for Wind Time History Analysis of Tall...
Choice of Numerical Integration Method for Wind Time History Analysis of Tall...Choice of Numerical Integration Method for Wind Time History Analysis of Tall...
Choice of Numerical Integration Method for Wind Time History Analysis of Tall...
inventy
 
Impacts of Demand Side Management on System Reliability Evaluation
Impacts of Demand Side Management on System Reliability EvaluationImpacts of Demand Side Management on System Reliability Evaluation
Impacts of Demand Side Management on System Reliability Evaluation
inventy
 
Reliability Evaluation of Riyadh System Incorporating Renewable Generation
Reliability Evaluation of Riyadh System Incorporating Renewable GenerationReliability Evaluation of Riyadh System Incorporating Renewable Generation
Reliability Evaluation of Riyadh System Incorporating Renewable Generation
inventy
 
The effect of reduced pressure acetylene plasma treatment on physical charact...
The effect of reduced pressure acetylene plasma treatment on physical charact...The effect of reduced pressure acetylene plasma treatment on physical charact...
The effect of reduced pressure acetylene plasma treatment on physical charact...
inventy
 
Experimental Investigation of Mini Cooler cum Freezer
Experimental Investigation of Mini Cooler cum FreezerExperimental Investigation of Mini Cooler cum Freezer
Experimental Investigation of Mini Cooler cum Freezer
inventy
 
Growth and Magnetic properties of MnGeP2 thin films
Growth and Magnetic properties of MnGeP2 thin filmsGrowth and Magnetic properties of MnGeP2 thin films
Growth and Magnetic properties of MnGeP2 thin films
inventy
 

More from inventy (20)

Experimental Investigation of a Household Refrigerator Using Evaporative-Cool...
Experimental Investigation of a Household Refrigerator Using Evaporative-Cool...Experimental Investigation of a Household Refrigerator Using Evaporative-Cool...
Experimental Investigation of a Household Refrigerator Using Evaporative-Cool...
 
Copper Strip Corrossion Test in Various Aviation Fuels
Copper Strip Corrossion Test in Various Aviation FuelsCopper Strip Corrossion Test in Various Aviation Fuels
Copper Strip Corrossion Test in Various Aviation Fuels
 
Additional Conservation Laws for Two-Velocity Hydrodynamics Equations with th...
Additional Conservation Laws for Two-Velocity Hydrodynamics Equations with th...Additional Conservation Laws for Two-Velocity Hydrodynamics Equations with th...
Additional Conservation Laws for Two-Velocity Hydrodynamics Equations with th...
 
Comparative Study of the Quality of Life, Quality of Work Life and Organisati...
Comparative Study of the Quality of Life, Quality of Work Life and Organisati...Comparative Study of the Quality of Life, Quality of Work Life and Organisati...
Comparative Study of the Quality of Life, Quality of Work Life and Organisati...
 
A Study of Automated Decision Making Systems
A Study of Automated Decision Making SystemsA Study of Automated Decision Making Systems
A Study of Automated Decision Making Systems
 
Crystallization of L-Glutamic Acid: Mechanism of Heterogeneous β -Form Nuclea...
Crystallization of L-Glutamic Acid: Mechanism of Heterogeneous β -Form Nuclea...Crystallization of L-Glutamic Acid: Mechanism of Heterogeneous β -Form Nuclea...
Crystallization of L-Glutamic Acid: Mechanism of Heterogeneous β -Form Nuclea...
 
Evaluation of Damage by the Reliability of the Traction Test on Polymer Test ...
Evaluation of Damage by the Reliability of the Traction Test on Polymer Test ...Evaluation of Damage by the Reliability of the Traction Test on Polymer Test ...
Evaluation of Damage by the Reliability of the Traction Test on Polymer Test ...
 
Application of Kennelly’model of Running Performances to Elite Endurance Runn...
Application of Kennelly’model of Running Performances to Elite Endurance Runn...Application of Kennelly’model of Running Performances to Elite Endurance Runn...
Application of Kennelly’model of Running Performances to Elite Endurance Runn...
 
Development and Application of a Failure Monitoring System by Using the Vibra...
Development and Application of a Failure Monitoring System by Using the Vibra...Development and Application of a Failure Monitoring System by Using the Vibra...
Development and Application of a Failure Monitoring System by Using the Vibra...
 
The Management of Protected Areas in Serengeti Ecosystem: A Case Study of Iko...
The Management of Protected Areas in Serengeti Ecosystem: A Case Study of Iko...The Management of Protected Areas in Serengeti Ecosystem: A Case Study of Iko...
The Management of Protected Areas in Serengeti Ecosystem: A Case Study of Iko...
 
Size distribution and biometric relationships of little tunny Euthynnus allet...
Size distribution and biometric relationships of little tunny Euthynnus allet...Size distribution and biometric relationships of little tunny Euthynnus allet...
Size distribution and biometric relationships of little tunny Euthynnus allet...
 
Removal of Chromium (VI) From Aqueous Solutions Using Discarded Solanum Tuber...
Removal of Chromium (VI) From Aqueous Solutions Using Discarded Solanum Tuber...Removal of Chromium (VI) From Aqueous Solutions Using Discarded Solanum Tuber...
Removal of Chromium (VI) From Aqueous Solutions Using Discarded Solanum Tuber...
 
Effect of Various External and Internal Factors on the Carrier Mobility in n-...
Effect of Various External and Internal Factors on the Carrier Mobility in n-...Effect of Various External and Internal Factors on the Carrier Mobility in n-...
Effect of Various External and Internal Factors on the Carrier Mobility in n-...
 
Transient flow analysis for horizontal axial upper-wind turbine
Transient flow analysis for horizontal axial upper-wind turbineTransient flow analysis for horizontal axial upper-wind turbine
Transient flow analysis for horizontal axial upper-wind turbine
 
Choice of Numerical Integration Method for Wind Time History Analysis of Tall...
Choice of Numerical Integration Method for Wind Time History Analysis of Tall...Choice of Numerical Integration Method for Wind Time History Analysis of Tall...
Choice of Numerical Integration Method for Wind Time History Analysis of Tall...
 
Impacts of Demand Side Management on System Reliability Evaluation
Impacts of Demand Side Management on System Reliability EvaluationImpacts of Demand Side Management on System Reliability Evaluation
Impacts of Demand Side Management on System Reliability Evaluation
 
Reliability Evaluation of Riyadh System Incorporating Renewable Generation
Reliability Evaluation of Riyadh System Incorporating Renewable GenerationReliability Evaluation of Riyadh System Incorporating Renewable Generation
Reliability Evaluation of Riyadh System Incorporating Renewable Generation
 
The effect of reduced pressure acetylene plasma treatment on physical charact...
The effect of reduced pressure acetylene plasma treatment on physical charact...The effect of reduced pressure acetylene plasma treatment on physical charact...
The effect of reduced pressure acetylene plasma treatment on physical charact...
 
Experimental Investigation of Mini Cooler cum Freezer
Experimental Investigation of Mini Cooler cum FreezerExperimental Investigation of Mini Cooler cum Freezer
Experimental Investigation of Mini Cooler cum Freezer
 
Growth and Magnetic properties of MnGeP2 thin films
Growth and Magnetic properties of MnGeP2 thin filmsGrowth and Magnetic properties of MnGeP2 thin films
Growth and Magnetic properties of MnGeP2 thin films
 

Recently uploaded

Introduction to CHERI technology - Cybersecurity
Introduction to CHERI technology - CybersecurityIntroduction to CHERI technology - Cybersecurity
Introduction to CHERI technology - Cybersecurity
mikeeftimakis1
 
How world-class product teams are winning in the AI era by CEO and Founder, P...
How world-class product teams are winning in the AI era by CEO and Founder, P...How world-class product teams are winning in the AI era by CEO and Founder, P...
How world-class product teams are winning in the AI era by CEO and Founder, P...
Product School
 
Leading Change strategies and insights for effective change management pdf 1.pdf
Leading Change strategies and insights for effective change management pdf 1.pdfLeading Change strategies and insights for effective change management pdf 1.pdf
Leading Change strategies and insights for effective change management pdf 1.pdf
OnBoard
 
FIDO Alliance Osaka Seminar: The WebAuthn API and Discoverable Credentials.pdf
FIDO Alliance Osaka Seminar: The WebAuthn API and Discoverable Credentials.pdfFIDO Alliance Osaka Seminar: The WebAuthn API and Discoverable Credentials.pdf
FIDO Alliance Osaka Seminar: The WebAuthn API and Discoverable Credentials.pdf
FIDO Alliance
 
Epistemic Interaction - tuning interfaces to provide information for AI support
Epistemic Interaction - tuning interfaces to provide information for AI supportEpistemic Interaction - tuning interfaces to provide information for AI support
Epistemic Interaction - tuning interfaces to provide information for AI support
Alan Dix
 
State of ICS and IoT Cyber Threat Landscape Report 2024 preview
State of ICS and IoT Cyber Threat Landscape Report 2024 previewState of ICS and IoT Cyber Threat Landscape Report 2024 preview
State of ICS and IoT Cyber Threat Landscape Report 2024 preview
Prayukth K V
 
Monitoring Java Application Security with JDK Tools and JFR Events
Monitoring Java Application Security with JDK Tools and JFR EventsMonitoring Java Application Security with JDK Tools and JFR Events
Monitoring Java Application Security with JDK Tools and JFR Events
Ana-Maria Mihalceanu
 
The Future of Platform Engineering
The Future of Platform EngineeringThe Future of Platform Engineering
The Future of Platform Engineering
Jemma Hussein Allen
 
By Design, not by Accident - Agile Venture Bolzano 2024
By Design, not by Accident - Agile Venture Bolzano 2024By Design, not by Accident - Agile Venture Bolzano 2024
By Design, not by Accident - Agile Venture Bolzano 2024
Pierluigi Pugliese
 
FIDO Alliance Osaka Seminar: Overview.pdf
FIDO Alliance Osaka Seminar: Overview.pdfFIDO Alliance Osaka Seminar: Overview.pdf
FIDO Alliance Osaka Seminar: Overview.pdf
FIDO Alliance
 
Le nuove frontiere dell'AI nell'RPA con UiPath Autopilot™
Le nuove frontiere dell'AI nell'RPA con UiPath Autopilot™Le nuove frontiere dell'AI nell'RPA con UiPath Autopilot™
Le nuove frontiere dell'AI nell'RPA con UiPath Autopilot™
UiPathCommunity
 
Assure Contact Center Experiences for Your Customers With ThousandEyes
Assure Contact Center Experiences for Your Customers With ThousandEyesAssure Contact Center Experiences for Your Customers With ThousandEyes
Assure Contact Center Experiences for Your Customers With ThousandEyes
ThousandEyes
 
Unsubscribed: Combat Subscription Fatigue With a Membership Mentality by Head...
Unsubscribed: Combat Subscription Fatigue With a Membership Mentality by Head...Unsubscribed: Combat Subscription Fatigue With a Membership Mentality by Head...
Unsubscribed: Combat Subscription Fatigue With a Membership Mentality by Head...
Product School
 
GraphRAG is All You need? LLM & Knowledge Graph
GraphRAG is All You need? LLM & Knowledge GraphGraphRAG is All You need? LLM & Knowledge Graph
GraphRAG is All You need? LLM & Knowledge Graph
Guy Korland
 
GenAISummit 2024 May 28 Sri Ambati Keynote: AGI Belongs to The Community in O...
GenAISummit 2024 May 28 Sri Ambati Keynote: AGI Belongs to The Community in O...GenAISummit 2024 May 28 Sri Ambati Keynote: AGI Belongs to The Community in O...
GenAISummit 2024 May 28 Sri Ambati Keynote: AGI Belongs to The Community in O...
Sri Ambati
 
UiPath Test Automation using UiPath Test Suite series, part 4
UiPath Test Automation using UiPath Test Suite series, part 4UiPath Test Automation using UiPath Test Suite series, part 4
UiPath Test Automation using UiPath Test Suite series, part 4
DianaGray10
 
Elevating Tactical DDD Patterns Through Object Calisthenics
Elevating Tactical DDD Patterns Through Object CalisthenicsElevating Tactical DDD Patterns Through Object Calisthenics
Elevating Tactical DDD Patterns Through Object Calisthenics
Dorra BARTAGUIZ
 
Empowering NextGen Mobility via Large Action Model Infrastructure (LAMI): pav...
Empowering NextGen Mobility via Large Action Model Infrastructure (LAMI): pav...Empowering NextGen Mobility via Large Action Model Infrastructure (LAMI): pav...
Empowering NextGen Mobility via Large Action Model Infrastructure (LAMI): pav...
Thierry Lestable
 
Key Trends Shaping the Future of Infrastructure.pdf
Key Trends Shaping the Future of Infrastructure.pdfKey Trends Shaping the Future of Infrastructure.pdf
Key Trends Shaping the Future of Infrastructure.pdf
Cheryl Hung
 
SAP Sapphire 2024 - ASUG301 building better apps with SAP Fiori.pdf
SAP Sapphire 2024 - ASUG301 building better apps with SAP Fiori.pdfSAP Sapphire 2024 - ASUG301 building better apps with SAP Fiori.pdf
SAP Sapphire 2024 - ASUG301 building better apps with SAP Fiori.pdf
Peter Spielvogel
 

Recently uploaded (20)

Introduction to CHERI technology - Cybersecurity
Introduction to CHERI technology - CybersecurityIntroduction to CHERI technology - Cybersecurity
Introduction to CHERI technology - Cybersecurity
 
How world-class product teams are winning in the AI era by CEO and Founder, P...
How world-class product teams are winning in the AI era by CEO and Founder, P...How world-class product teams are winning in the AI era by CEO and Founder, P...
How world-class product teams are winning in the AI era by CEO and Founder, P...
 
Leading Change strategies and insights for effective change management pdf 1.pdf
Leading Change strategies and insights for effective change management pdf 1.pdfLeading Change strategies and insights for effective change management pdf 1.pdf
Leading Change strategies and insights for effective change management pdf 1.pdf
 
FIDO Alliance Osaka Seminar: The WebAuthn API and Discoverable Credentials.pdf
FIDO Alliance Osaka Seminar: The WebAuthn API and Discoverable Credentials.pdfFIDO Alliance Osaka Seminar: The WebAuthn API and Discoverable Credentials.pdf
FIDO Alliance Osaka Seminar: The WebAuthn API and Discoverable Credentials.pdf
 
Epistemic Interaction - tuning interfaces to provide information for AI support
Epistemic Interaction - tuning interfaces to provide information for AI supportEpistemic Interaction - tuning interfaces to provide information for AI support
Epistemic Interaction - tuning interfaces to provide information for AI support
 
State of ICS and IoT Cyber Threat Landscape Report 2024 preview
State of ICS and IoT Cyber Threat Landscape Report 2024 previewState of ICS and IoT Cyber Threat Landscape Report 2024 preview
State of ICS and IoT Cyber Threat Landscape Report 2024 preview
 
Monitoring Java Application Security with JDK Tools and JFR Events
Monitoring Java Application Security with JDK Tools and JFR EventsMonitoring Java Application Security with JDK Tools and JFR Events
Monitoring Java Application Security with JDK Tools and JFR Events
 
The Future of Platform Engineering
The Future of Platform EngineeringThe Future of Platform Engineering
The Future of Platform Engineering
 
By Design, not by Accident - Agile Venture Bolzano 2024
By Design, not by Accident - Agile Venture Bolzano 2024By Design, not by Accident - Agile Venture Bolzano 2024
By Design, not by Accident - Agile Venture Bolzano 2024
 
FIDO Alliance Osaka Seminar: Overview.pdf
FIDO Alliance Osaka Seminar: Overview.pdfFIDO Alliance Osaka Seminar: Overview.pdf
FIDO Alliance Osaka Seminar: Overview.pdf
 
Le nuove frontiere dell'AI nell'RPA con UiPath Autopilot™
Le nuove frontiere dell'AI nell'RPA con UiPath Autopilot™Le nuove frontiere dell'AI nell'RPA con UiPath Autopilot™
Le nuove frontiere dell'AI nell'RPA con UiPath Autopilot™
 
Assure Contact Center Experiences for Your Customers With ThousandEyes
Assure Contact Center Experiences for Your Customers With ThousandEyesAssure Contact Center Experiences for Your Customers With ThousandEyes
Assure Contact Center Experiences for Your Customers With ThousandEyes
 
Unsubscribed: Combat Subscription Fatigue With a Membership Mentality by Head...
Unsubscribed: Combat Subscription Fatigue With a Membership Mentality by Head...Unsubscribed: Combat Subscription Fatigue With a Membership Mentality by Head...
Unsubscribed: Combat Subscription Fatigue With a Membership Mentality by Head...
 
GraphRAG is All You need? LLM & Knowledge Graph
GraphRAG is All You need? LLM & Knowledge GraphGraphRAG is All You need? LLM & Knowledge Graph
GraphRAG is All You need? LLM & Knowledge Graph
 
GenAISummit 2024 May 28 Sri Ambati Keynote: AGI Belongs to The Community in O...
GenAISummit 2024 May 28 Sri Ambati Keynote: AGI Belongs to The Community in O...GenAISummit 2024 May 28 Sri Ambati Keynote: AGI Belongs to The Community in O...
GenAISummit 2024 May 28 Sri Ambati Keynote: AGI Belongs to The Community in O...
 
UiPath Test Automation using UiPath Test Suite series, part 4
UiPath Test Automation using UiPath Test Suite series, part 4UiPath Test Automation using UiPath Test Suite series, part 4
UiPath Test Automation using UiPath Test Suite series, part 4
 
Elevating Tactical DDD Patterns Through Object Calisthenics
Elevating Tactical DDD Patterns Through Object CalisthenicsElevating Tactical DDD Patterns Through Object Calisthenics
Elevating Tactical DDD Patterns Through Object Calisthenics
 
Empowering NextGen Mobility via Large Action Model Infrastructure (LAMI): pav...
Empowering NextGen Mobility via Large Action Model Infrastructure (LAMI): pav...Empowering NextGen Mobility via Large Action Model Infrastructure (LAMI): pav...
Empowering NextGen Mobility via Large Action Model Infrastructure (LAMI): pav...
 
Key Trends Shaping the Future of Infrastructure.pdf
Key Trends Shaping the Future of Infrastructure.pdfKey Trends Shaping the Future of Infrastructure.pdf
Key Trends Shaping the Future of Infrastructure.pdf
 
SAP Sapphire 2024 - ASUG301 building better apps with SAP Fiori.pdf
SAP Sapphire 2024 - ASUG301 building better apps with SAP Fiori.pdfSAP Sapphire 2024 - ASUG301 building better apps with SAP Fiori.pdf
SAP Sapphire 2024 - ASUG301 building better apps with SAP Fiori.pdf
 

D41037045

  • 1. Research Inventy: International Journal Of Engineering And Science Vol.4, Issue 1 (January 2014), PP 37-45 Issn(e): 2278-4721, Issn(p):2319-6483, Www.Researchinventy.Com Delineation of Magnetic Zones of Sokoto Basin, in Northwestern Nigeria, Using Aeromagnetic Data. Bonde,D. S.*1; Udensi E.E2; Momoh M1. 1 Department of physics, Kebbi State University of Science and Technology, Aliero. 2 Department of physics, Federal University Technology, Minna. ABSTRACT:The Sokoto Sedimentary Basin in northwestern Nigeria, is situated between latitudes 10 o 30″ N to 14o 00″ N and longitude 3o30″ E to 7o 00″ E with an estimated area of 59,570 km 2.We used visual interpolation method to digitized twenty nine aeromagnetic maps of the Basin, the data obtained was used to produce the Total Magnetic Intensity and the Residual Maps. The Residual Magnetic Map was subjected to Upward continuation techniques; applied at 2km, 3km, 5km, 7km, 10km and 15km. The results of the studies delineated areas of higher sedimentations such as Isah, Rabah, Talata/Mafara and Gandi in the northeastern part of the area. These areas of relatively thicker sediments, identified in this study, are therefore the most probable sites for prospect of hydrocarbon accumulation in the area. KEYWORDS:Magnetic Anomaly,Total magnetic Intensity Map, Residual map. I. INTRODUCTION The earth and its contents have long been of concern to mankind. Man has tried to unravel its complexity and delve into its origin via various geophysical methods. The subsurface has been of particular concern to geoscientists, who seek to investigate it using diverse means, some for the purpose of having knowledge, while others do it for exploration of economic resources such as minerals and hydrocarbons. With the advances in technology and the need to have a clearer picture of the earth subsurface and its contents, the earth scientists have deemed it necessary to utilize the properties associated with earth’s interior. Geophysics involves the application of physical principles and quantitative physical measurements in order to study the earth’s interior. The analysis of these measurements can reveal how the earth interior varies both vertically and laterally, and the interpretation of which can reveal meaningful information on the geological structures beneath Dobrin (1976).By working at different scales, geophysical methods may be applied to a wide range of investigations from studies of the entire earth to exploration of a localized region of the upper crust for engineering or other purposes (Kearey et al., 2004). A wide range of geophysical methods exist for each of which there is an operative physical property to which the method is sensitive. The type of physical property to which a method responds clearly determines its range of application. Thus, for instance, magnetic method is very suitable for locating buried magnetic ore bodies because of their magnetic susceptibility. Similarly, seismic and electrical methods are suitable for locating water table, because saturated rock may be distinguished from dry rock by its higher seismic velocity and higher electrical conductivity (Kearey et al., 2004). In exploration for subsurface resources, the geophysical methods are capable of detecting and delineating local features of potential interest. Geophysical methods for detecting discontinuities, faults, joints and other basement structures, include the following: magnetics, seismic, resistivity, electrical, potential field, well logging, gravity, radiometric, thermal etc (Corell andGrauch,1985) . Some geophysical methods such as gamma- ray spectrometry and remote sensing measure surface attributes; others, such as thermal and some electrical methods are limited to detecting relatively shallow subsurface geological features. Geophysical modeling provides generalized and no-unique solution to questions concerning the concerning the geometry of the subsurface geologic structures (Reeves, 2005).Most economic minerals, oil, gas, and groundwater lie concealed beneath the earth surface, thus hidden from direct view. The presence and magnitude of these resources can only be ascertained by geophysical investigations of the subsurface geologic structures in the area.In study of sedimentary basins for hydrocarbon potentials; depth estimation of the sediments is very crucial because all other necessary conditions for hydrocarbon maturation depend on the thickness of the basin. Therefore If the area under investigation has no previous geological information and the primary aim of the study is to search for hydrocarbon deposits; the first question that must be answered, is whether the sedimentary basin is large enough and thick enough to justify any further investigations ( Reynolds,1990).Other criteria for assessing a basin for possible hydrocarbon accumulation are as follows: 37
  • 2. Delineation Of Magnetic Zones Of Sokoto Basin…      Source rock: The presence of a source rock with adequate organic materials of various types determines whether oil or gas will be sourced in the process of hydrocarbon generation. Reservoir rock: Reservoir rock ensures that hydrocarbon generated are accommodated in pore spaces that exists between the grains in the subsurface. Seal: seals are normally without pore spaces ensures that hydrocarbon generated in the reservoir rocks are kept in place and prevented from migrating to the surface and subsequent loss. Paleotemperatures: Paleotemperatures or ancient Paleotemperatures are responsible for generation of hydrocarbon from organic matter. Trap:The trap ensures that oil sealed in place does not migrate and be lost. In this study, aeromagnetic data of Sokoto Basin was used to produce total magnetic intensity and residual magnetic maps of the basin. The residual map was subjected to Upward continuation techniques; applied at 2km, 3km, 5km, 7km, 10km and 15km to delineate areas of higher sedimentation which might favor accumulation of hydrocarbon.. 1.1 The study area The study area is the Sokoto Sedimentary Basin, in northwestern Nigeria (Figure1.1).The Sokoto Basin lies between longitudes 3030″E and 6o58″E and latitudes 10o 20″N and 14o 00″N with an estimated area of 59,570 km2.The Basin is covered by twenty- nine half-degree aeromagnetic maps (8-13; 26-32; 48-54; 71-74; 94-97; and 116-119) of the Geology Survey of Nigeria, now renamed the Nigerian Geological Survey Agency (NGSA). The Sokoto Sedimentary Basin forms the southeastern segment of a large synclinal basin, the Iullemmeden basin. The Iullemmeden basin (Figure 1.2) lies entirely with the Pan African province of West Africa; which encompasses parts of Algeria, Mali, and republics of Benin and Niger. The Basin is bounded to the north by the massifs of the Adrar des Iforas, Hoggar and Air regions. To the west, it is connected to the Taoudeni Basin by the Gao trough. To the east the Iullemmeden Basin is contiguous with the Chad Basin, through the Damergou area. In the south, the basement rocks of northern Nigeria delimit the Iullemmeden basin. The center of the Iullemmeden basin is located north of Niamey in the republic of Niger. 38
  • 3. Delineation Of Magnetic Zones Of Sokoto Basin… 1.2 Aim and objectives of the study The aim of the present study is to apply upward continuation techniques on the residual magnetic intensity map of Sokoto sedimentary basin with a view of delineating magnetic zones The objectives of the study include the following:  To delineate magnetic zones in sokoto basin using upward continuation techniques.  To determine the economic potentials of the basin in terms of hydrocarbon prospects.  The study would generate and upgrade the existing geophysical database of the study area. II. MATERIALS AND METHODS The study area is covered by twenty nine aeromagnetic maps of total field intensity in half –degree sheets. These maps are obtained from the Nigerian Geological Survey Agency (NGSA), now renamed the Nigerian Geological Survey Agency (NGSA)).The Agency carried out an airborne magnetic survey of substantial part of Nigeria between 1974 and 1980. The magnetic information consists of flight lines plotted on a continuous strip chart or tape records. The data were collected at a nominal flight altitude of 152.4m along N-S flight lines spaced approximately 2 km apart. The magnetic data collected were published in the form ½ degree aeromagnetic maps on a scale of 1:100,000. The magnetic values were plotted at 10nT (nano Tesla) interval. The maps are numbered, and names of places and coordinates (longitude and latitudes) written for easy reference and identification. The actual magnetic values were reduced by 25,000gamma before plotting the contour map. This implies that the value 25,000 gamma is to be added to the contour values so as to obtain the actual magnetic field at a given point. A correction based on the International Geomagnetic Reference Field, (IGRF,) and epoch date January 1, 1974 was included in all the maps. The visual interpolation method,that is the method of digitizing on Grid Layout was used to obtain the data from field intensity aeromagnetic maps covering the study area. The data from each digitized map is recorded in a 19 by 19 coding sheet which contains the longitude, latitude and the name of the town flown and the sheet number. The unified composite dataset for the study area was produced after removing the edge effect. Surfer 8 Geosoftware was used to import the data set. The dataset consists of three columns (longitude,latitude and magnetic values). The composite map was produced using Oasis Montaj.. 2.1 Production of Regional and Residual Maps The residual magnetic field of the study area was produced by subtracting the regional field from the total magnetic field using the Polynomial fitting method. The computer program Aerosupermap was used to generate the coordinates of the total intensity field data values. This super data file, for all the magnetic values was used for production of composite aeromagnetic map of the study area using Oasis Montaj software version 7.2 A program was used to derive the residual magnetic values by subtracting values of regional field from the total magnetic field values to produce the residual magnetic map and the regional map. 2.2Upward Continuation Upward continuation is used in order to simplify the appearance of regional magnetic maps by suppressing the effects due to local features. The proliferation of local magnetic anomalies often obscures the regional features with an overabundance of detail. Upward continuation thus smoothed out these disturbances without impairing the main regional features.The main purpose of upward continuation is to view the magnetic field intensity at a height above flight level so as to eliminate short wavelength anomalies by emphasizing longer ones reflecting regional features. The total magnetic field of the earth obeys coulomb’s inverse square law (TMI a 1/r2) 2.1 it falls off rapidly with height i r. A potential field measured on a given observation plane at a constant height can be calculated as though the observations were made on different plane, either higher (upward continuation) or lower (downward continuation). The equation of the wave number domain filter to produce upward continuation is simply: F = e- hw Where (h) is the continuation height. 2.2 39
  • 4. Delineation Of Magnetic Zones Of Sokoto Basin… This function decays steadily with increasing wave number, attenuating the height wavenumbers more severely, thus producing a map in which more regional features predominate. Similarly the equation of the wave number domain filter to produce downward continuation is: F = ehw 2.3 This is a curve, which is zero at wave number and increases exponentially at higher wavenumber, thus emphasizing the effect of shallow sources and noise. Noise removal is therefore an essential first step before downward continuation is applied,and continuation depths should not exceed real source depths. Some careful experimentation is usually necessary to obtain acceptable result (Reeves, 2005). III. RESULTS AND ANALYSIS The total magnetic intensity map ﴾TMI﴿ of the Sokoto sedimentary basin produced from this study using Oasis Montaj is as shown in Figure 3.1. Figure 3.1 The total magnetic intensity map ﴾TMI﴿ The TMI map of Sokoto sedimentary basin can be divided into main three sections, though minor depressions exist scattered all over area. The northern part of the Sokoto basin is characterized by low magnetic intensity values represented by dark-green-blue color. Whereas the southern part is dominated by high magnetic intensity values indicated by red color. The two sections are separated by a zone characterized by medium magnetic intensity values area depicted by yellow-orange color. These high magnetic intensity values, which dominate the southern part of the Sedimentary basin are caused probably by near surface igneous rocks of high values of magnetic susceptibilities. The low amplitudes are most likely due to sedimentary rocks and other non-magnetic sources. In general, high magnetic values arise from igneous and crystalline basement rocks. Whereas low magnetic values are usually from sedimentary rocks or altered basement rocks. The sedimentary thickness of the Sokoto basin in general, appears to increases from south to north. This collaborates well with earlier findings of 2D Seismic surveys conducted by ELF and Mobil Companies carried out in 1979.Inspection of the total magnetic intensity map (TMI) of the study area( Figure 3.1)does not show any general or particular trend. However, northeast- southwest trend is observed in the north central part of the total magnetic intensity map of the study area. Ananaba and Ajakaiye﴾1989﴿based on lineament of LANDSAT images, identified predominate tectonic trends in the NE –SW, NW-SE directions over the entire basin and in particular over parts of the country rejuvenated during tectonic phase of the pan Africa Oregency.Umego, ﴾1990﴿, in a study of aeromagnetic field over the Sokoto basin, identified the existence of NE-SW trending anomalies as the predominant magnetic features in the area. He observed that the sediments in the basin were not subjected to a 40
  • 5. Delineation Of Magnetic Zones Of Sokoto Basin… remarkable degree of faulting as only NW-SE trending faults have been observed in the vicinity of Dange( sheet No.29) and Gilbedi villages within the study. 3.1 Regional Magnetic Intensity Map The regional magnetic intensity map of the study area (Figure 3.2) produced using Oasis Montaj. Figure 3.2 The regional magnetic intensity map of the study area. The regional magnetic values ranges from 7830nano tesla to 7870nano tesla and the values decreases from south to north indicating there is a fill of sediments more in the northern part of the basin than in the southern part of the study areaThe trend of the regional map of the study areas is in the east-west direction. The regional trend is attributed to effects of deeper heterogeneity of the earth crust. The regional map (Figure 3.2) agrees well with the total magnetic intensity map obtained from the study. 3.2 Residual Magnetic Intensity Map Figure 3.3 is the residual magnetic intensity maps of the study area obtained from the total magnetic intensity map produced using Surfer 8, while Figure 3.4 the residual magnetic intensity maps of the study area obtained from the total magnetic intensity map produced using a Oasis Montaj. 41
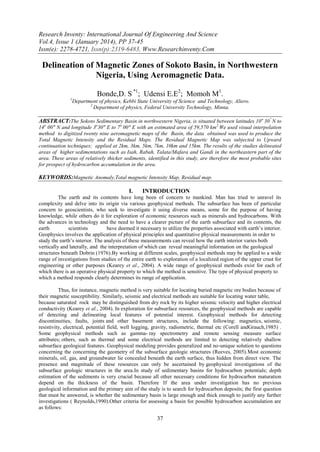
  • 6. Delineation Of Magnetic Zones Of Sokoto Basin… 13 120 100 12.5 latitude 80 60 40 12 20 0 -20 11.5 -40 -60 -80 11 -100 -120 -140 10.5 3.5 -160 4 4.5 5 5.5 6 6.5 Figure 3.3 the residual magnetic intensity maps of the study area(Surfer8) longitude Figure 4.6: The residual magnetic map of the study area Figure 3.4 the residual magnetic intensity maps of the study area(Oasis Montaj) 42
  • 7. Delineation Of Magnetic Zones Of Sokoto Basin… The magnetic intensity values ranges from -10 nano tesla to 40 nano tesla. Negative magnetic intensity values are more predominant in the northern section of the study area while the southwest has more of positive magnetic intensity values. Northeast –Southwest trends are observed in the north central part of the TMI map. 3.3 TMI Upward continued at 2km The total magnetic intensity map of the study area was upward continued at 2 km to produce Figure 3.6 At the height of 2 km, the shorter wavelength anomalies are visible, though slightly refined than the total magnetic intensity map. Four sections can be observed.At the bottom side of the map (latitude 11 o 00″N to 12o 00″N and longitude 3o 30″E to 5o 00″E), is predominantly pink color with few traces of green and blue colors. A light pink color is observed in the middle of this portion. Within the range of longitude 3o 30″E to 5o 00″E and latitude 12o 00″N to 13 o 00″N is a section characterized by yellow color with few traces of green and blue pigments.The third section is the area defined by latitude 12 o00″N to 13 o30″N and longitude 3o 30″E to 6o 00″E. Green color dominates this portion of the map.At the extreme northern part of the map, approximately the ranges of longitude 4 o 30″E to 6 o 30″E and latitude 12 o.00″N to 13 o30″N, blue and dark- blue colors are prevalent in this area. This is the section of the study area having the highest sedimentary thickness. Figure 3.6 Figure 3.7 Figure 3.9 Figure 3.8 Figure 3.10 Figure 3.11 TMI Upward continued at 3km The map of upward continuation to 3 km is shown in Figure 4.7 This figure shows that there is a net difference between the TMI maps at this flight level. Here, the short wavelength anomalies have begun disappearing thereby consolidating longer wavelength, anomaly units are getting enhanced. Concrete links between same anomaly types are clearly visible and distinct. We can see that yellow to velvet color shaded anomalies are on the other hand maturing by enhancing blue color shaded anomalies. The map can be divided into four sections. At the bottom side of the map (latitude 11 o 00″N to 12o 00″N and longitude 3o 30″E to 5o 00″E), is predominantly pink color with few traces of green and blue colors. A light pink color is observed in the middle of this portion.Within the range of longitude 3 o 30″E to 5o 00″E and latitude 12o 00″N to 13 o 00″N is 43
  • 8. Delineation Of Magnetic Zones Of Sokoto Basin… a section characterized by yellow color with few traces of green and blue pigments.Green color dominates the portion of the map defined by latitude 12 o00″N to 13 o30″N and longitude 3o 30″E to 6o 00″E. At approximately the ranges of longitude 4 o 30″E to 6 o 30″E and latitude 12 o.00″N to 13 o30″N,(at the extreme northern part of the map) blue and dark- blue colors are prevalent in this area which indicates areas of highest sedimentary thicknesses TMI Upward continued at 5km The upward continuation of the total magnetic field map at 5 km is shown in Figure 4.8 The map shows that basement features are standing out at the detriment of shallow sedimentary features. Basement structures and the lineaments in the study area are here well defined because erratic signals are filtered. Fault boundaries between basement and sedimentary areas can be clearly seen. At the bottom side of the map (latitude 11o 00″N to 12o 00″N and longitude 3o 30″E to 5o 00″E), is predominantly pink color with few traces of green and blue colors. A light pink color is observed in the middle of this portion. Within the range of longitude 3o 30″E to 5o 00″E and latitude 12o 00″N to 13 o 00″N is a section characterized by yellow color with few traces of green and blue pigments. The third section is the area defined by latitude 12 o00″N to 13 o30″N and longitude 3o 30″E to 6o 00″E. Green color dominates this portion of the map. Areas around bounded by longitude 4 o 30″E to 6 o 30″E and latitude 12 o.00″N to 13 o30″N, blue and dark- blue colors are prevalent in this area. This is the section having the highest sedimentary thickness in the study area. TMI Upward continued at 7km The map of the upward continuation 7 km height above flight level is shown in Figure 4.9 At this height, basement structures occupy much more portion of the study area. Low magnetic areas are found to be northern part. At 7 km depth, the erratic signals are very minimal , hence basement structures and lineaments in the study area are here well defined at this depth. Around the areas bounded by latitude 11o 00″N to 12o 00″N and longitude 3o 30″E to 5o 00″E, is predominantly pink color with few traces of green and blue colors. A light pink color is noticeable in the middle of this portion. Within the range of longitude 3o 30″E to 5o 00″E and latitude 12o 00″N to 13 o 00″N is a section characterized by yellow color with few traces of green and blue pigments. The third section is the area defined by latitude 12 o00″N to 13 o30″N and longitude 3o 30″E to 6o 00″E. Green color dominates this portion of the map. At the extreme northern part of the map, approximately the ranges of longitude 4 o 30″E to 6 o 30″E and latitude 12 o.00″N to 13 o30″N, blue and dark- blue colors are common in the area . This particular section of the study area shows the highest sediments. TMI Upward continued at 10 km The map of the upward continuation at 10 km height above flight level is sho 4.10. At this height, basement structures appeared quite distinct from the sedimentary areas. Areas of lowest magnetic values, (i.e areas of thicker deposits of sediments) found to be at northeast part of the study area. The forth section of this map, particularly the area defined by longitude 5 o30″E to 6o 30″E and latitude12o 00″N to13o 00″N is large a portion of dark blue color ; clearly an indication of the area having the highest sedimentary thickness in the study area.At the bottom side of the map (latitude 11 o 00″N to 12o 00″N and longitude 3o 30″E to 5o 00″E), is predominantly pink color with few traces of green and blue colors. A light pink color is observed in the middle of this portion.The area bounded by longitude 3 o 30″E to 5o 00″E and latitude 12o 00″N to 13 o 00″N is a section characterized by yellow color with few traces of green and blue pigments. The third section is the area defined by latitude 12 o00″N to 13 o30″N and longitude 3o 30″E to 6o 00″E. Green color dominates this portion of the map.At the extreme northern part of the map, approximately the ranges of longitude 4 o 30″E to 6 o 30″E and latitude 12 o.00″N to 13 o30″N, blue and dark- blue colors are prevalent in this area. This is the section having the highest sedimentary thickness in the study area. TMI Upward continued at 15km The map of the upward continuation at 15 km height above flight level is shown in Figure 4.11. At this height, basement structures appeared quite distinct from the sedimentary areas. Areas of lowest magnetic values, (i.e areas of thicker deposits of sediments) found to be at northeast part of the study area. The forth section of this map, particularly the area defined by longitude 5 o30″E to 6o 30″E and latitude12o 00″N to13o 00″N is large portion of dark blue color ; clearly and indication of the area having the highest sedimentary thickness in the study area. This area is found to be in sheets numbers 11 (Rabah) and 12 (Isah) of the index map of Nigeria .comparison and close observation of the maps of downward continuation at depths of 2 km, 3 km, 5 km, 7 km and 10 km clearly show progressive disappearance of disturbances (noises) due to the shallow effect of the magnetic anomalies, thereby enhancing the regional effects distinctively. The northern part of the study area is generally characterized with low magnetic values, an indication of either thicker sediments in the 44
  • 9. Delineation Of Magnetic Zones Of Sokoto Basin… region, or deep seated anomalies. Figures 3.10 and 3.11clearly show the regional effects and the maps trend wise resembles the total magnetic intensity map as well as the regional map of the study area. IV. CONCLUSION AND RECOMMENDATIONS The analysis of the total magnetic intensity map (TMI), the regional map, the residual map, the the upward continuation maps at 2km, 3km, 5km, 7km, 10km and 15km of Sokoto basin, all indicate that the basin is shallower in the south and thicker in the north which borders with Niger Republic Upward continuation results delineated Rabah , Isah, Gandi and Mafara areas having highest sedimentation in the study area. The result collaborates with those obtained by other researchers that conducted studies in some sections of the basin; notably are results of studies by Umego (1990), Adetonaet al.,( 2007),Uwah. (1984) and Udensi (2013). Exploration of the Nigerian inland basins is worth given a push. Hydrocarbons if discovered and harnessed findings will increase the country’s reserve and boost productivity. All these will have economic and strategic benefits for the country. There is therefore the need to take advantage of modern geophysical methods in the exploration of Nigerian inland basins. REFERENCES [1] [2] [3] [4] [5] [6] [7] [8] [9] [10] [11] [12] [13] [14] Adetona, A.A.,Udensi, E.E and Agelaga, A.G. (2007), Determination of depth to buried magnetic rocks under the lower Sokoto basin using aeromagnetic data. Nigerian Journal of physics Vol.19 (2), Pp 275-283. .Ananaba, S.E. and Ajakaiye, D.E. (1989), Evidence of tectonic control of mineralization in Nigeria from Lineament density analysis: A landsat – study int. Journal of remote sensing.Vol(8) Pp. 144-1453. Ayuba,B.H. (1999), A three dimensional interpretation of aeromagnetic Anomaly near Dange village, Sokoto State Nigeria. Unpublish MSc Thesis. Physics Department Ahmadu Bello University Zaria, Nigeria Corell, L. and Grouch, V.J.S. (1985), Mapping basement zones from magnetic data in the san juan basin; New Mexico: presented at the 52nd Annual International Meeting, Society or exploration, geophysicists, Dallas U.S.A. Dobrin, M.B. (1976), Introduction to Geophysical Prospecting. Mc-Graw Hill Books Co (3rd Ed.) N.Y. Pp. 630 Kearey, P, Brooks, M. and Hill, I. (2004), An Introduction to Geophysical Exploration. Third• Edition, Blackwell Pub. Nigerian Geology Survey Agency,(1976), Geology Map of Nigeria. Scale1:2,00 000. Geology Survey of Nigeria, Kaduna, Nigeria Oasis Montaj Version 7.2 softwareinc. Reeves, C. ( 2005);Aeromagnetic Surveys; Principles, Practice and Interpretation, Training Programme, NGSA, Nigeria. Reynolds, J.M. (1990): An introduction to applied and environmental Geophysics, John Willey and sons Limited Pp 116 – 207. Surfer (R) version 8.01 2002 Golden software inc. Udensi,E.E.,(2013),Subduing the Earth with Exploration Geophysics; My contribution, Inaugural Lecture series No.24 of Federal University of Technology, Minna.,Nigeria. Umego,M. (1990),Structural interpretation of gravity and Aeromagnetic Anomalies over Sokoto Basin, north’ Western Nigeria. Unpublished PhD Thesis, Department of Physics, Ahmadu Bello University, Zaria, Nigeria. Uwah, EJ.(1984), Investigation of radiometric anomalies by nuclear and other methods; A case study of Sokoto Basin of Nigeria. Unpublished Ph.D Thesis.Ahmadu Bello University Zaria. Nigeria 45