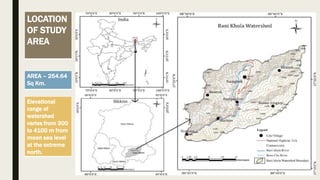
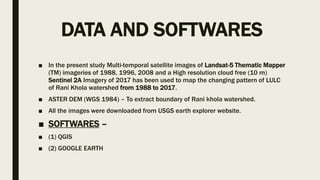
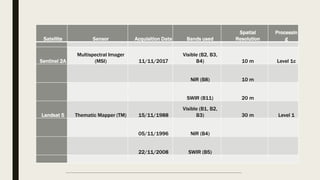
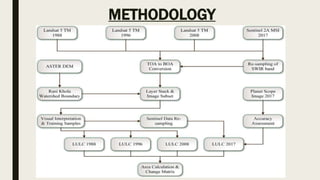
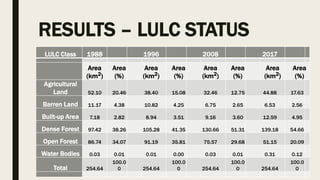
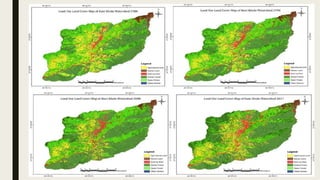
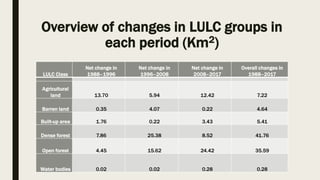
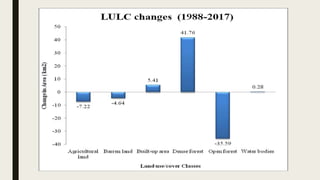
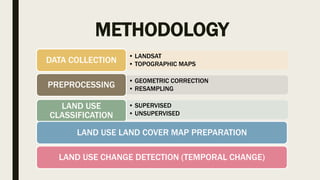
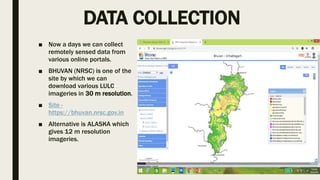
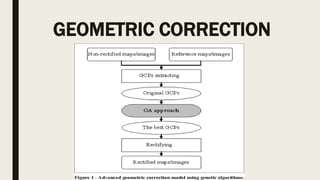
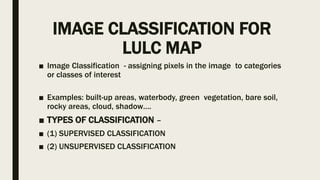
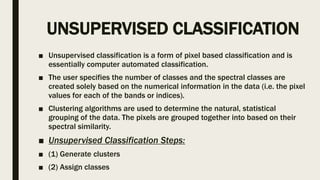
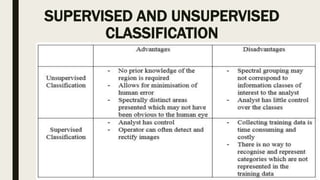
The document provides an overview of land use and land cover (LULC) analysis using remote sensing and GIS techniques. It discusses key terminologies like land cover and land use. LULC studies are important for planning, management and monitoring programs. The methodology involves data collection, preprocessing like geometric and radiometric corrections, image classification using supervised or unsupervised methods to produce LULC maps. A case study on LULC change detection in Sikkim Himalaya, India from 1988-2017 is presented which found increases in dense forest and agriculture land areas over the study period. RS and GIS techniques are concluded to be very useful for LULC monitoring and assessment.


![SUPERVISED CLASSIFICATION
ALGORITHMS
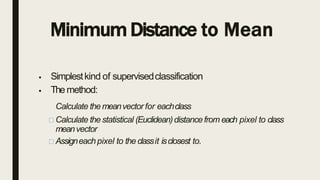
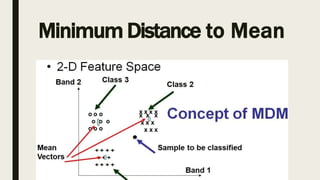
■ Minimum Distance to mean (MDM)
■ Parellelpiped
■ Maximum Likelihood (ML) [ One of the best and used
method ]](https://image.slidesharecdn.com/landcoverandlanduse-200203130546/85/Land-cover-and-Land-Use-14-320.jpg)
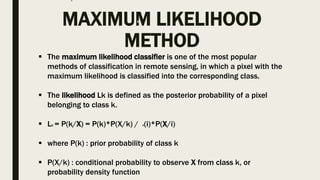
![Usually P(k) are assumed to be equal to each other and P(i)*P(X/i) is also common to all
classes.
Therefore Lk depends on P(X/k) or the probability density function.
For mathematical reasons, a multivariate normal distribution is applied as the probability
density function. In the case of normal distributions, the likelihood can be expressed as
follows.
where n: number of bands
X: image data of n bands
Lk(X) : likelihood of X belonging to class k
k : mean vector of class k
∑k : variance-covariance matrix of class k
[ One of the best and used method ]](https://image.slidesharecdn.com/landcoverandlanduse-200203130546/85/Land-cover-and-Land-Use-20-320.jpg)