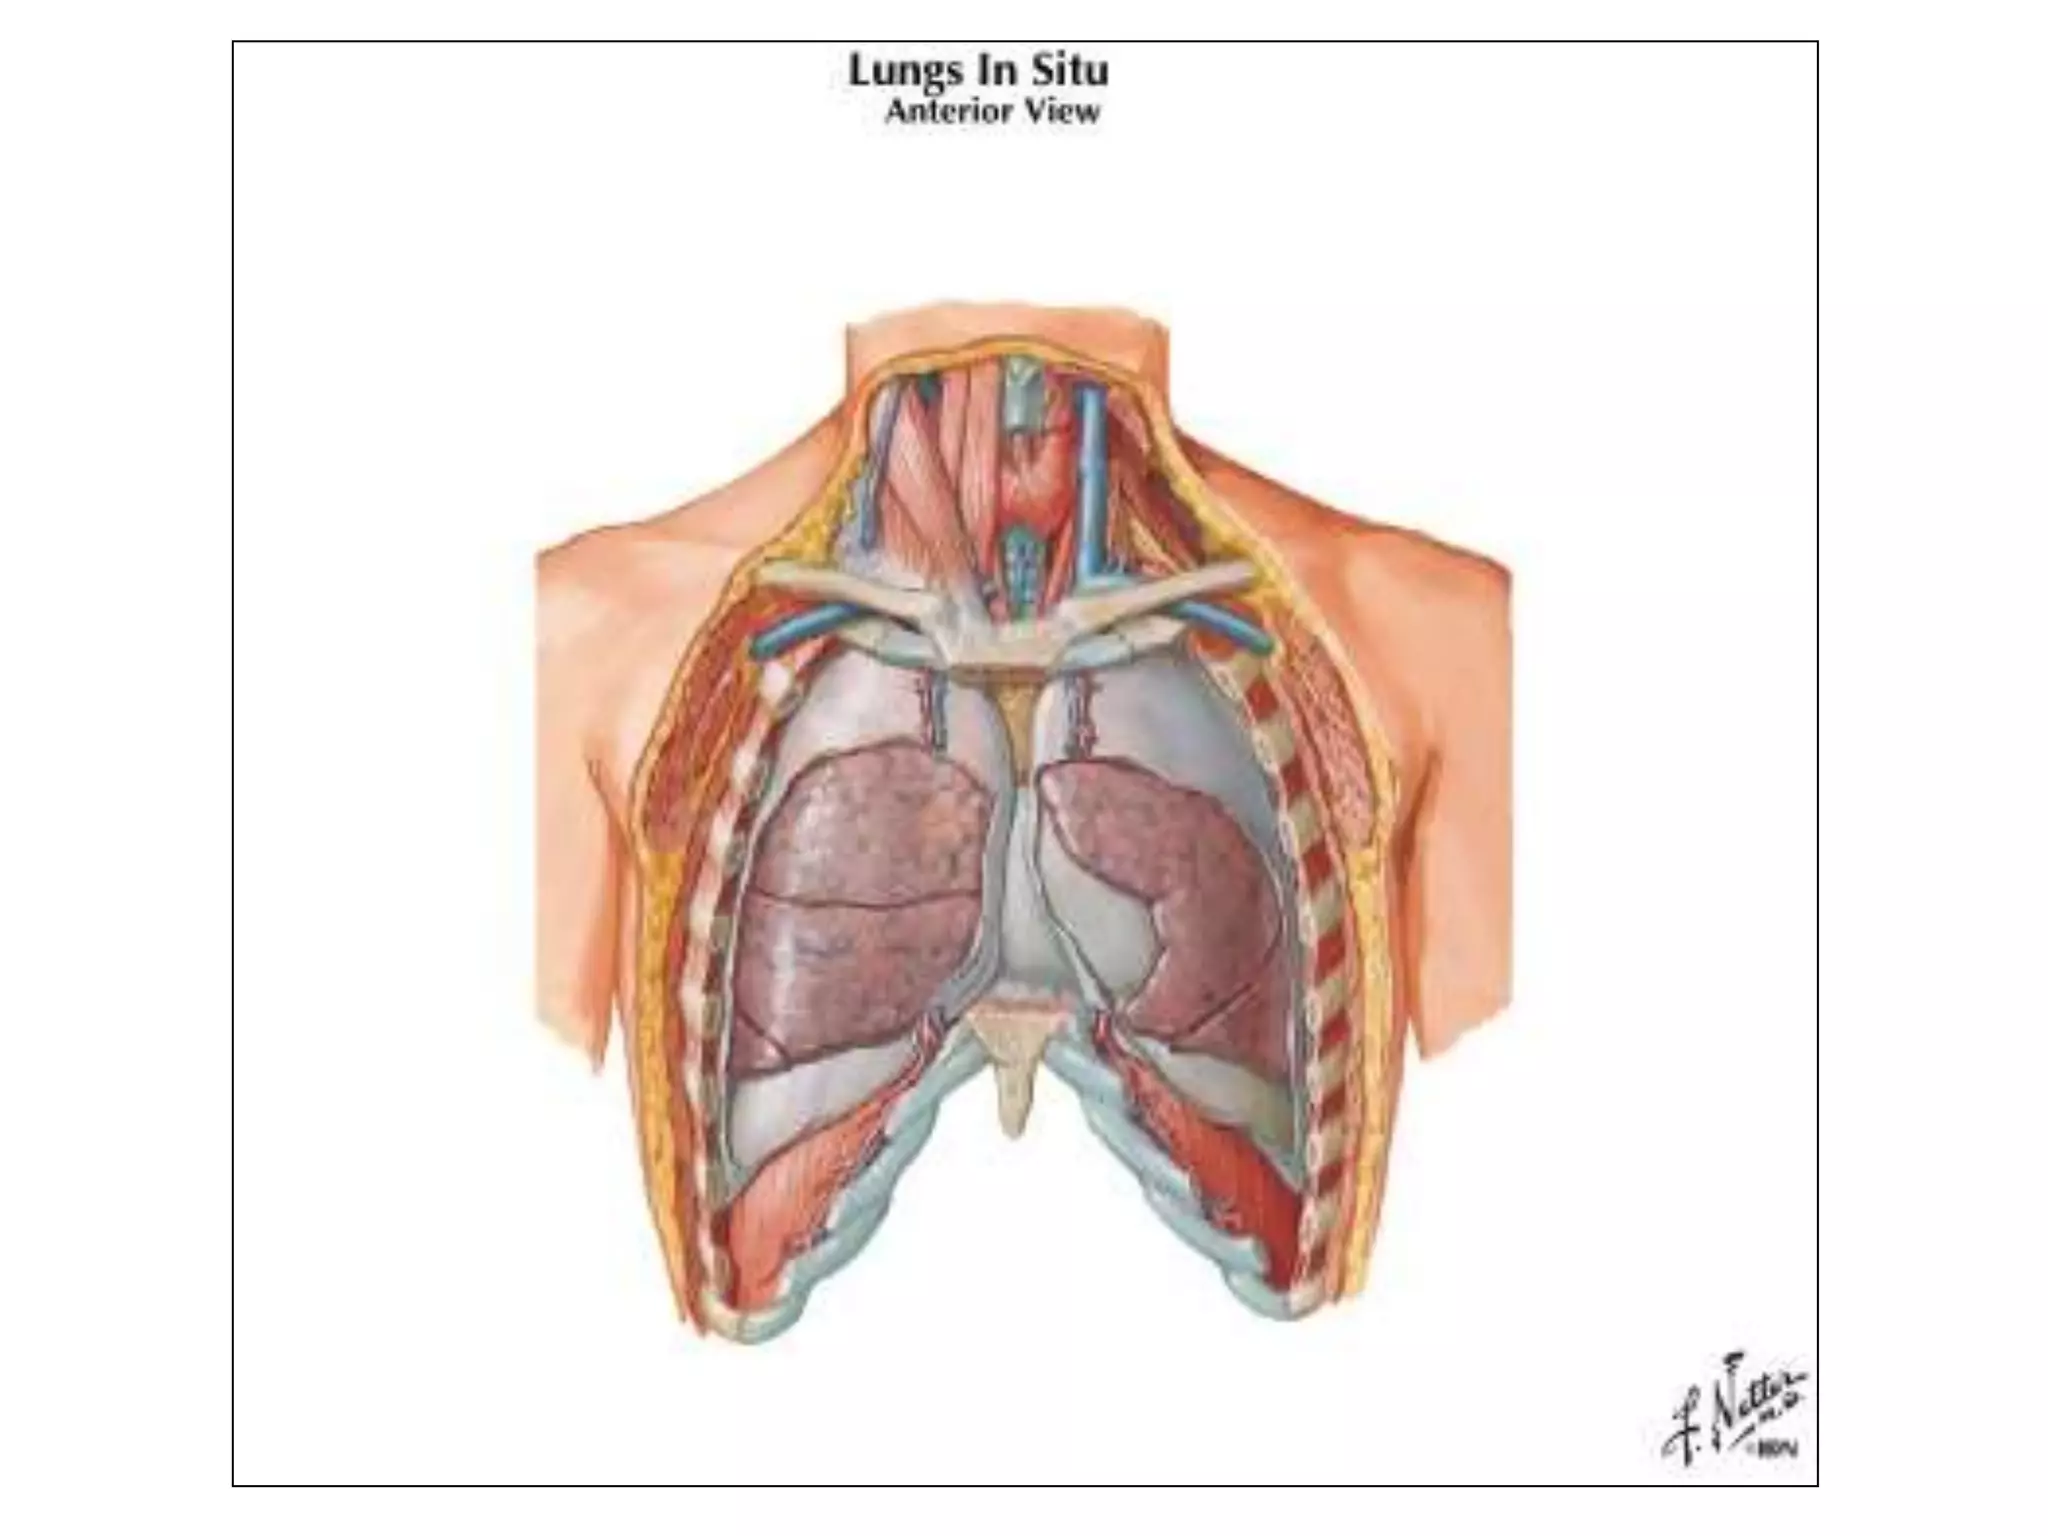
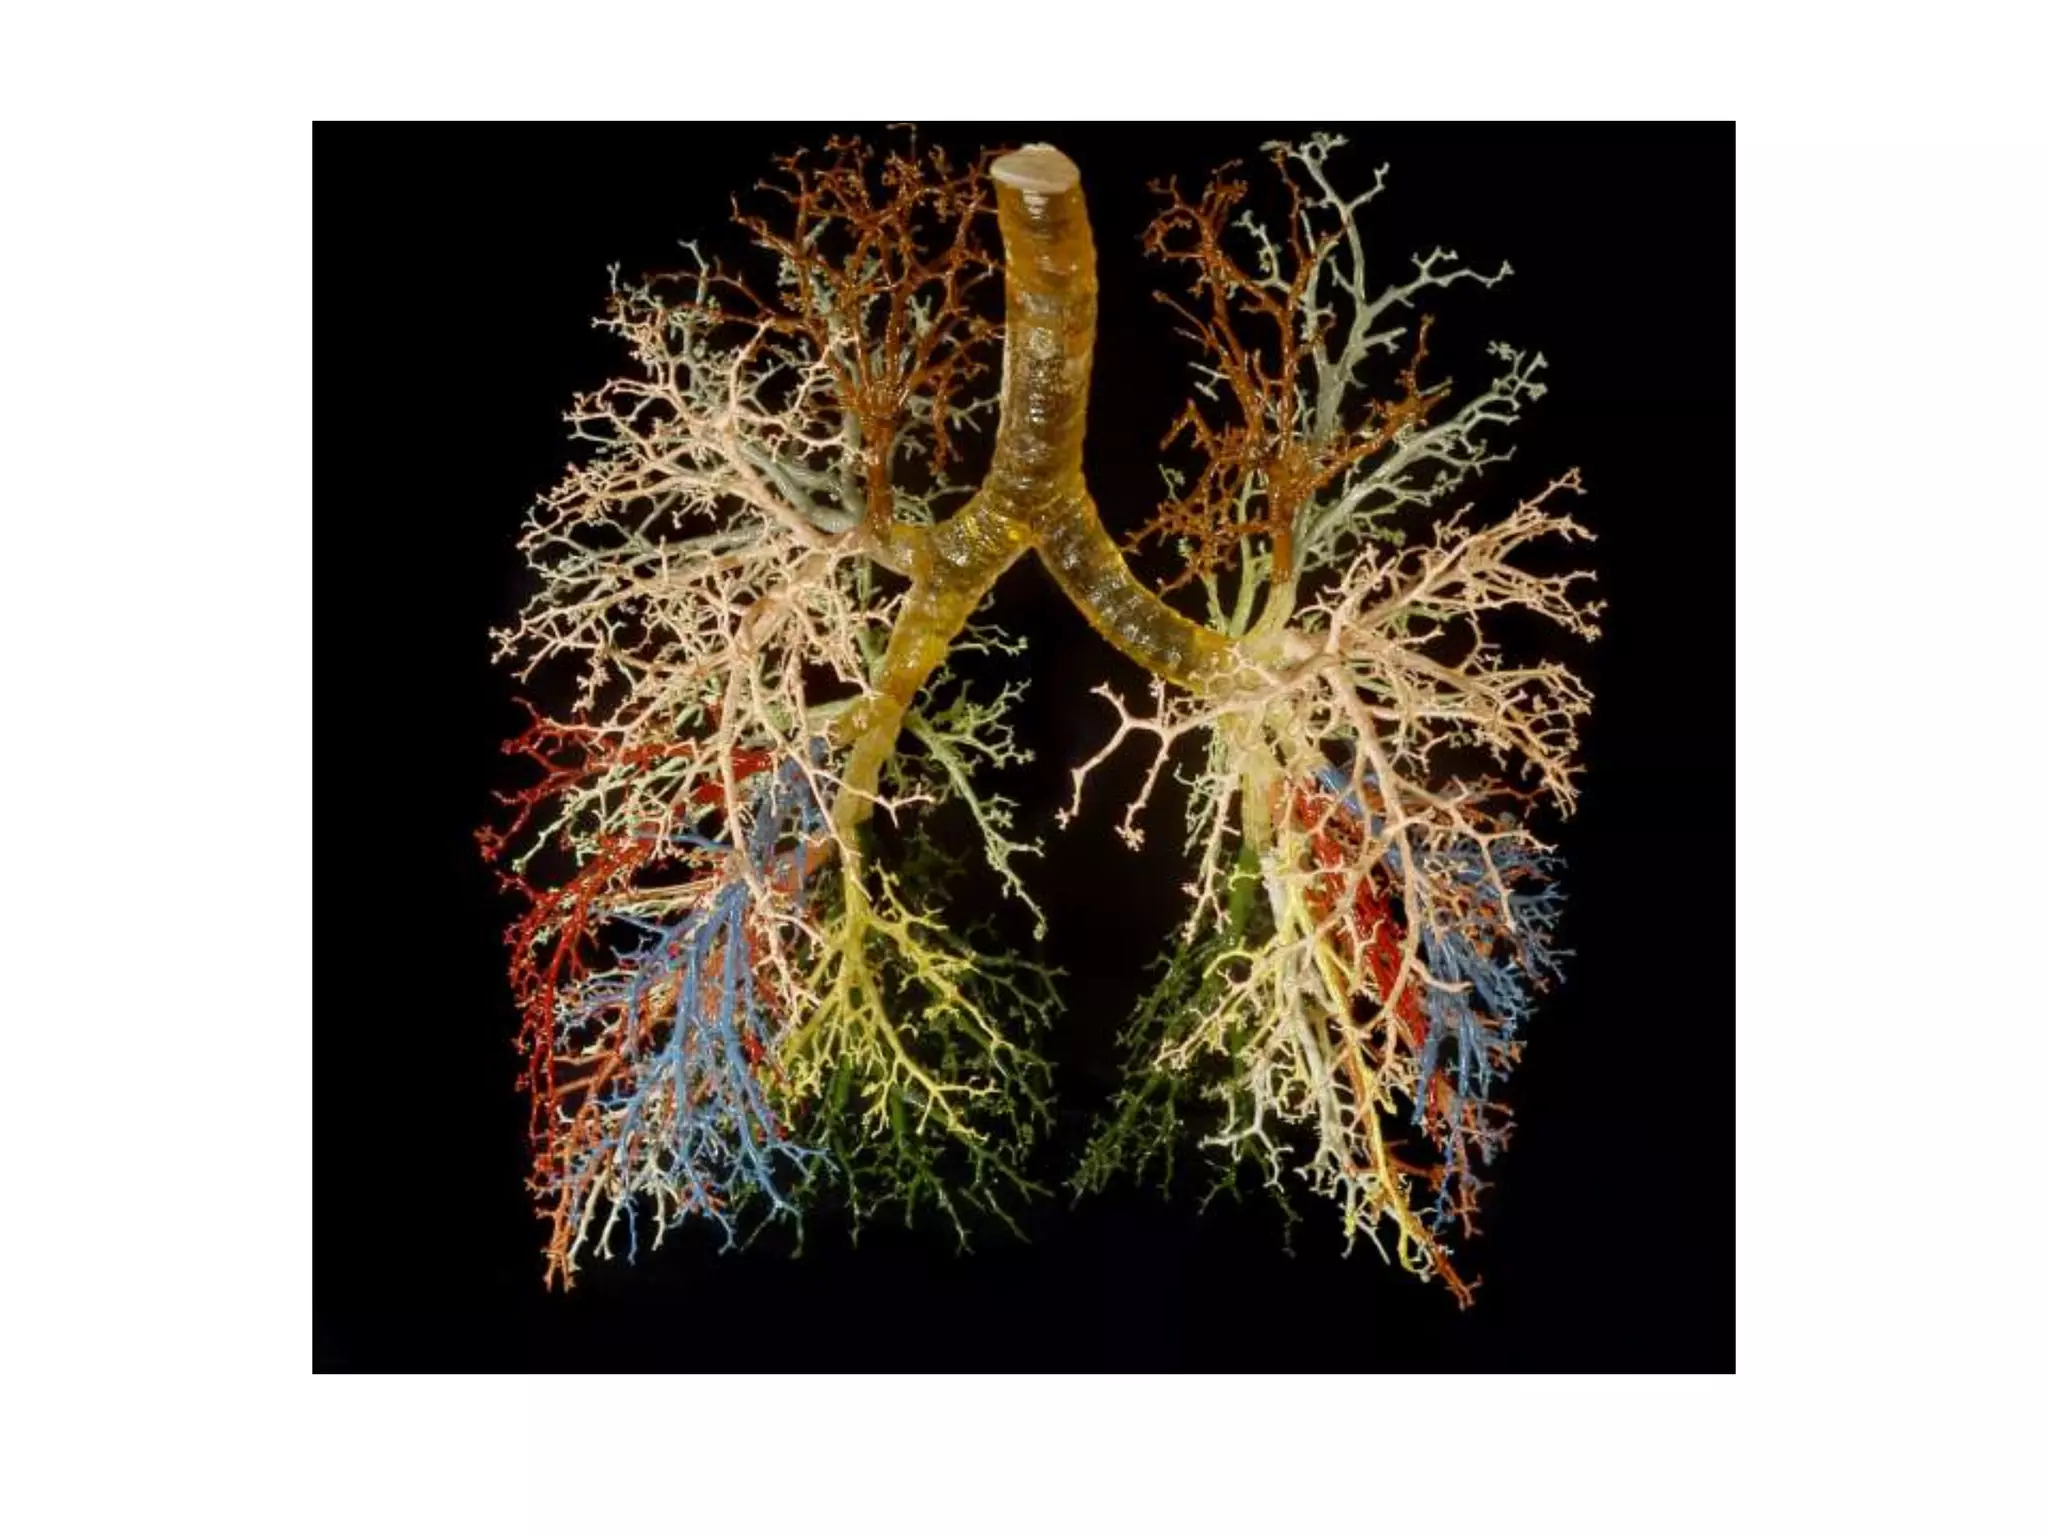
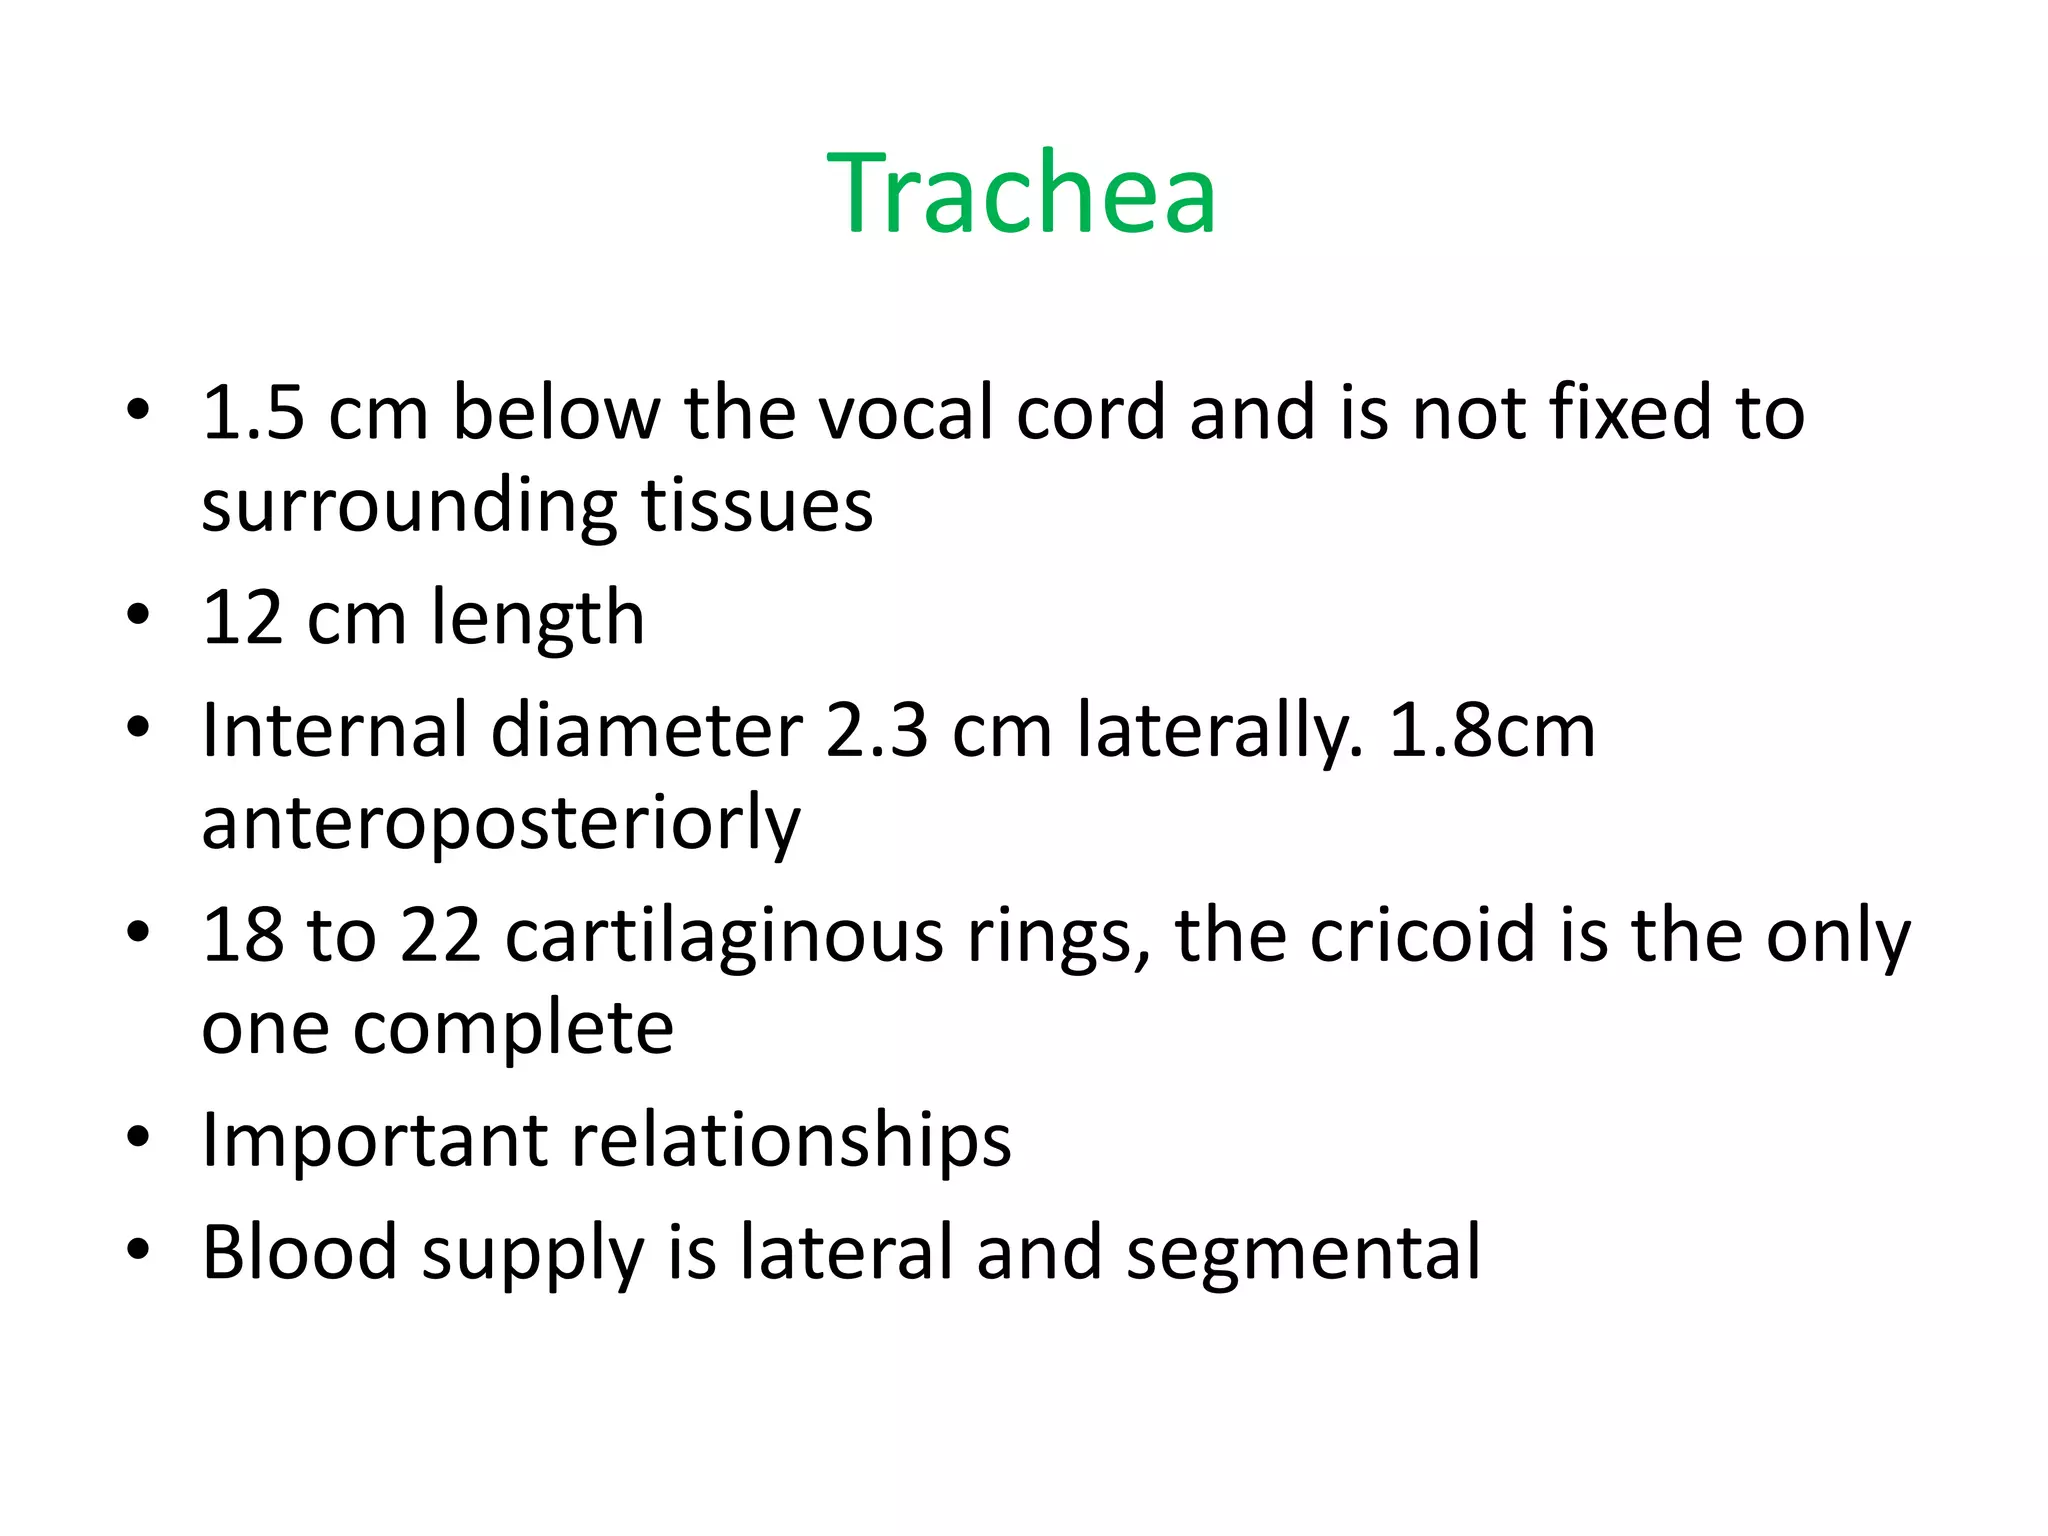
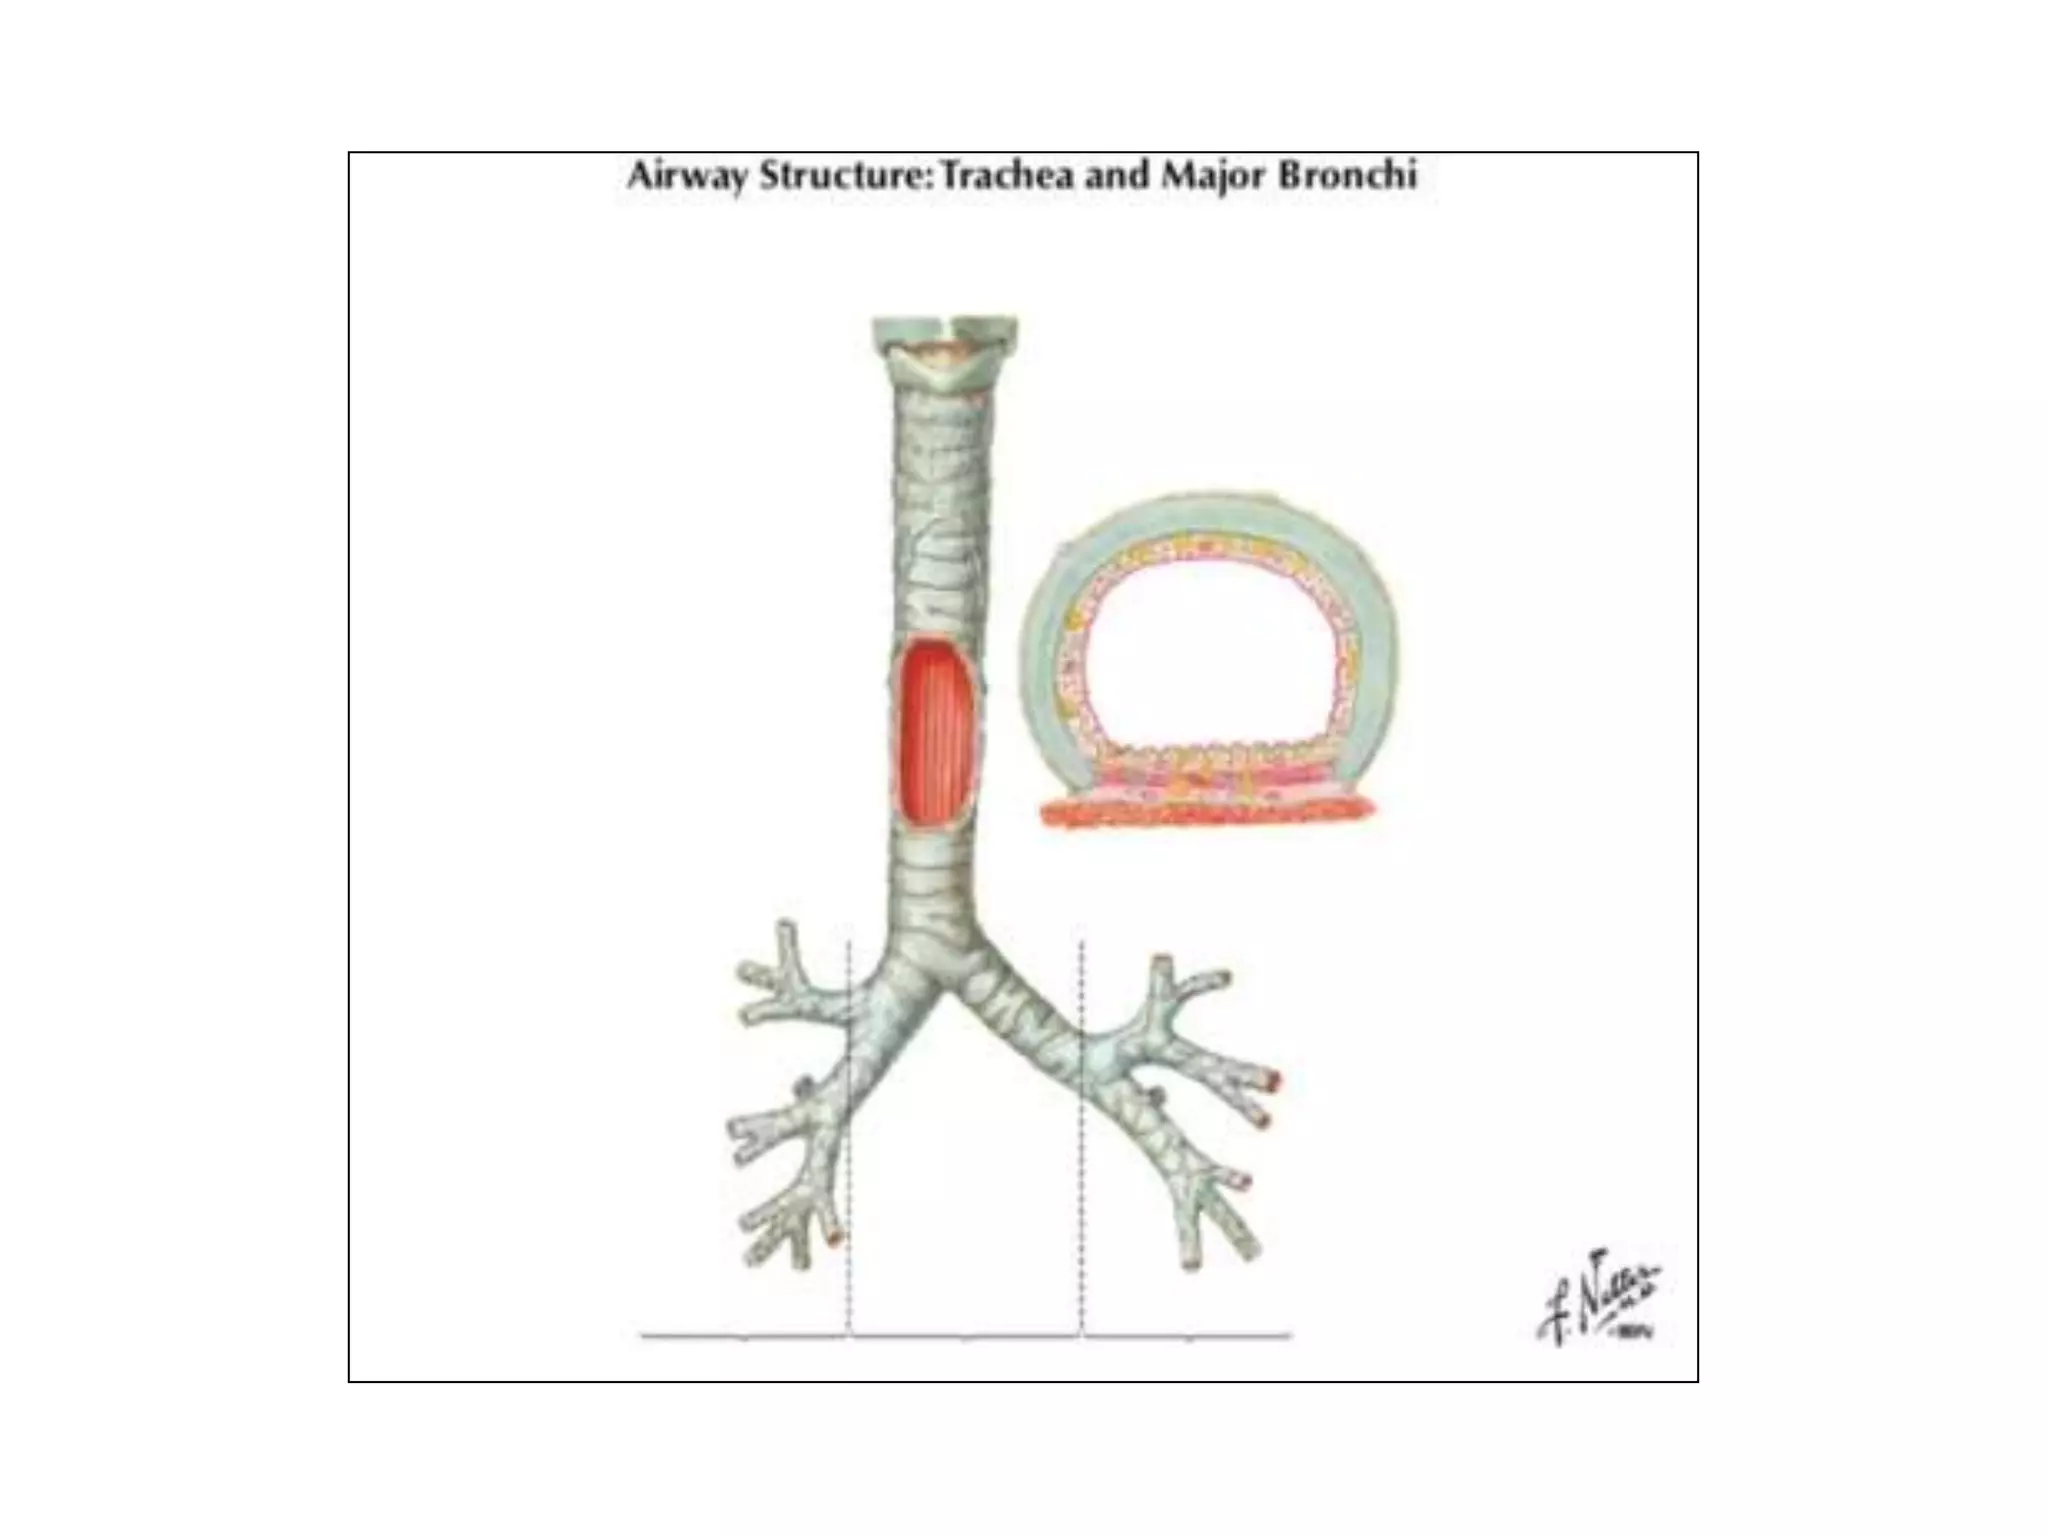
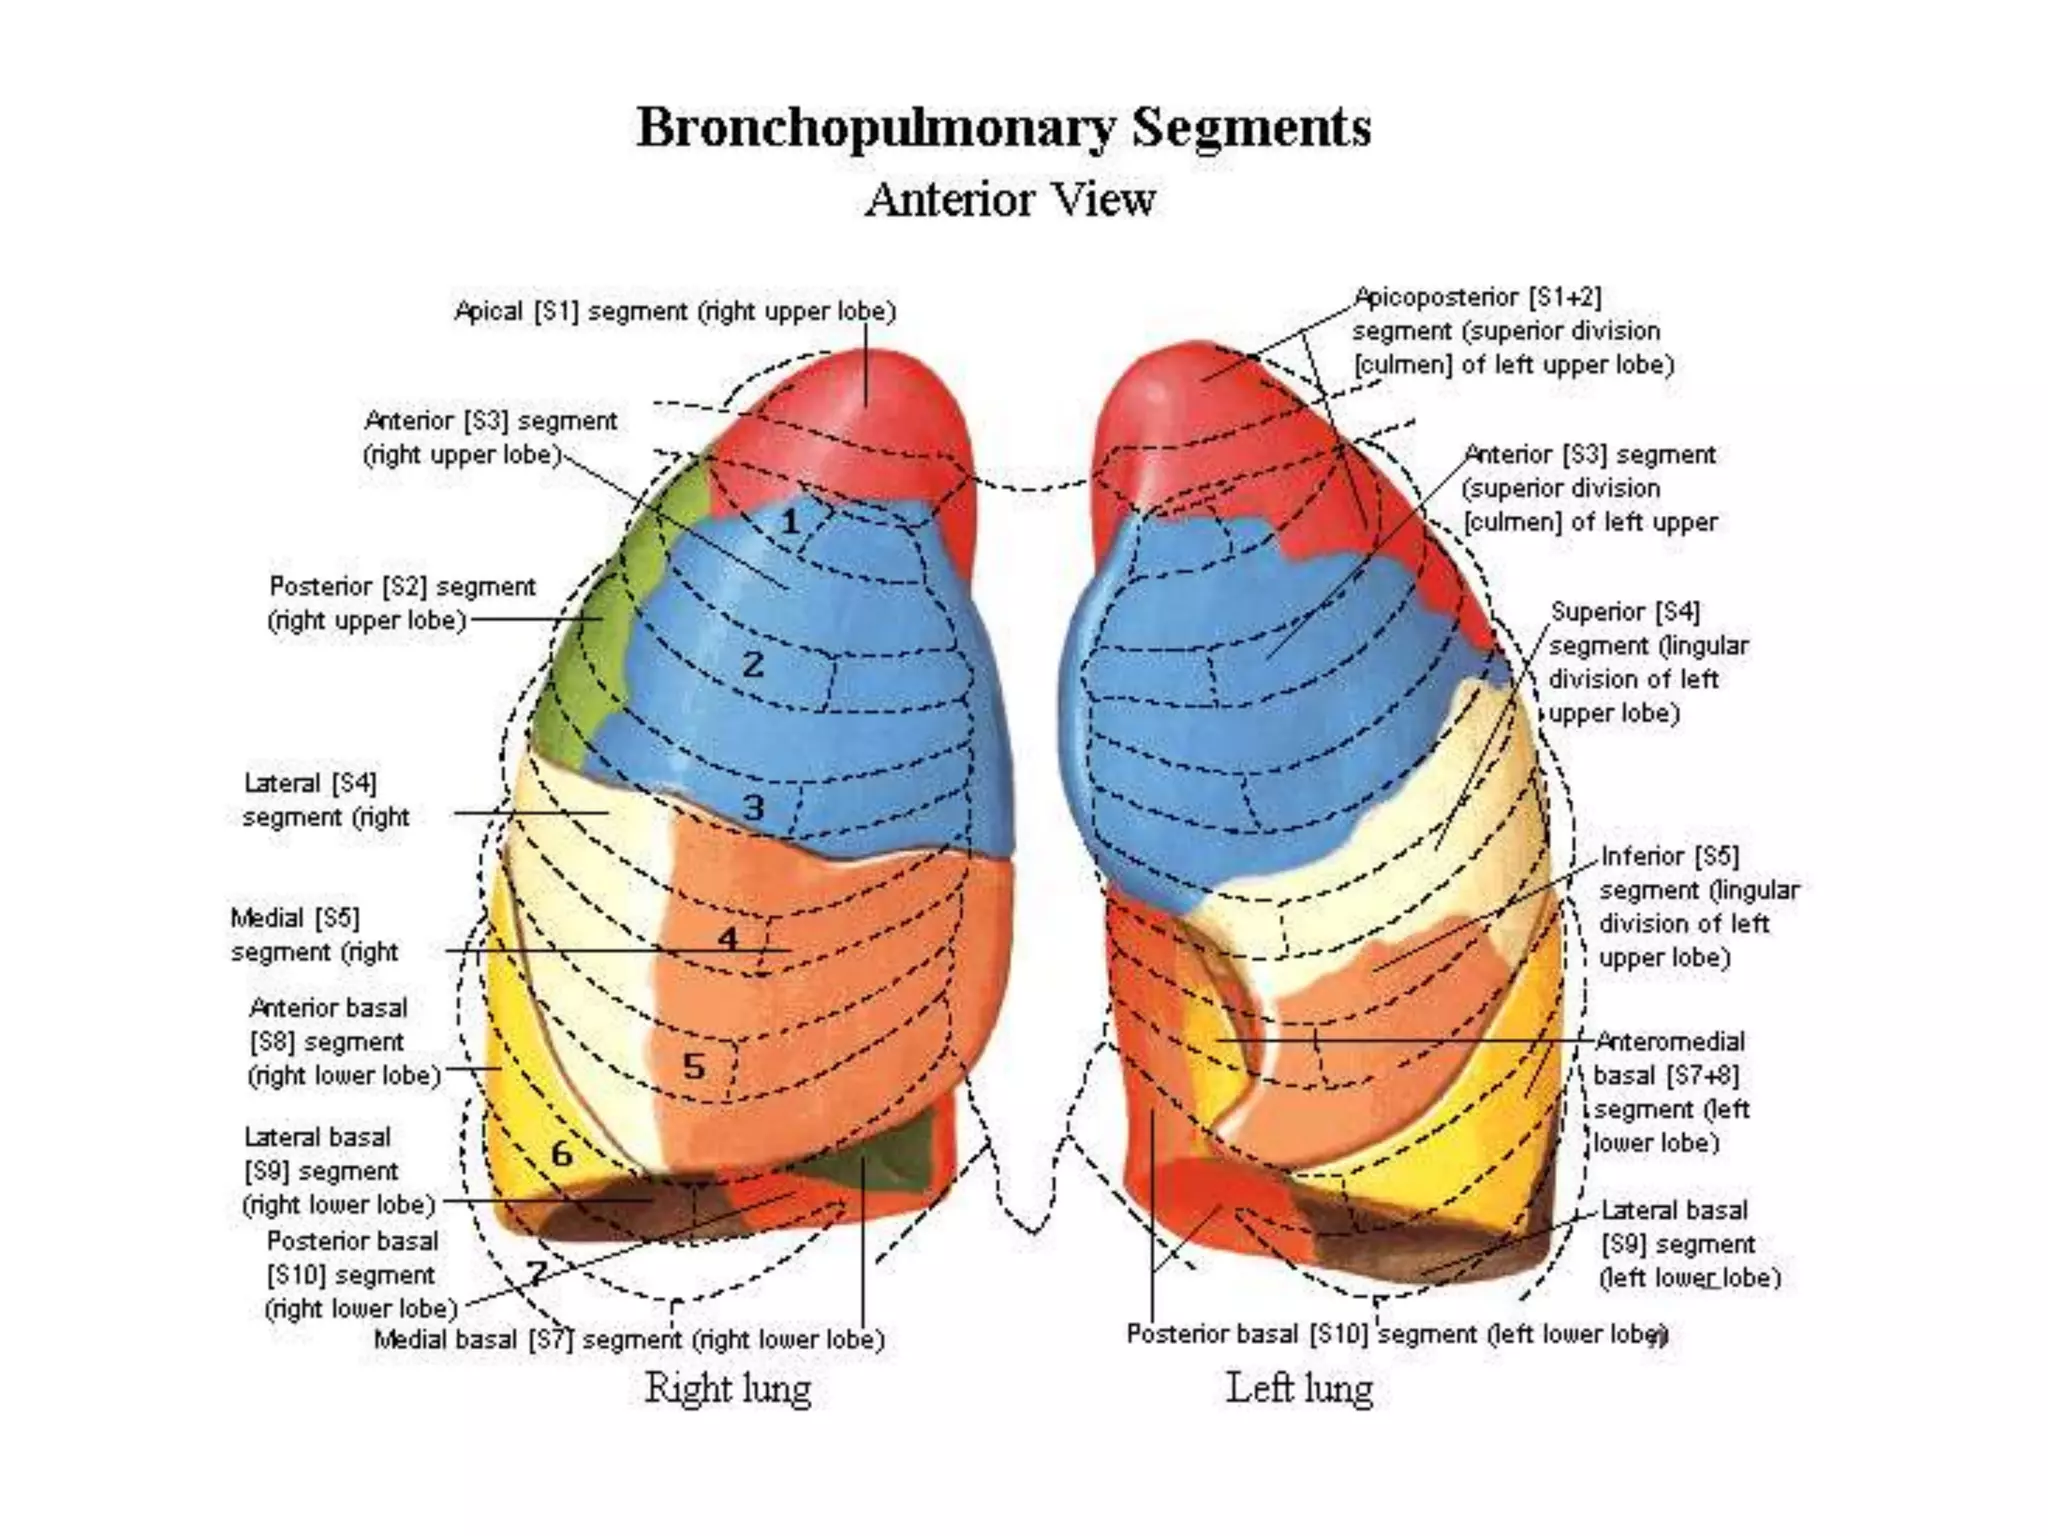
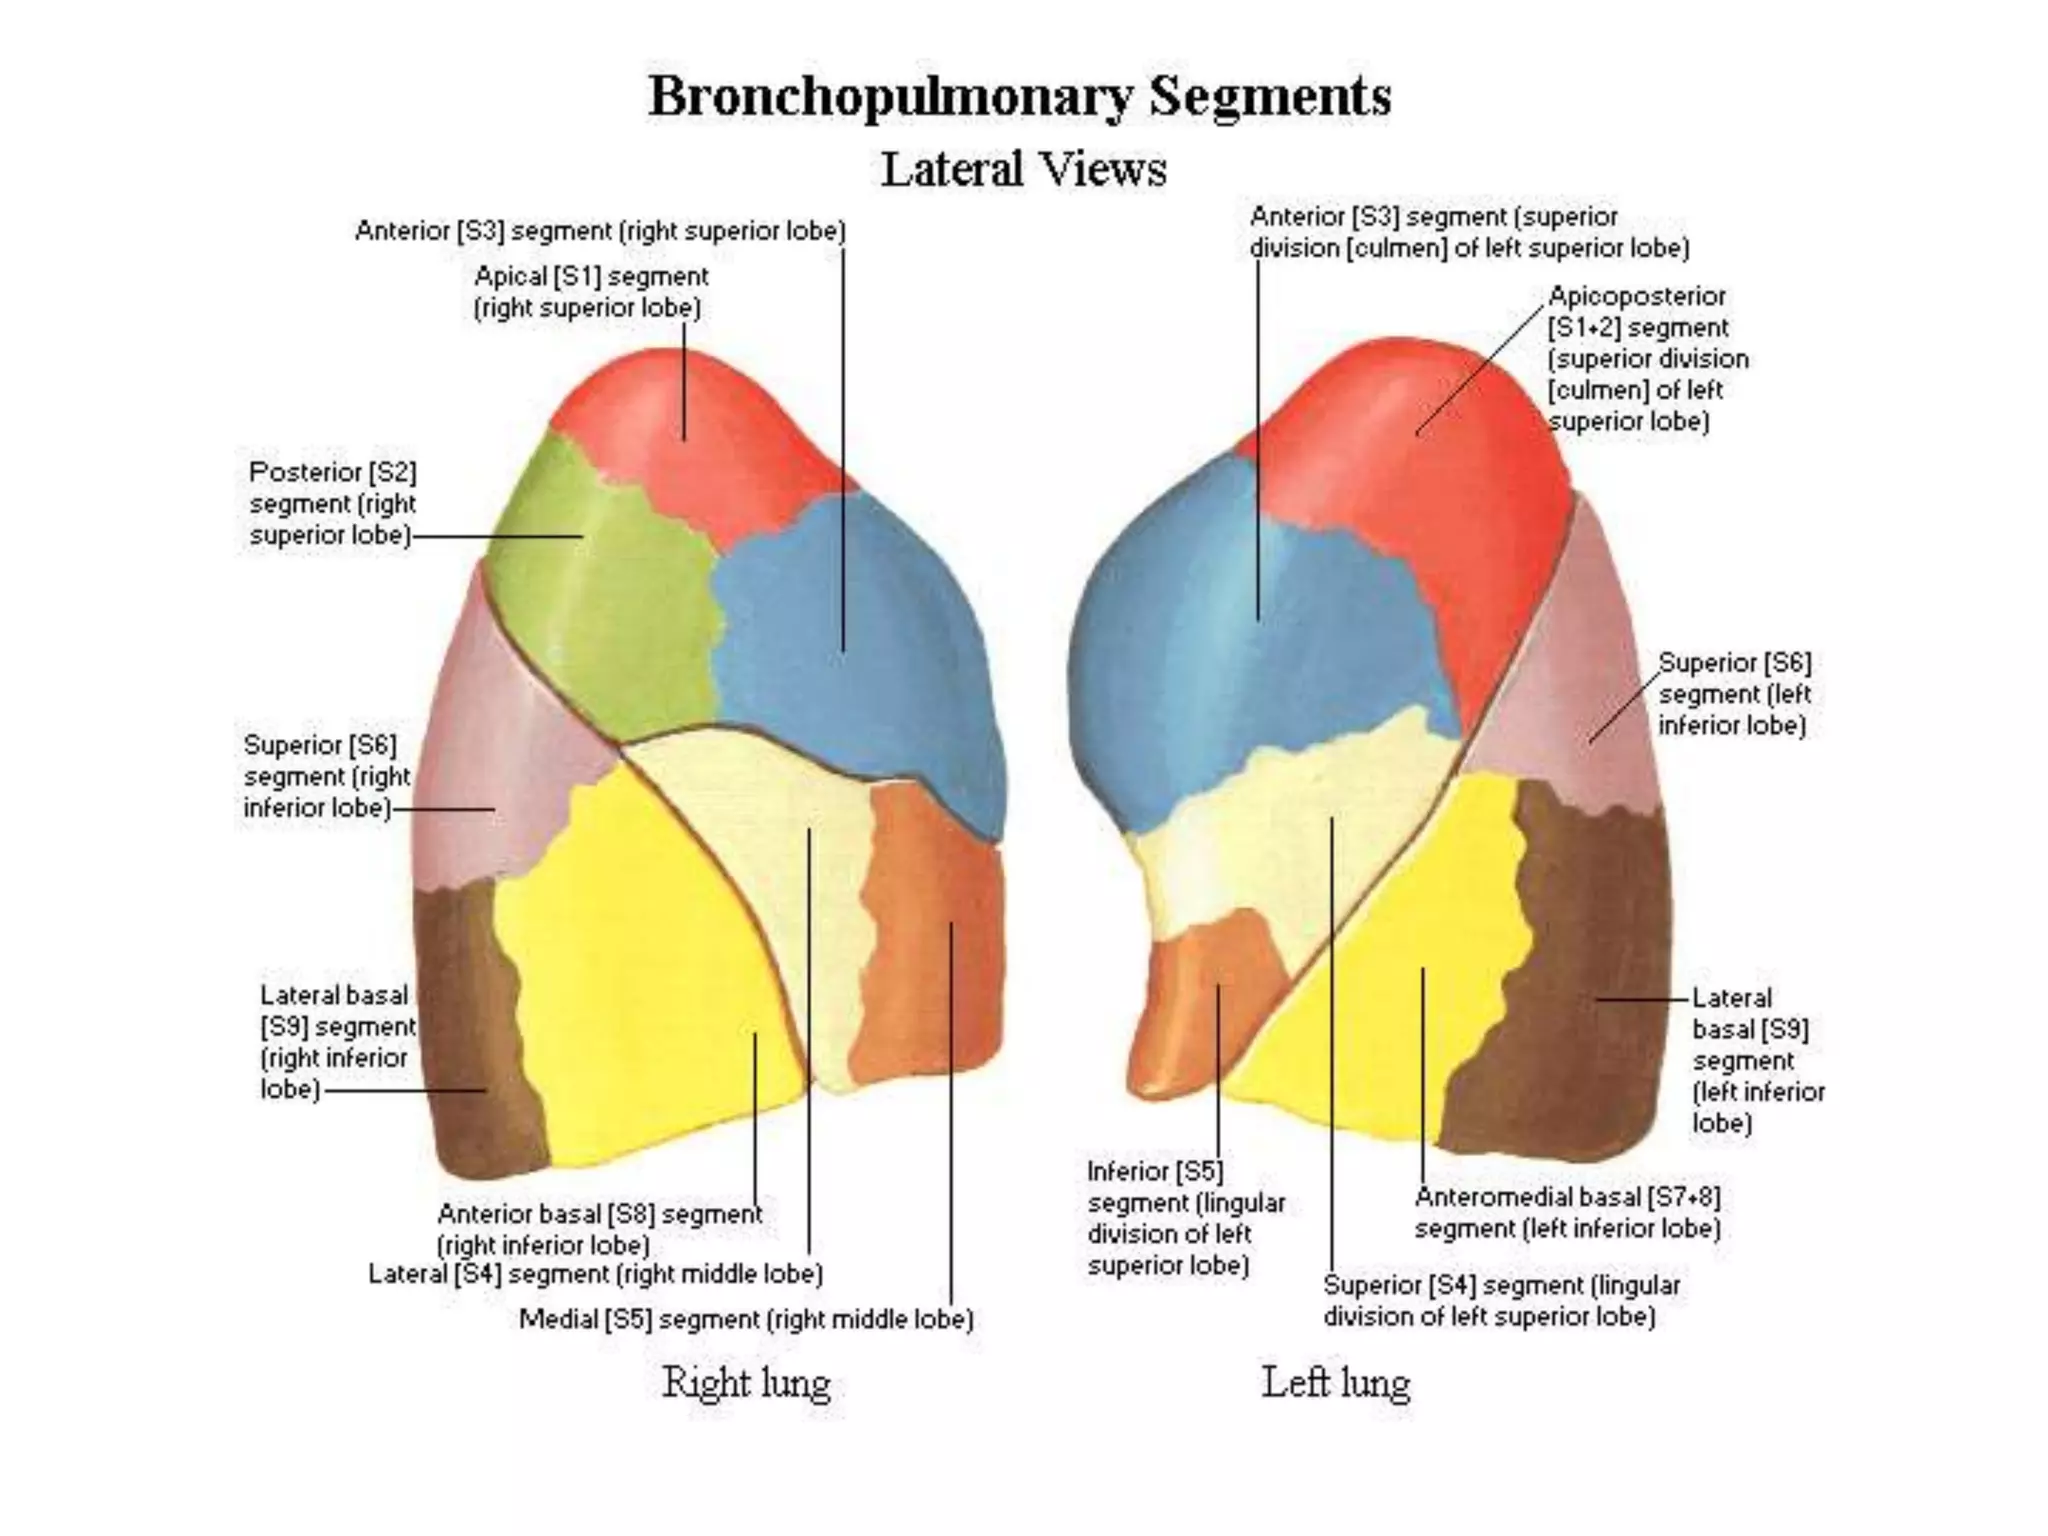
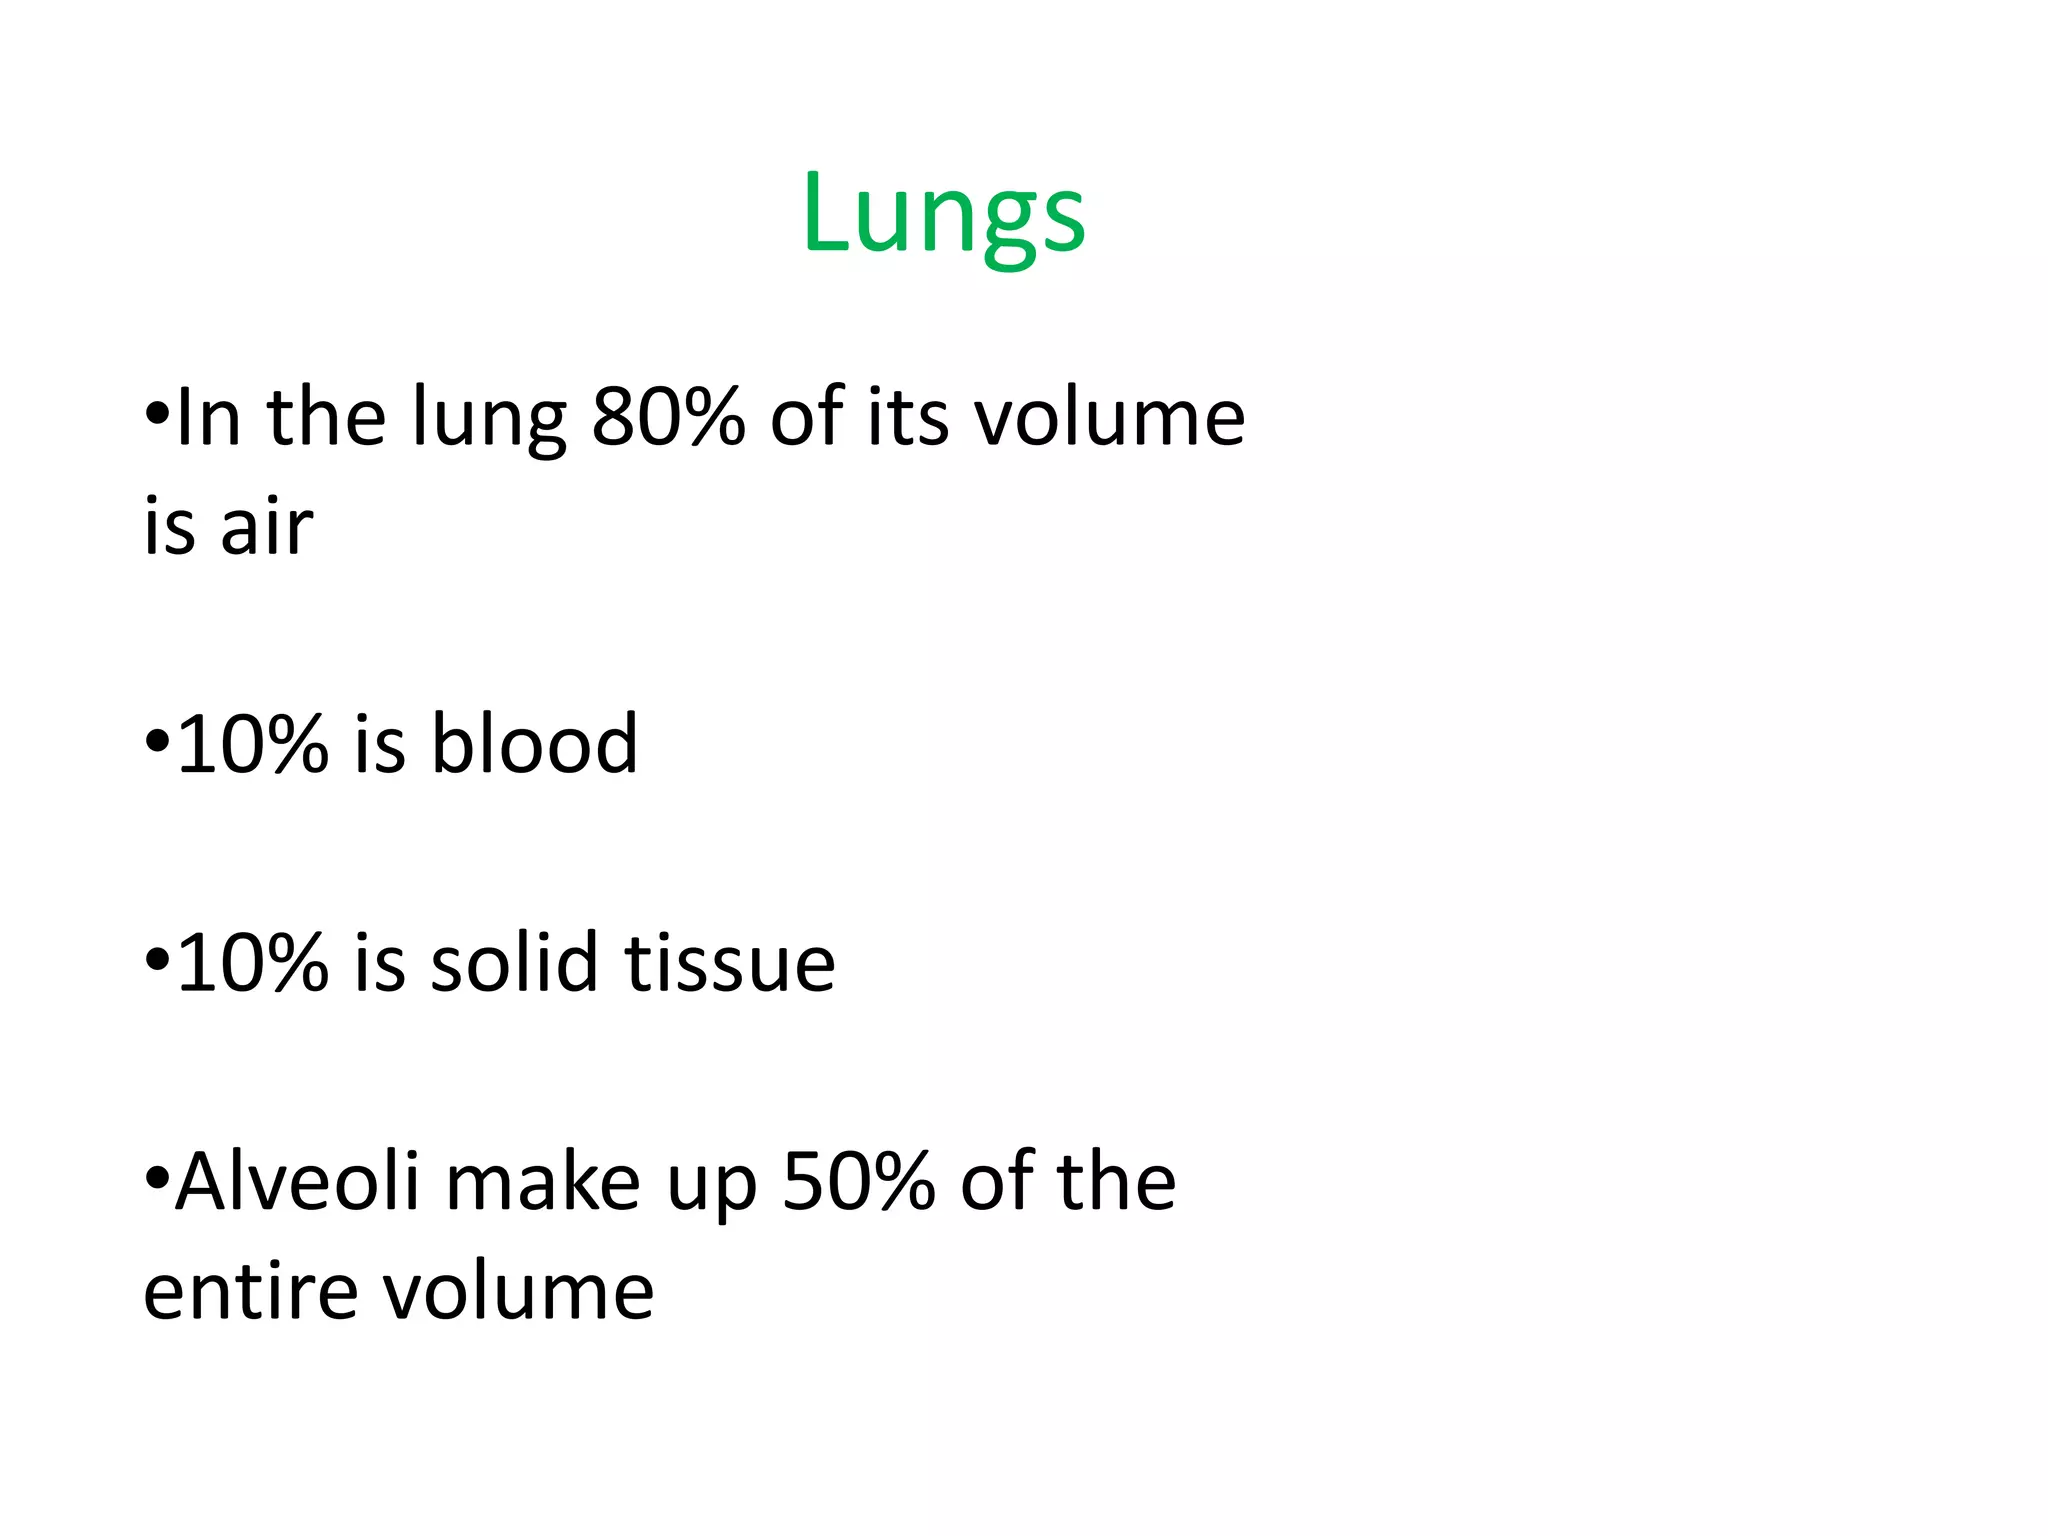
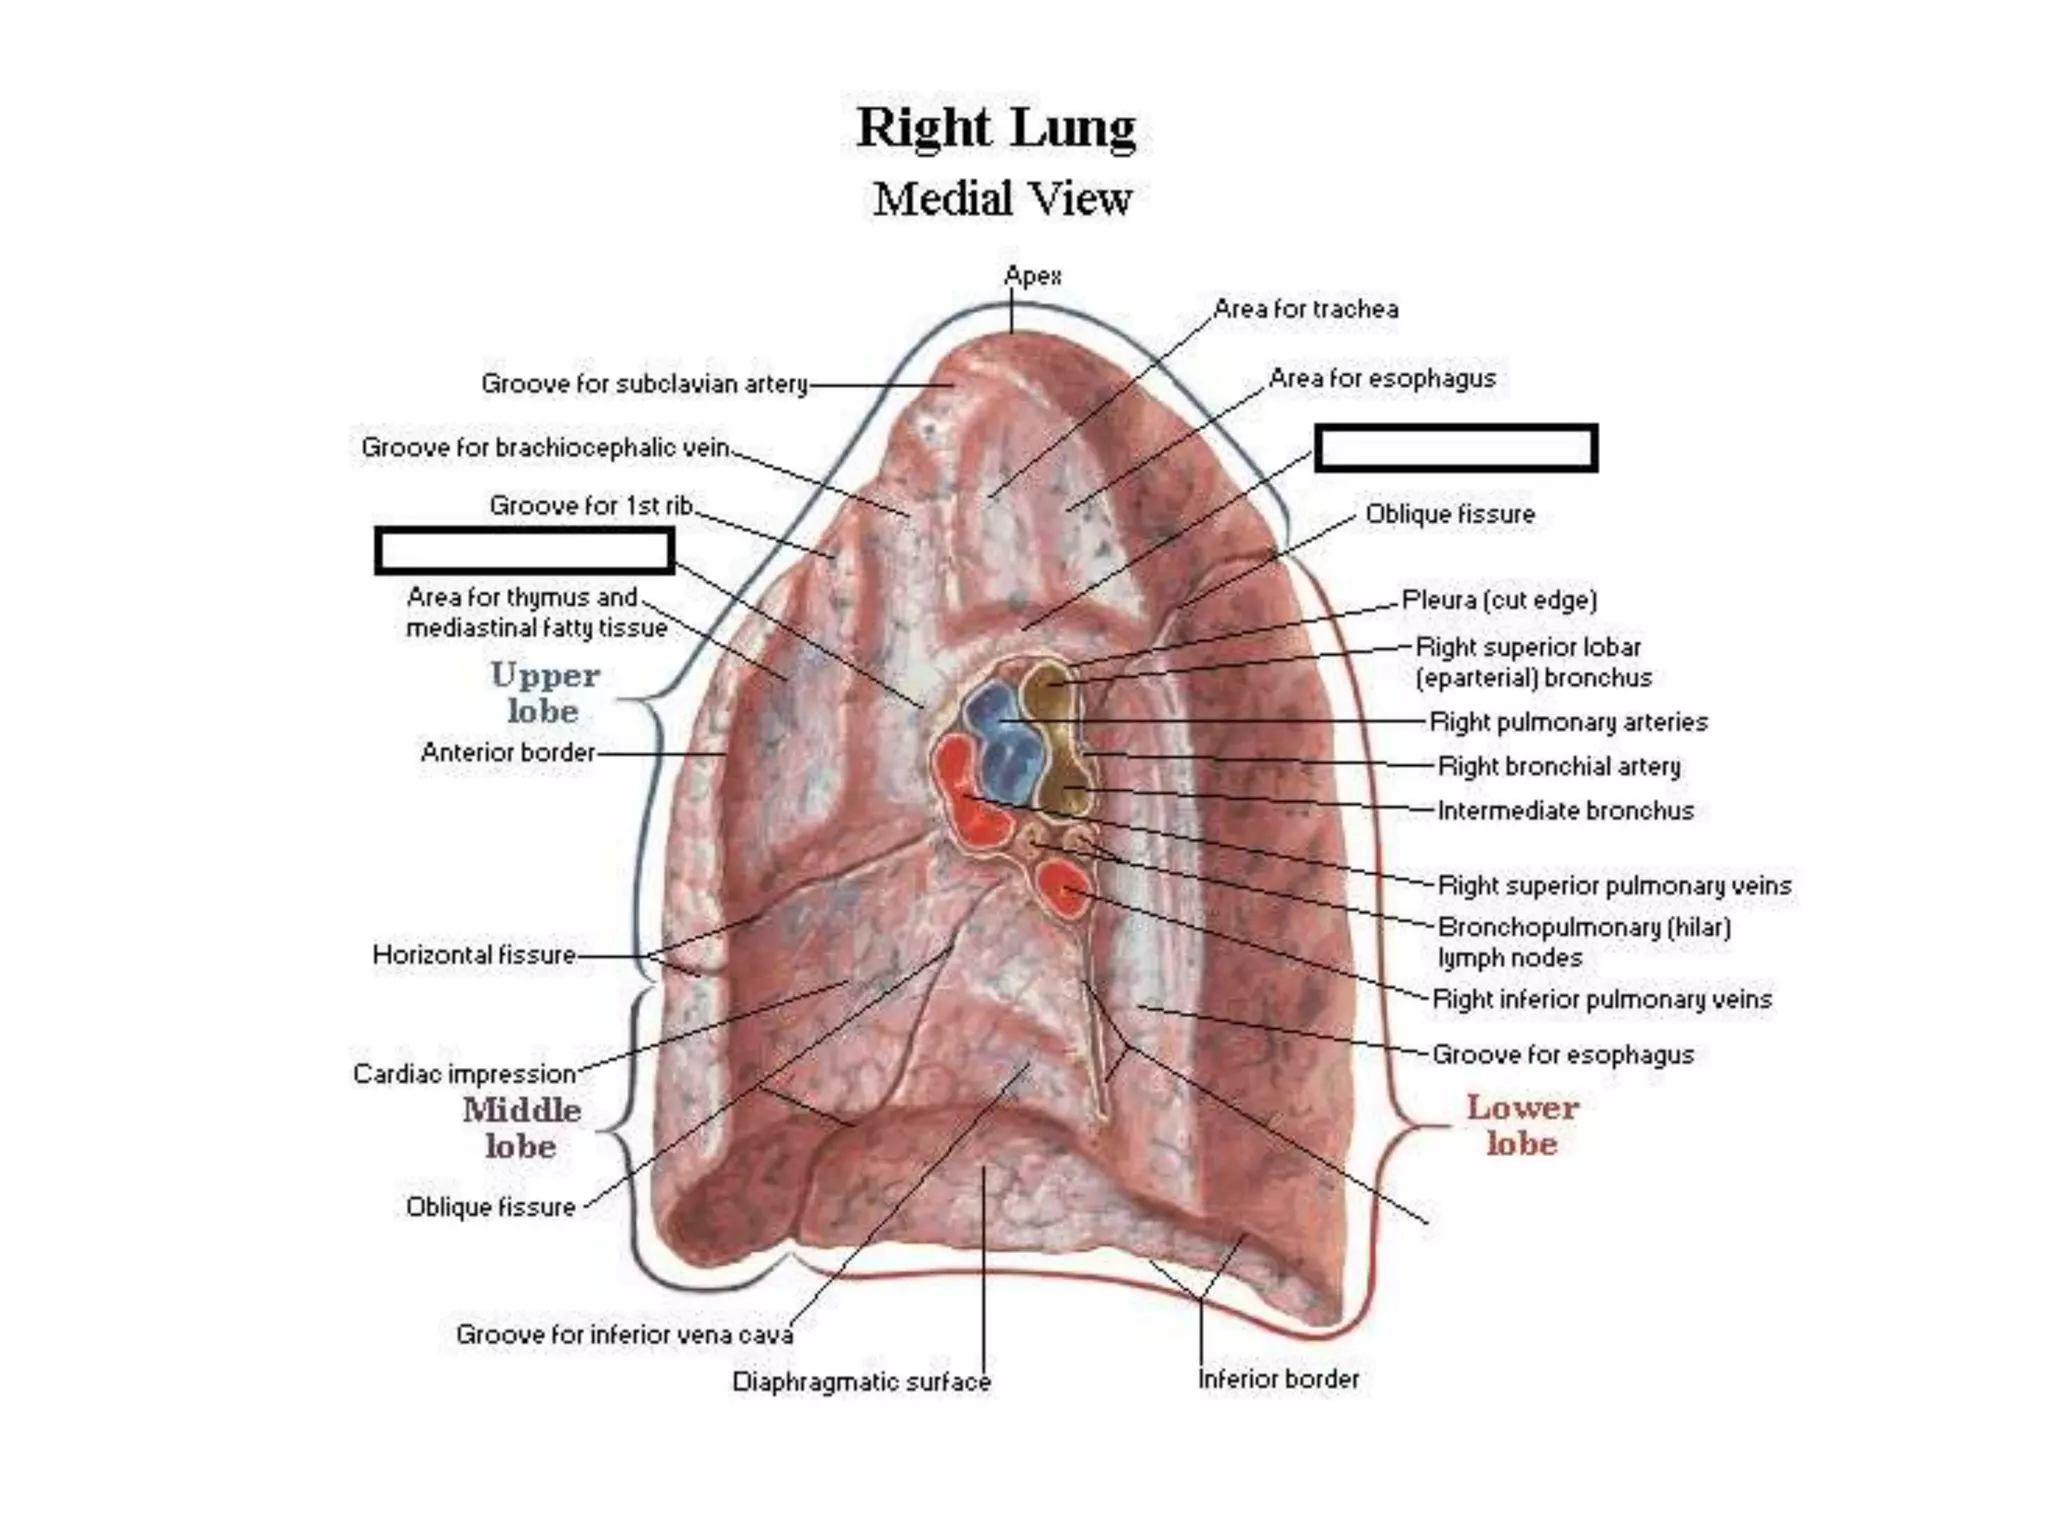
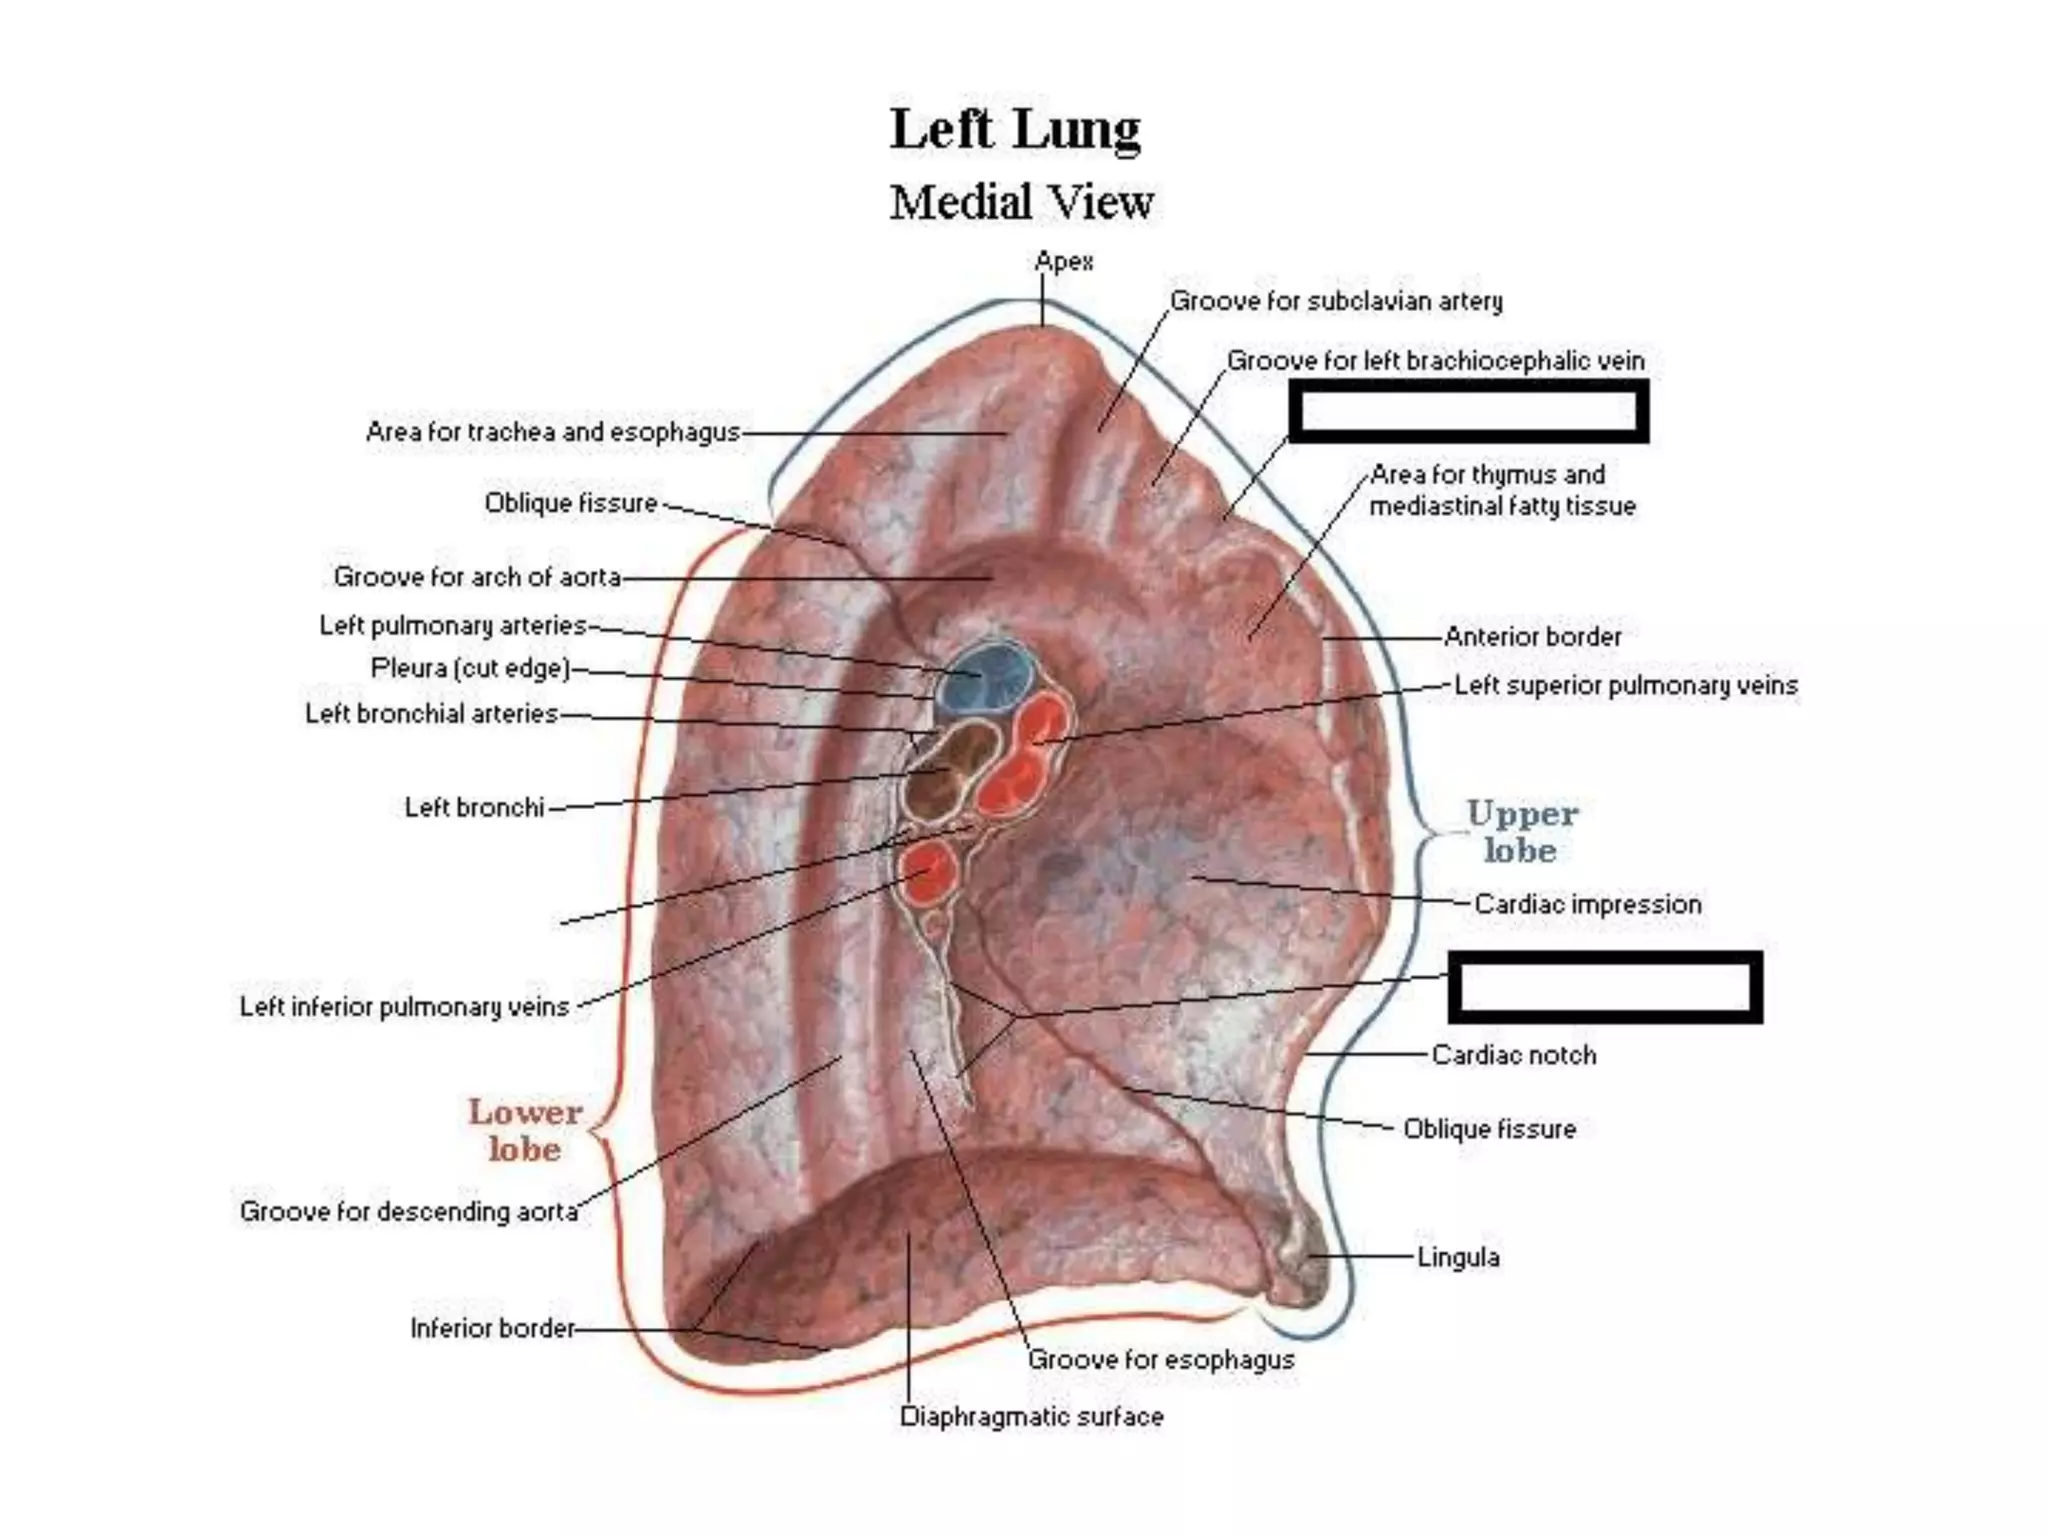
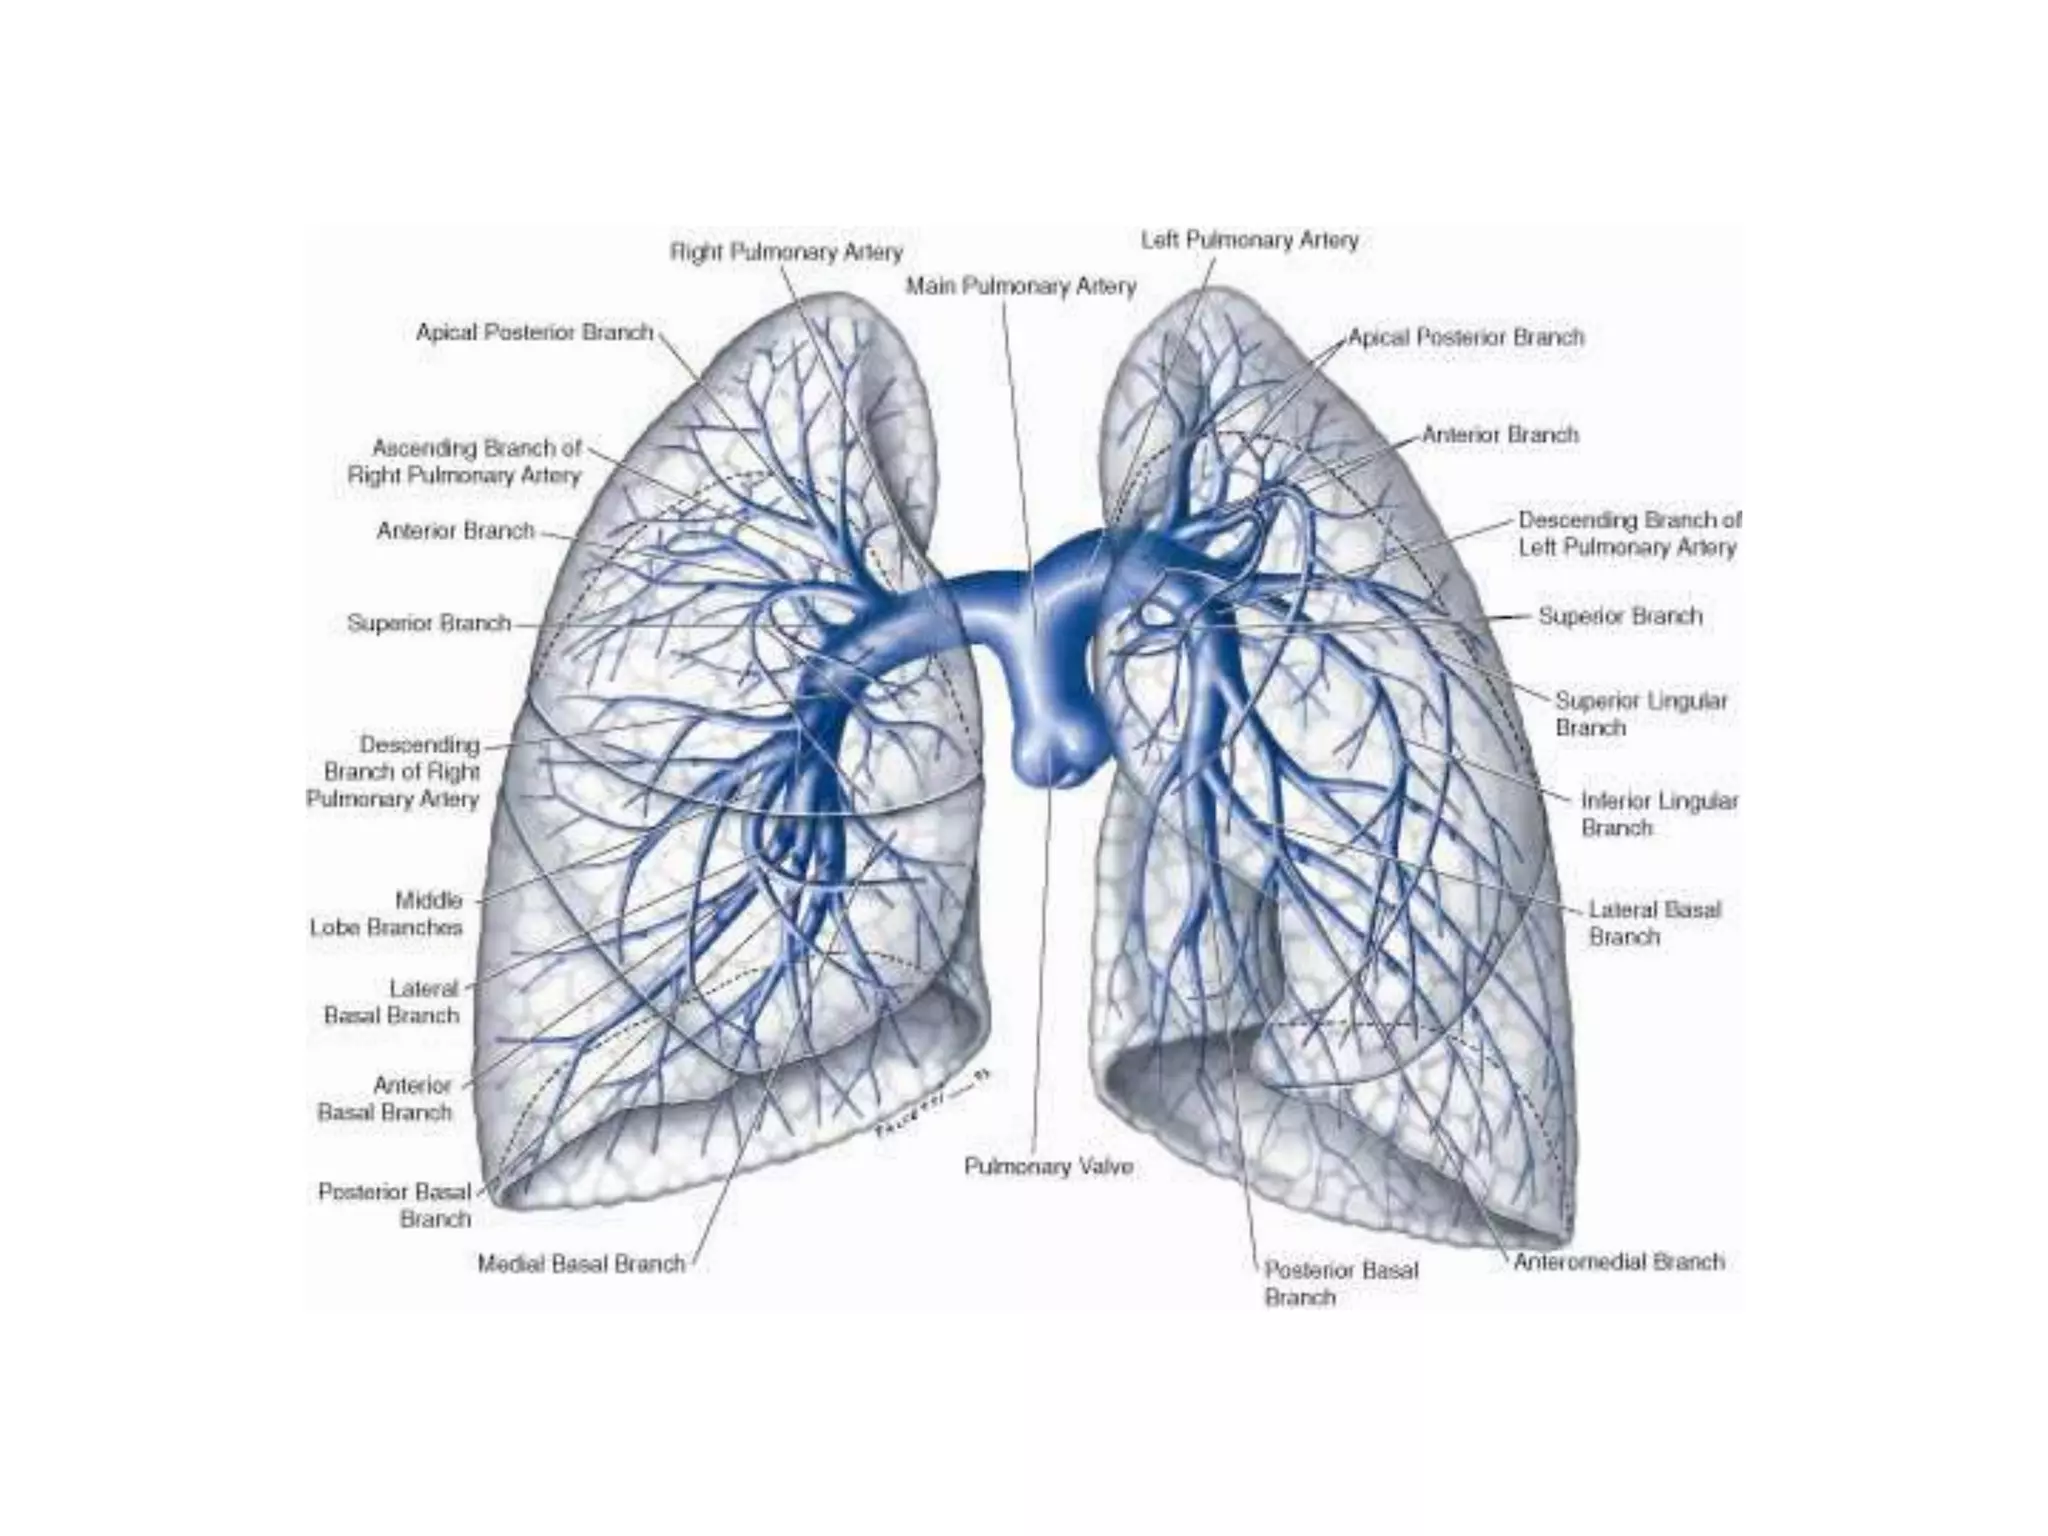
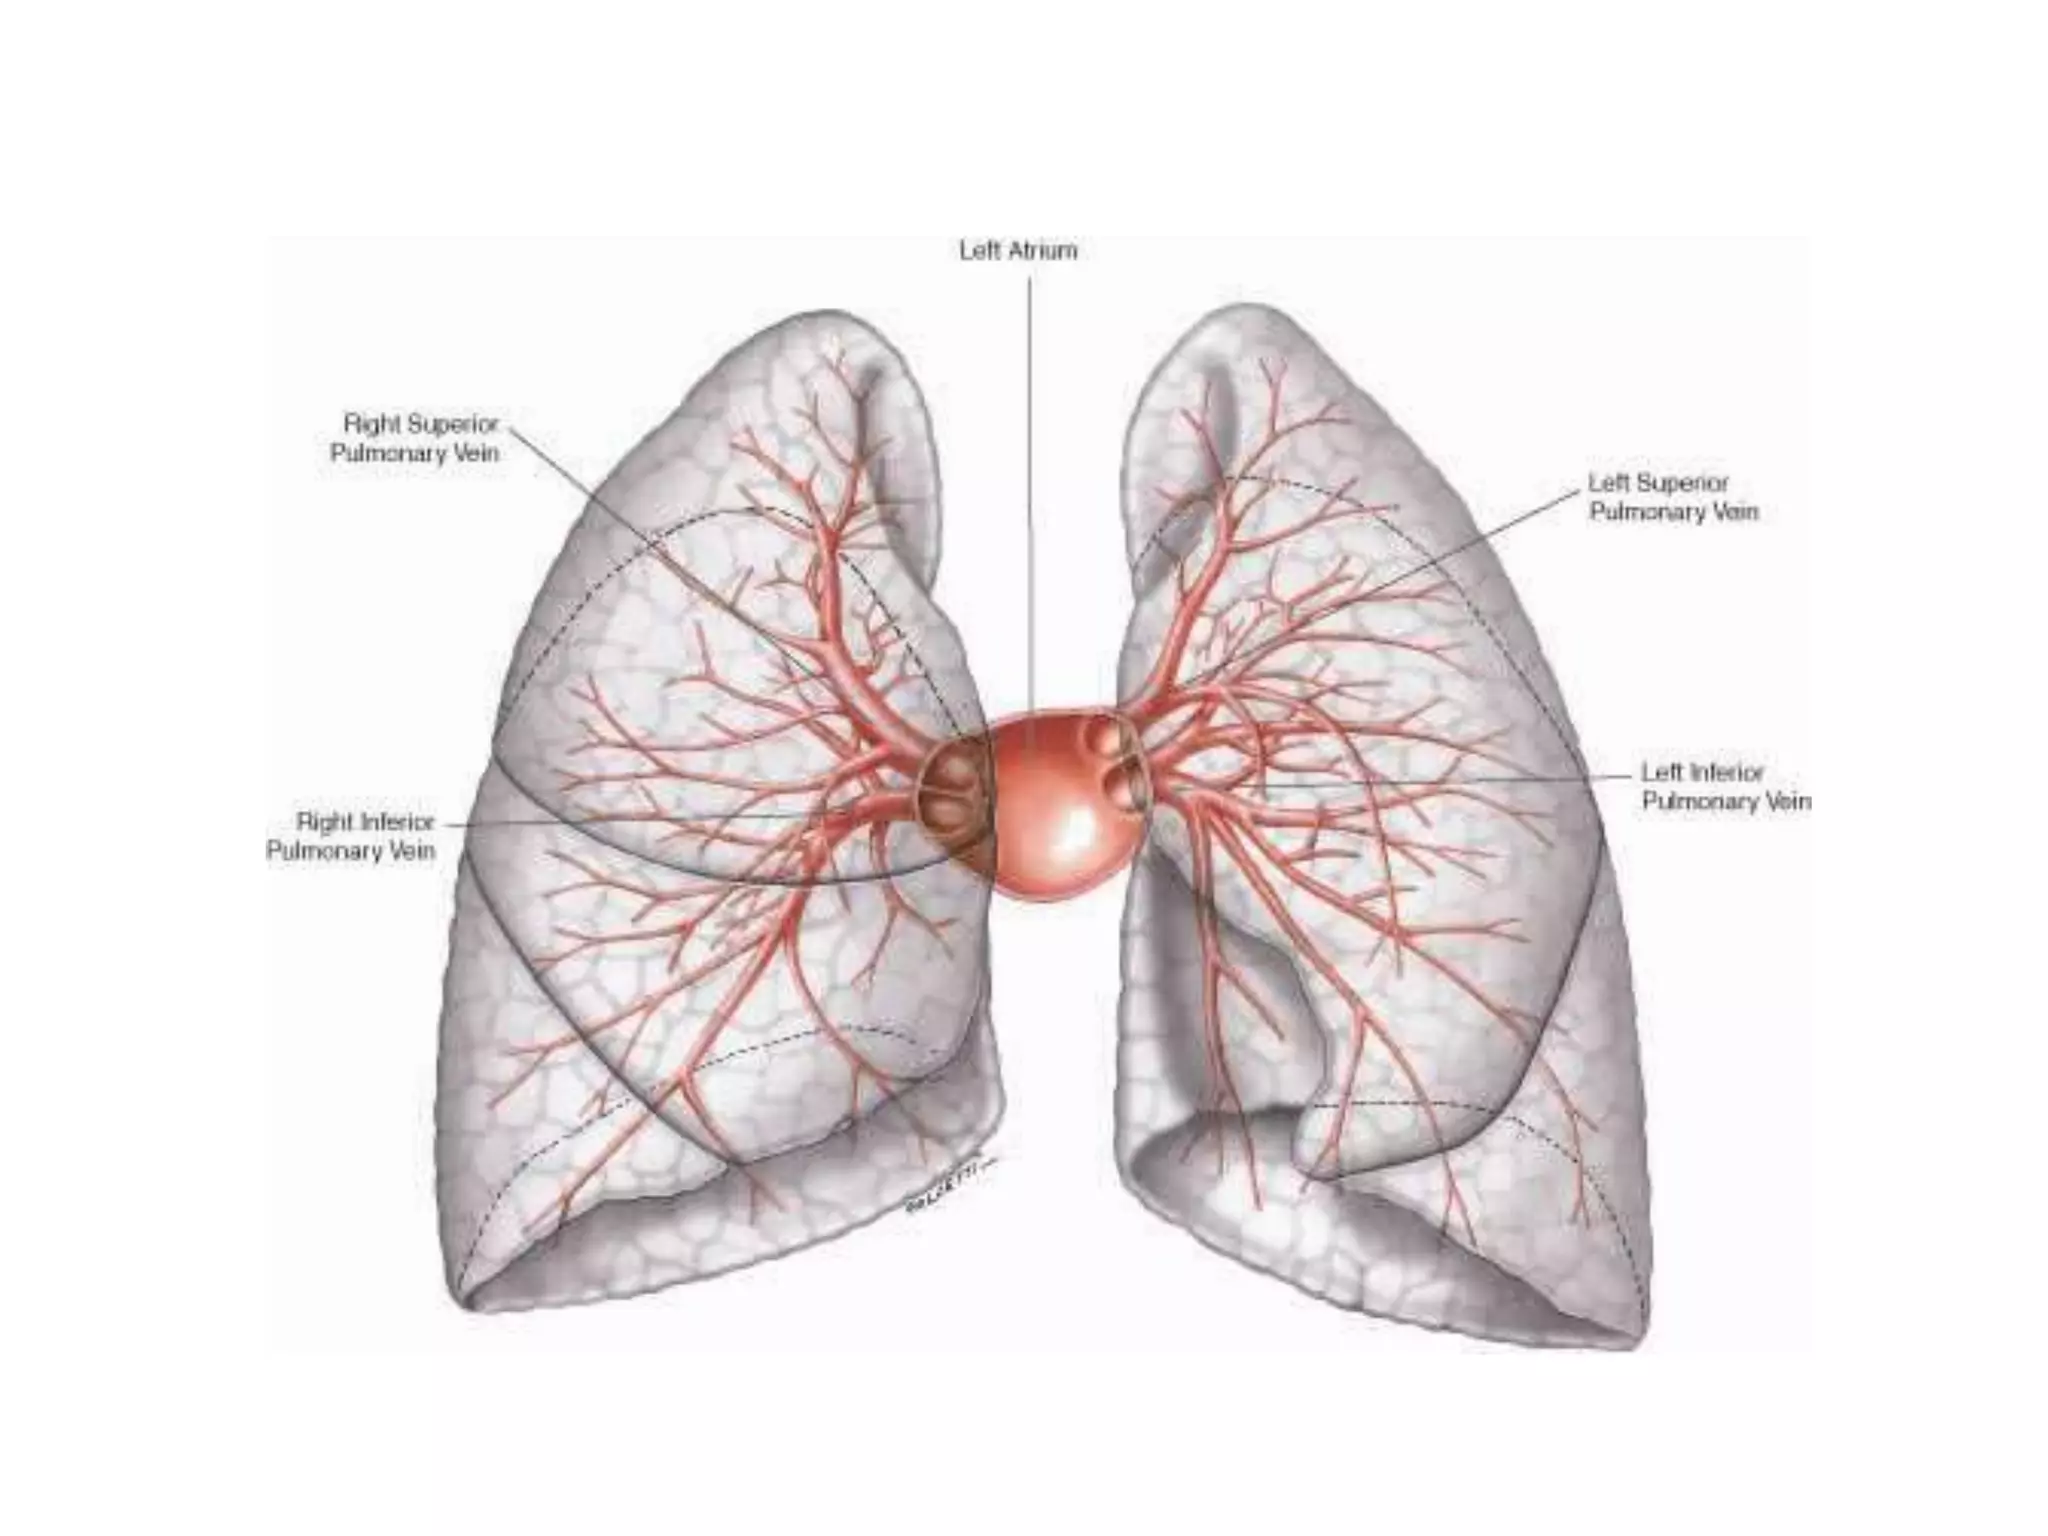
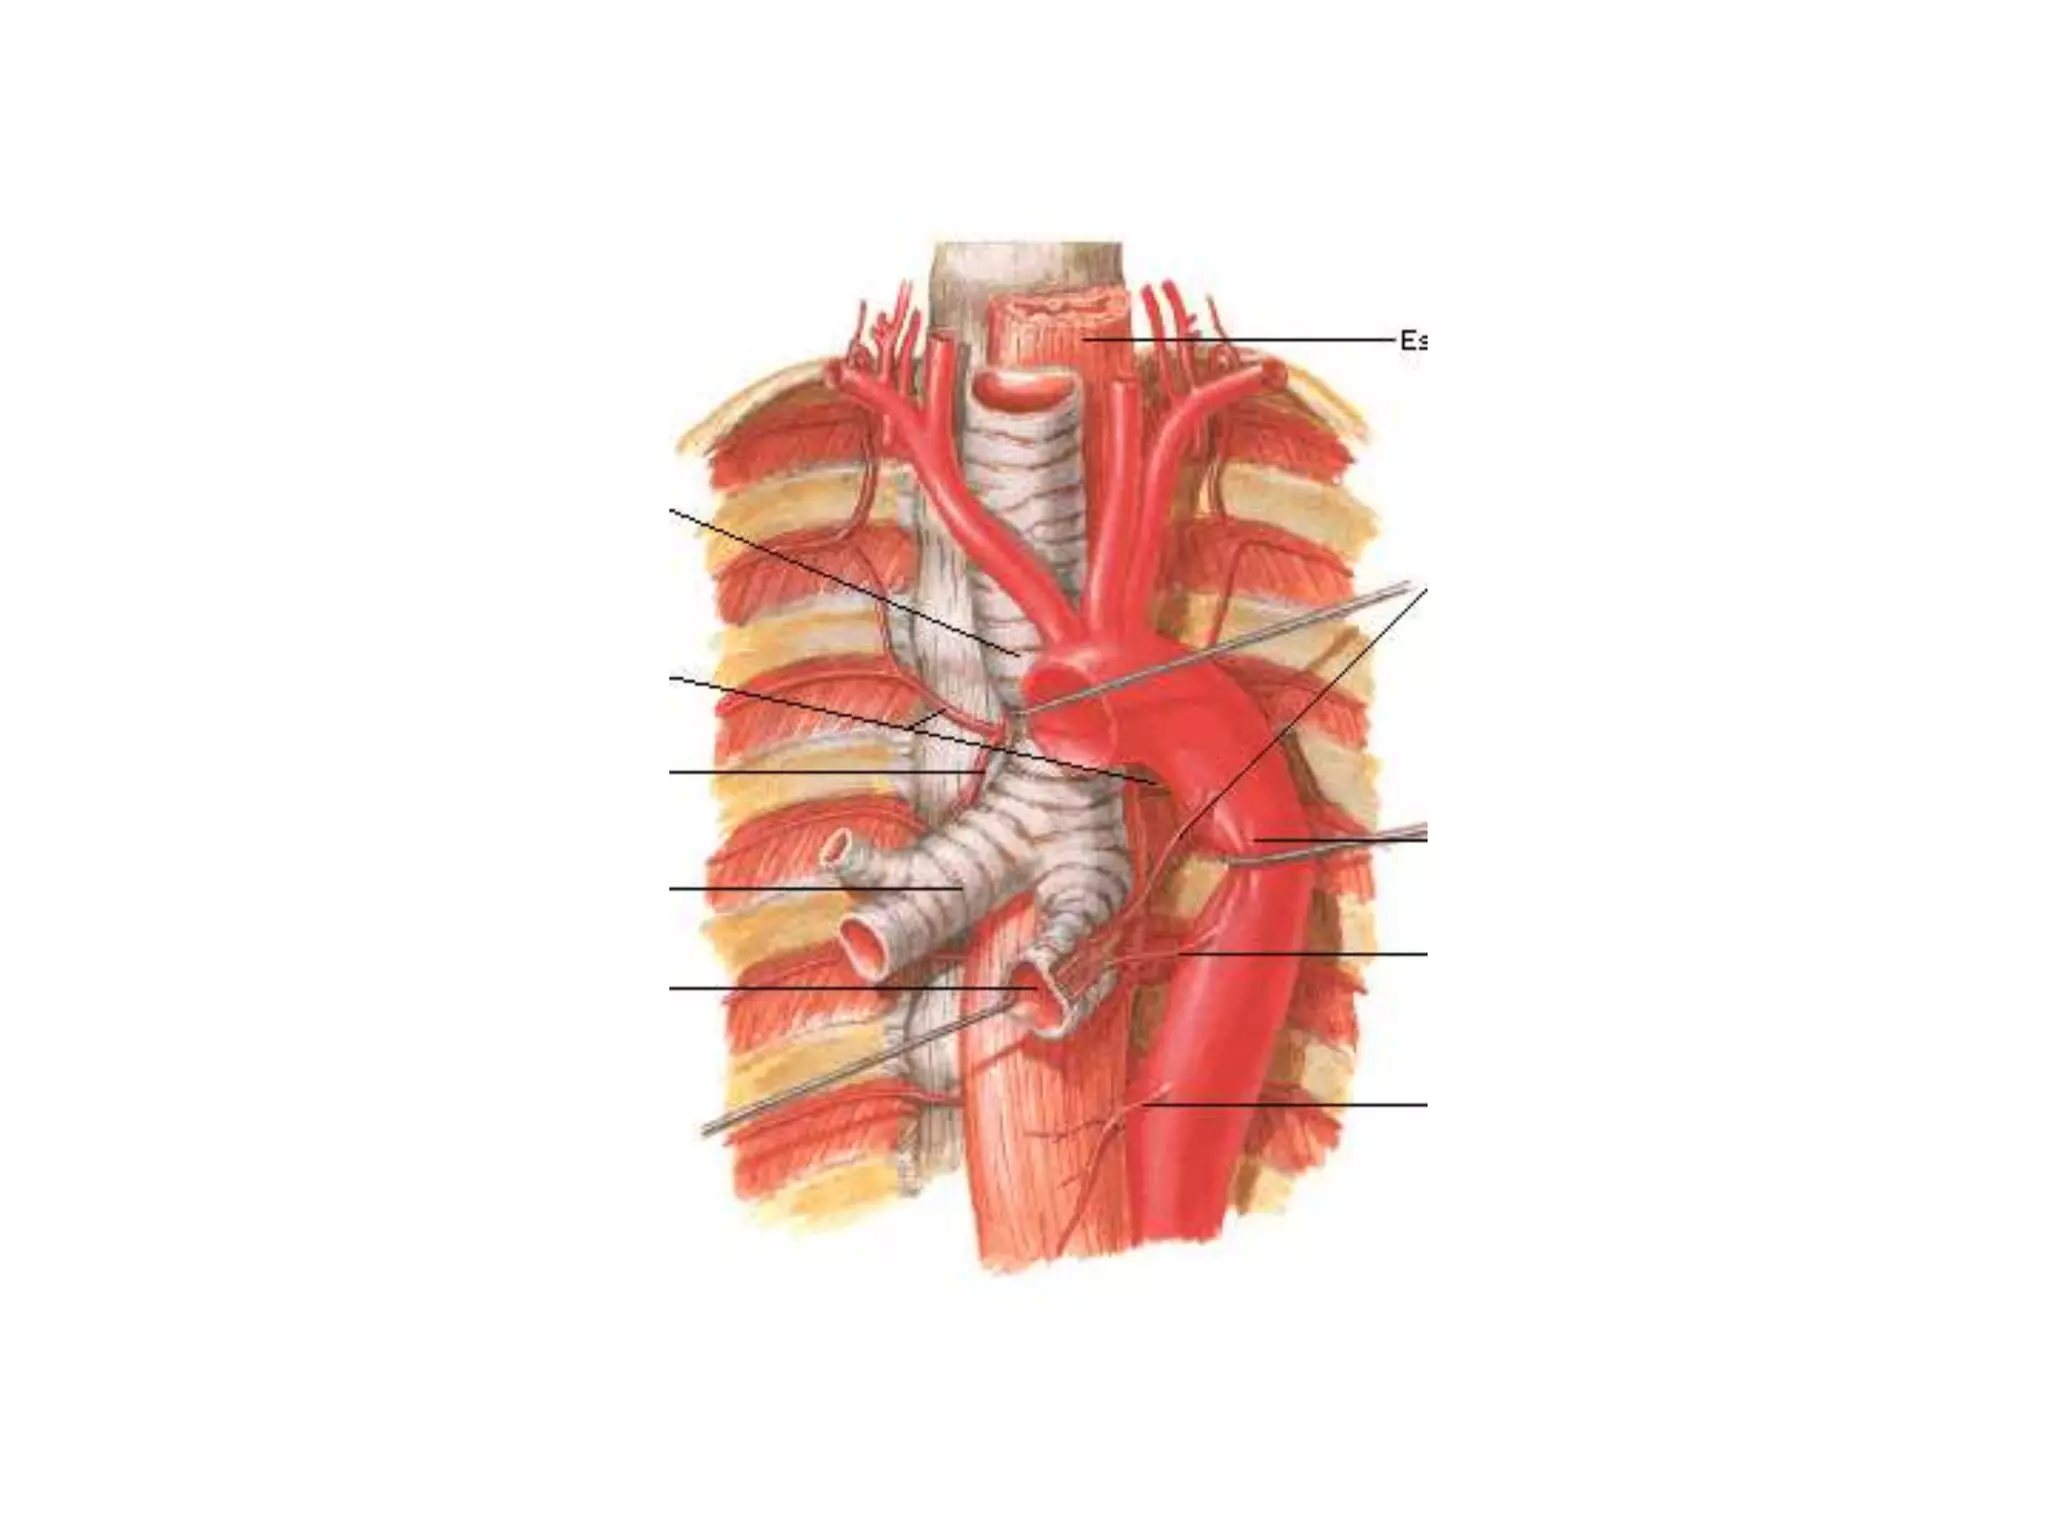
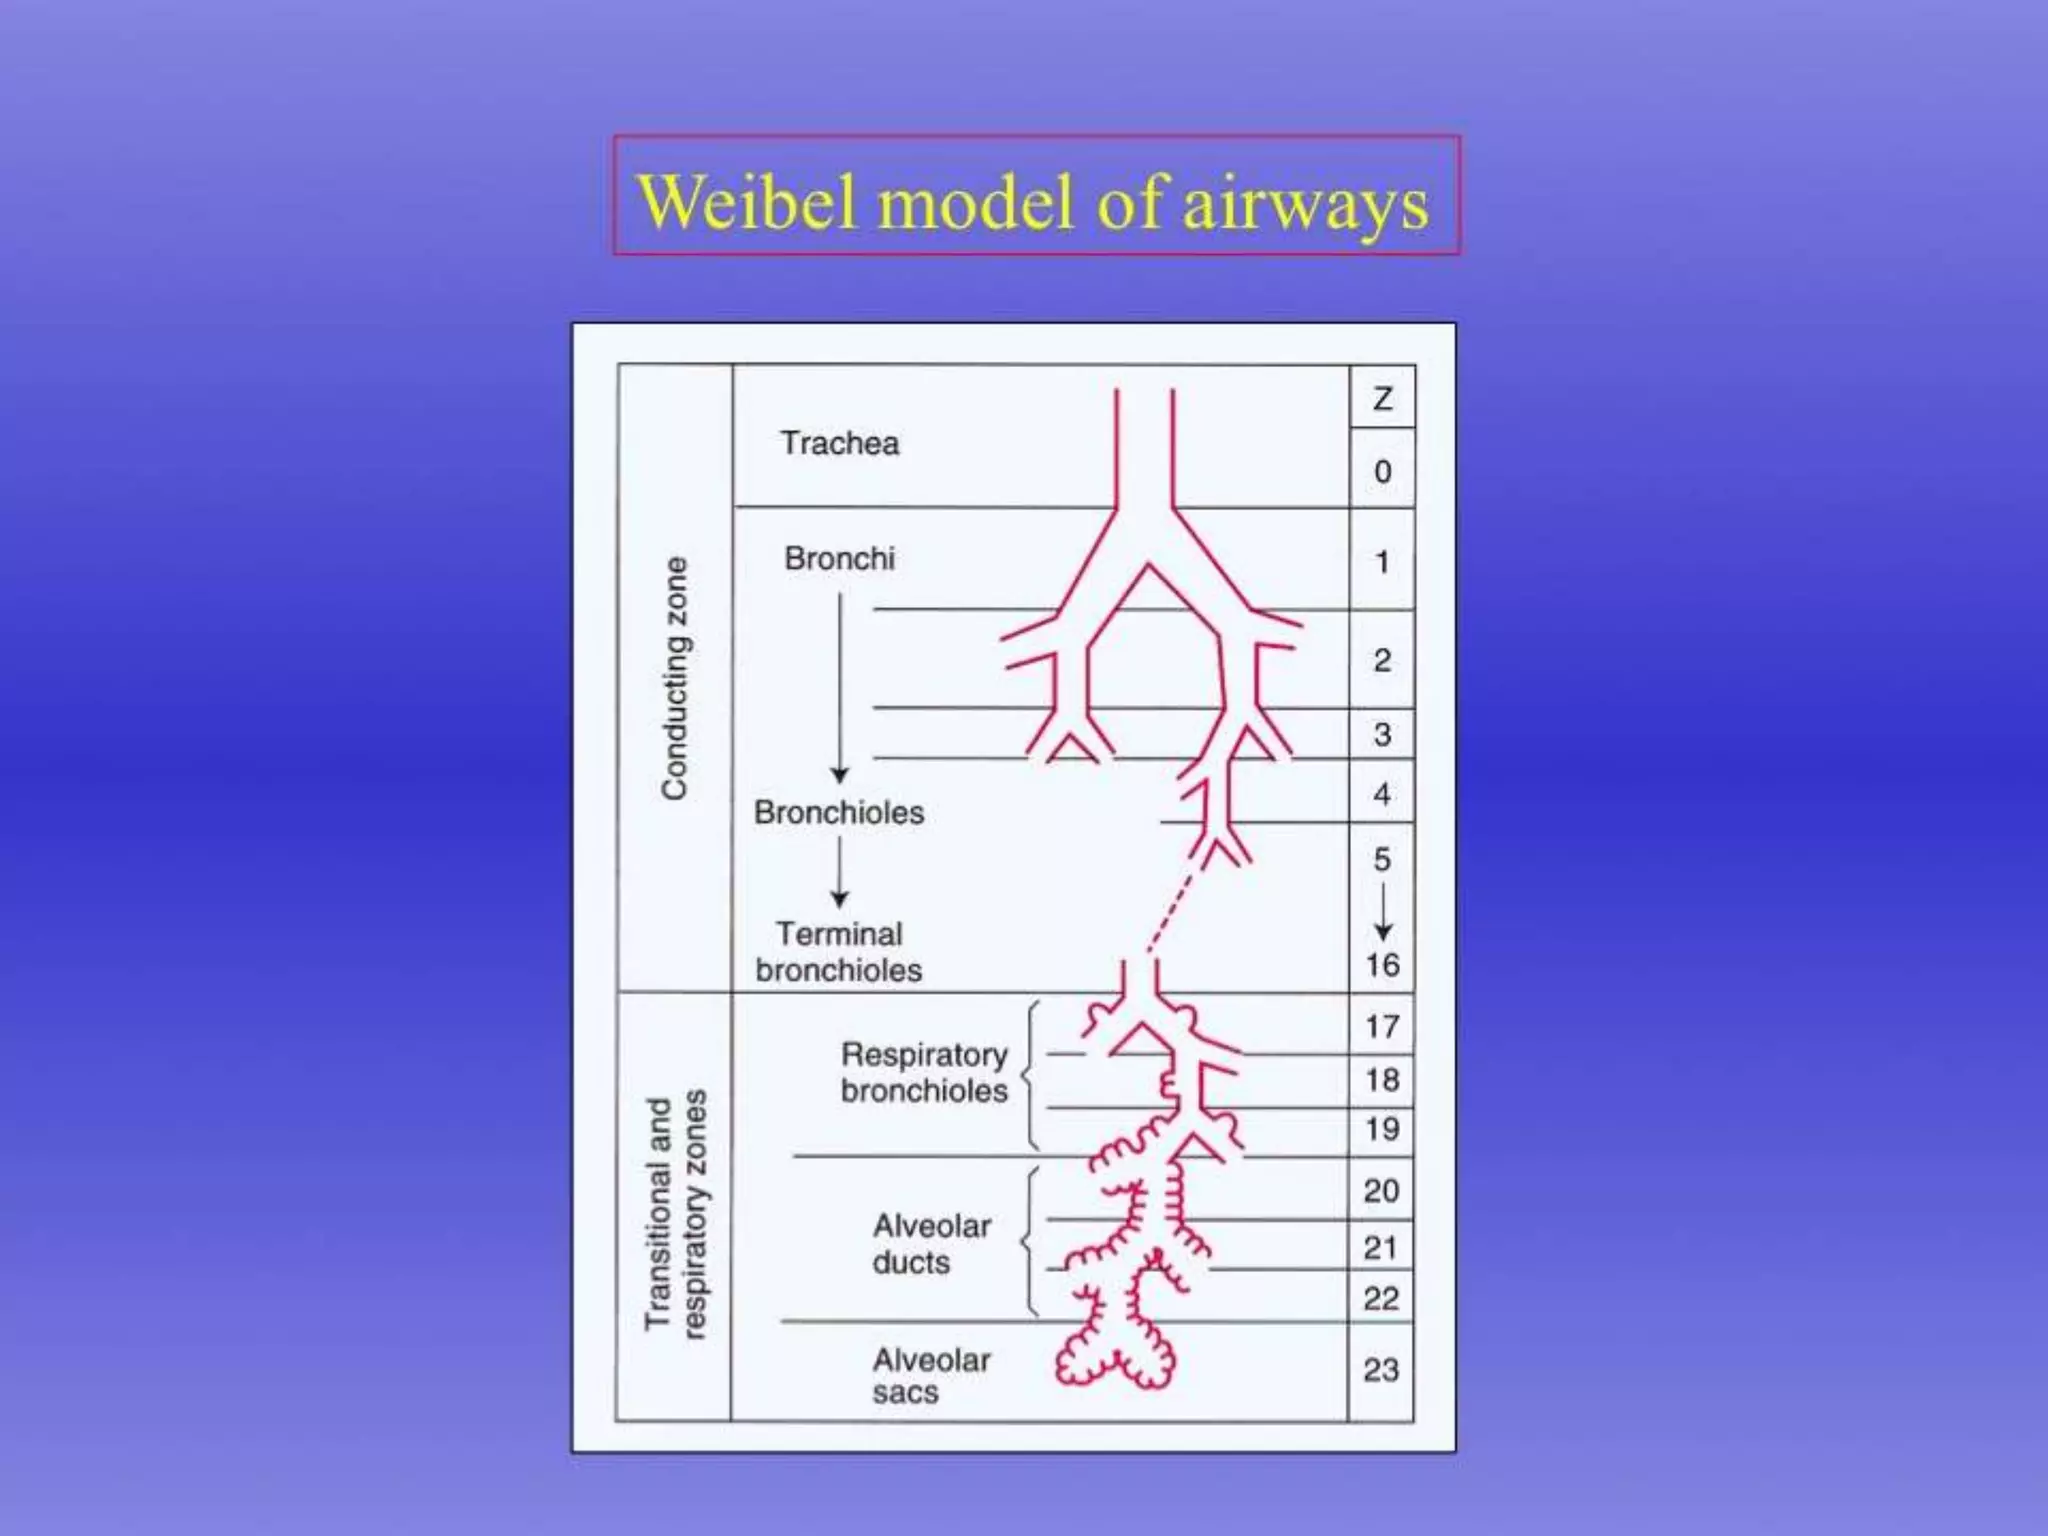
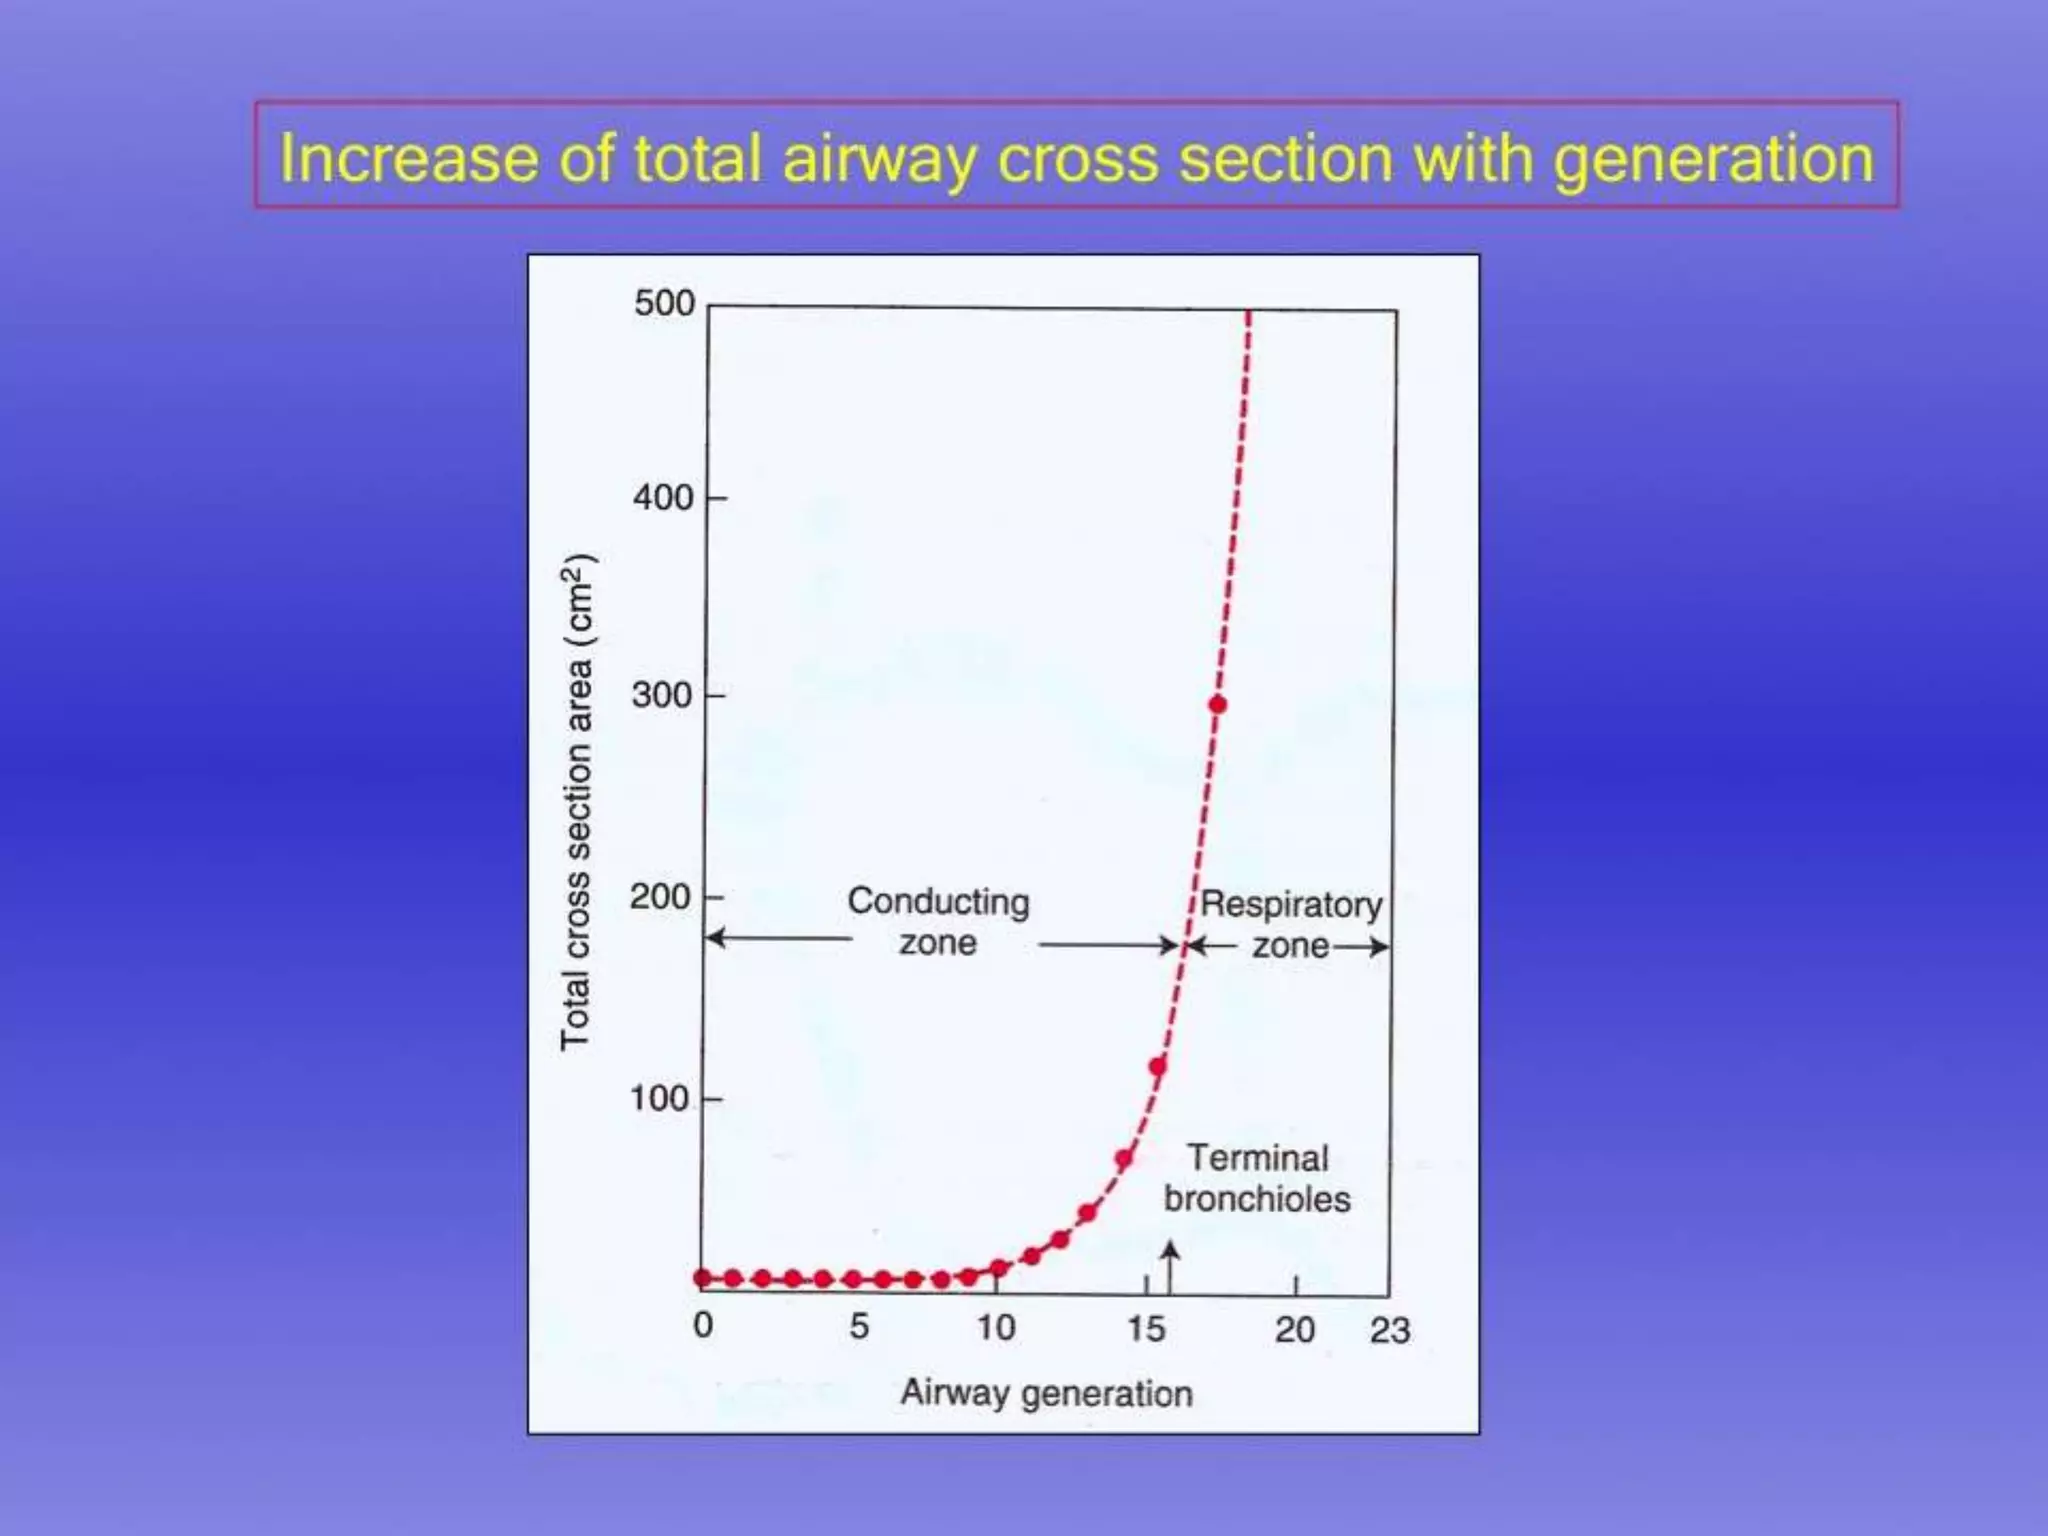
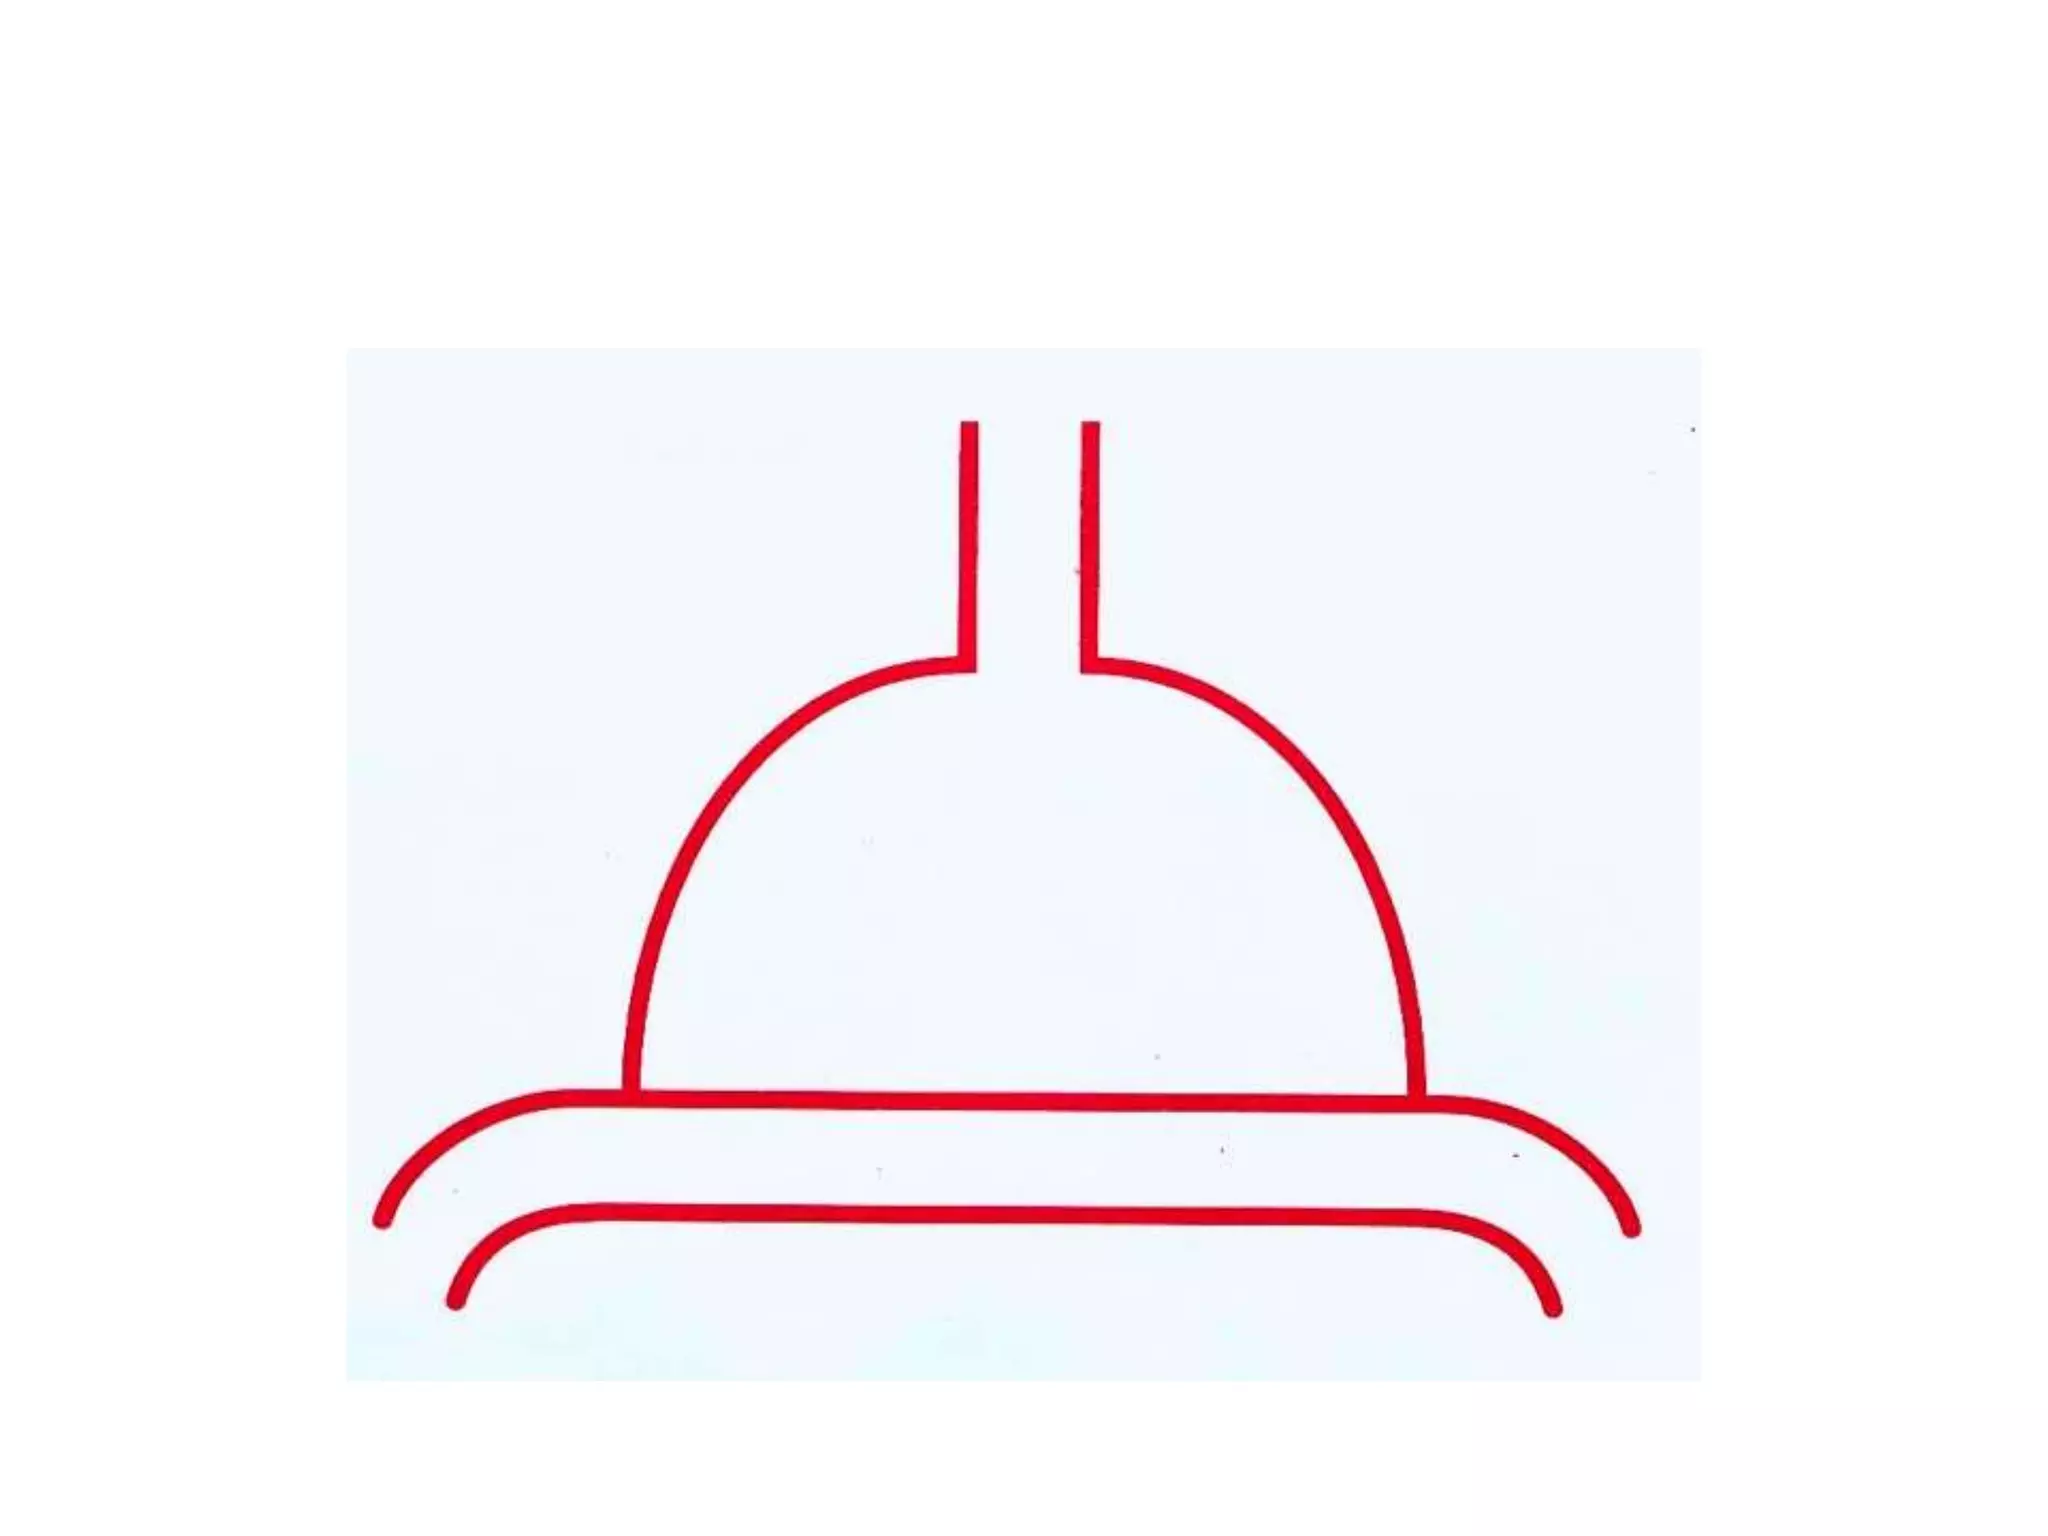
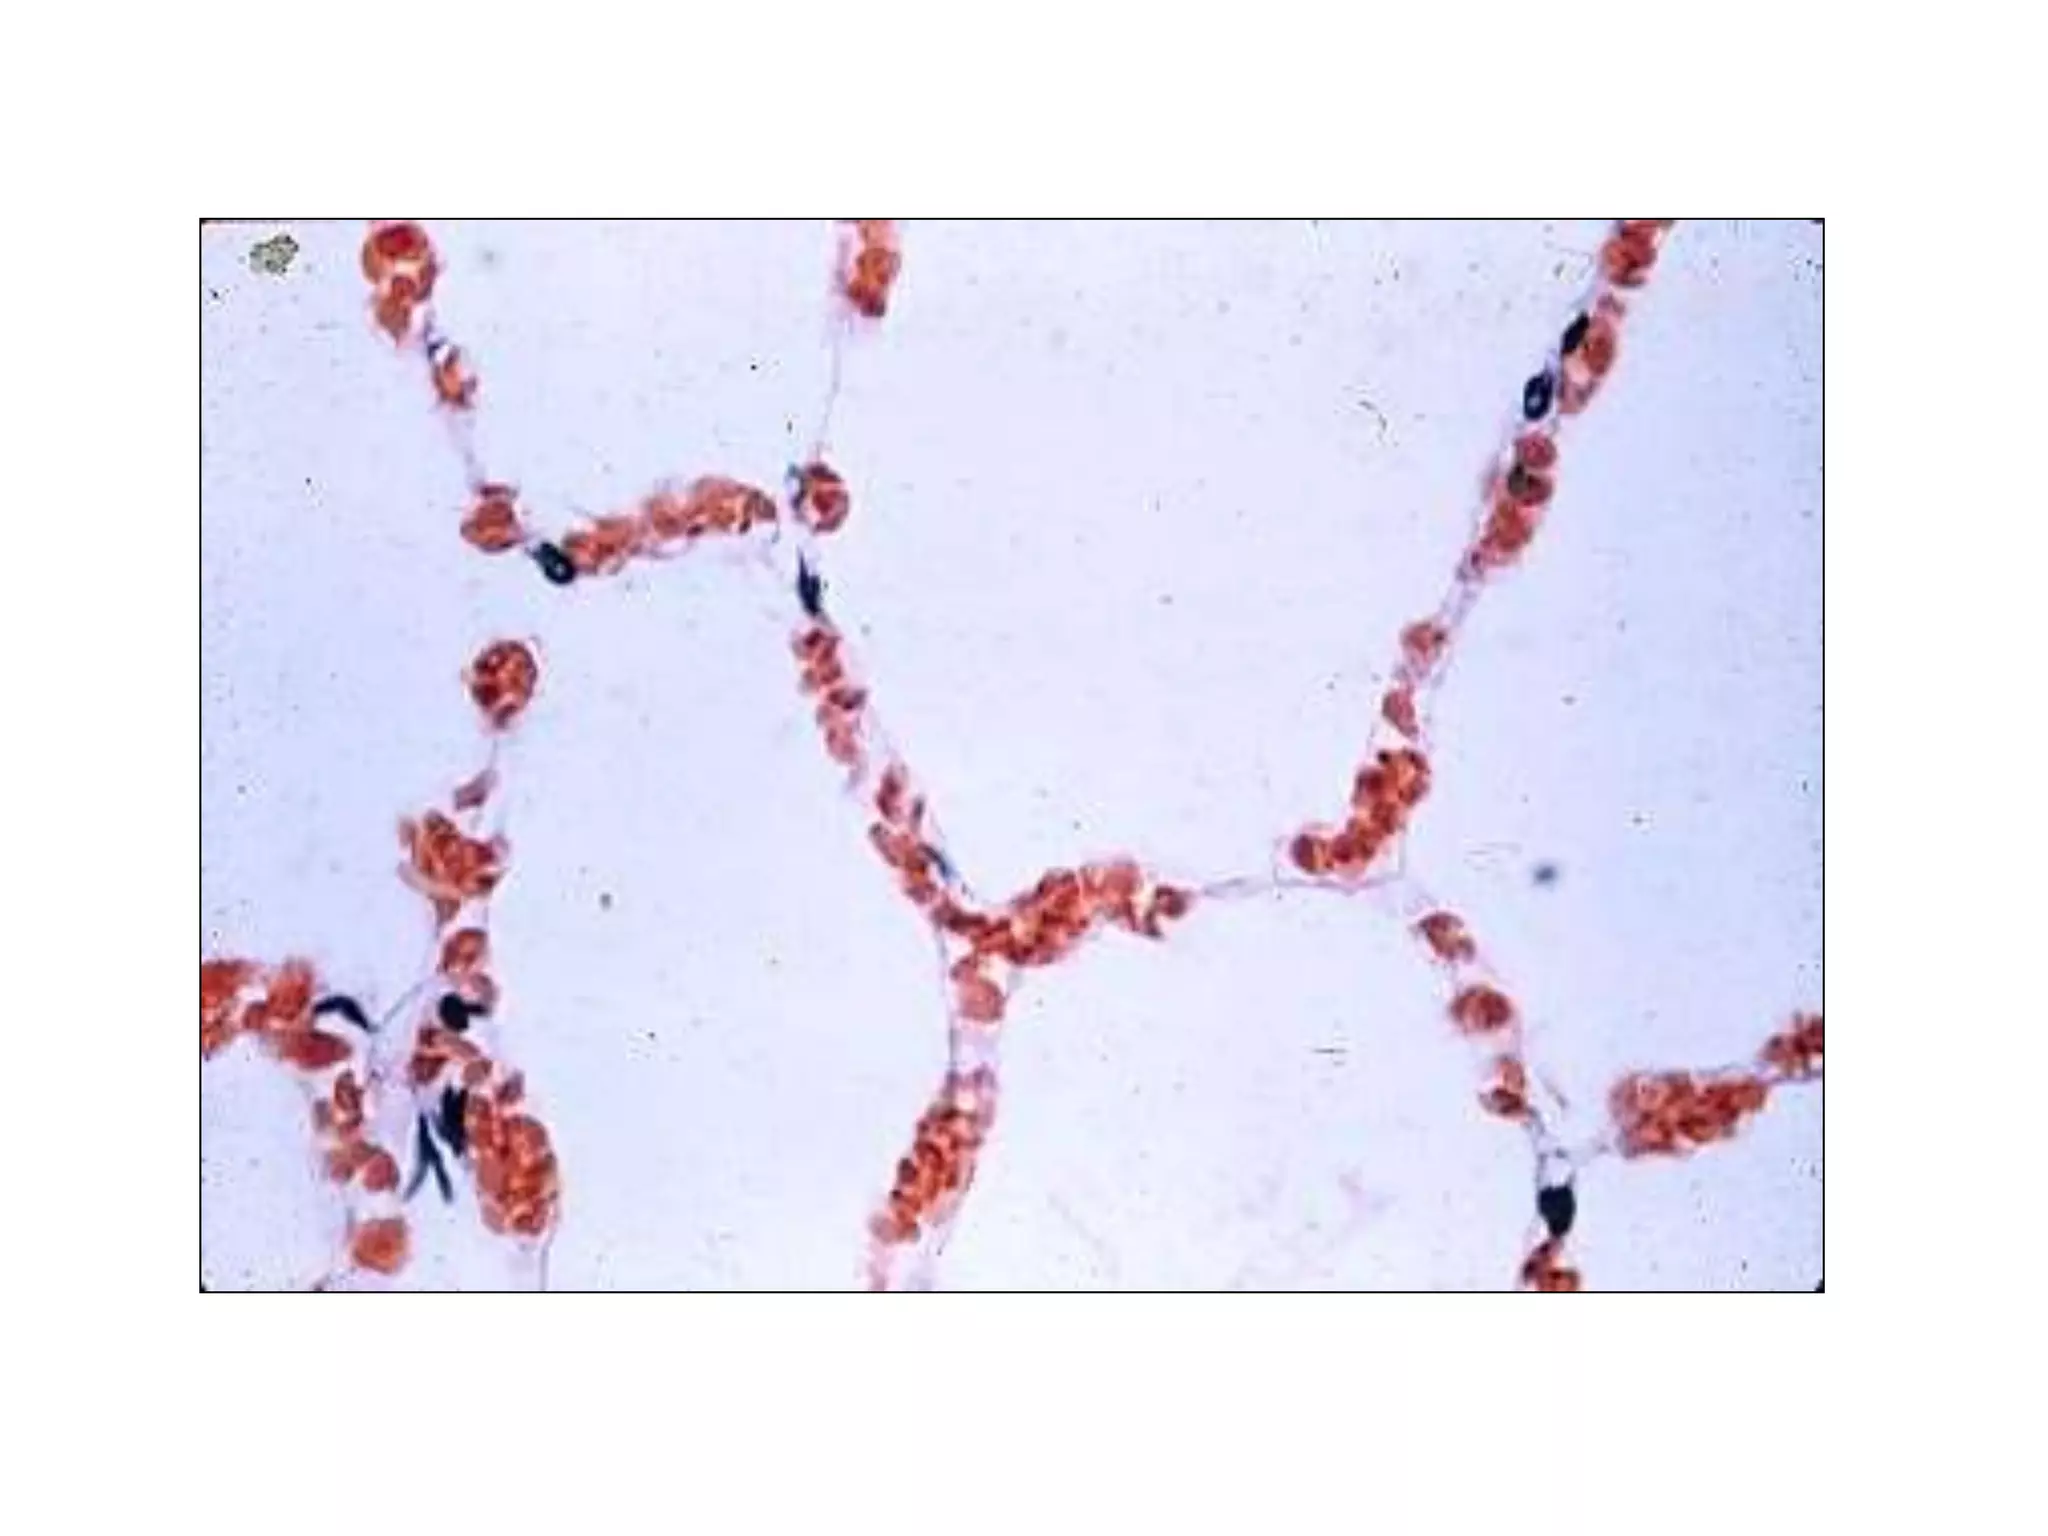
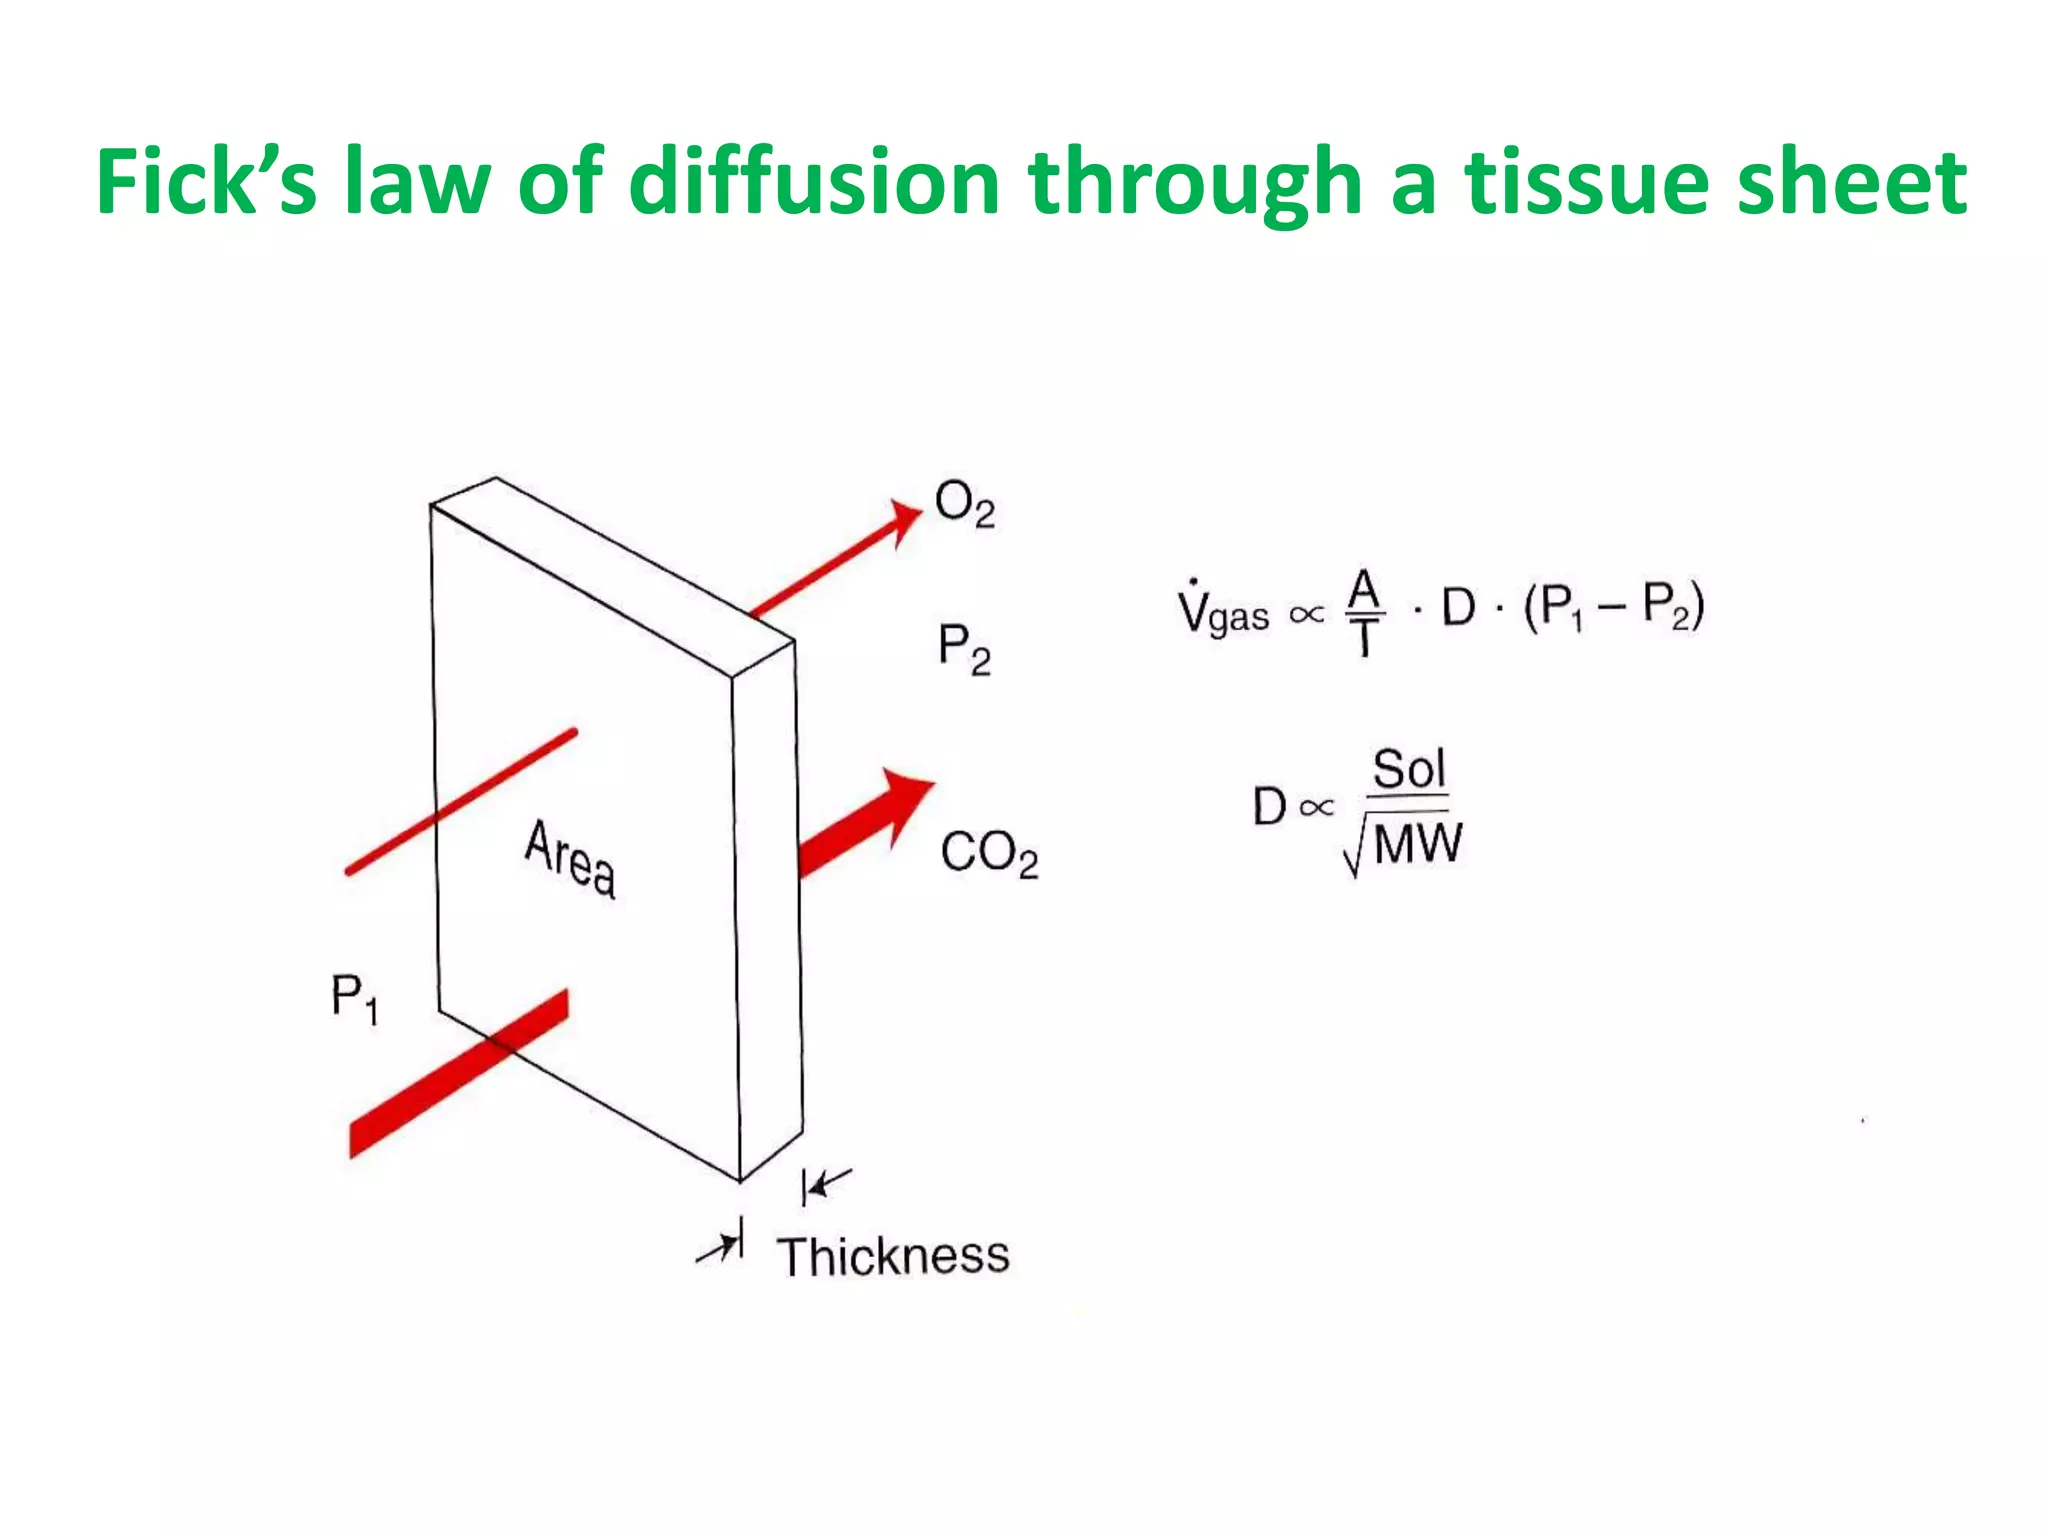
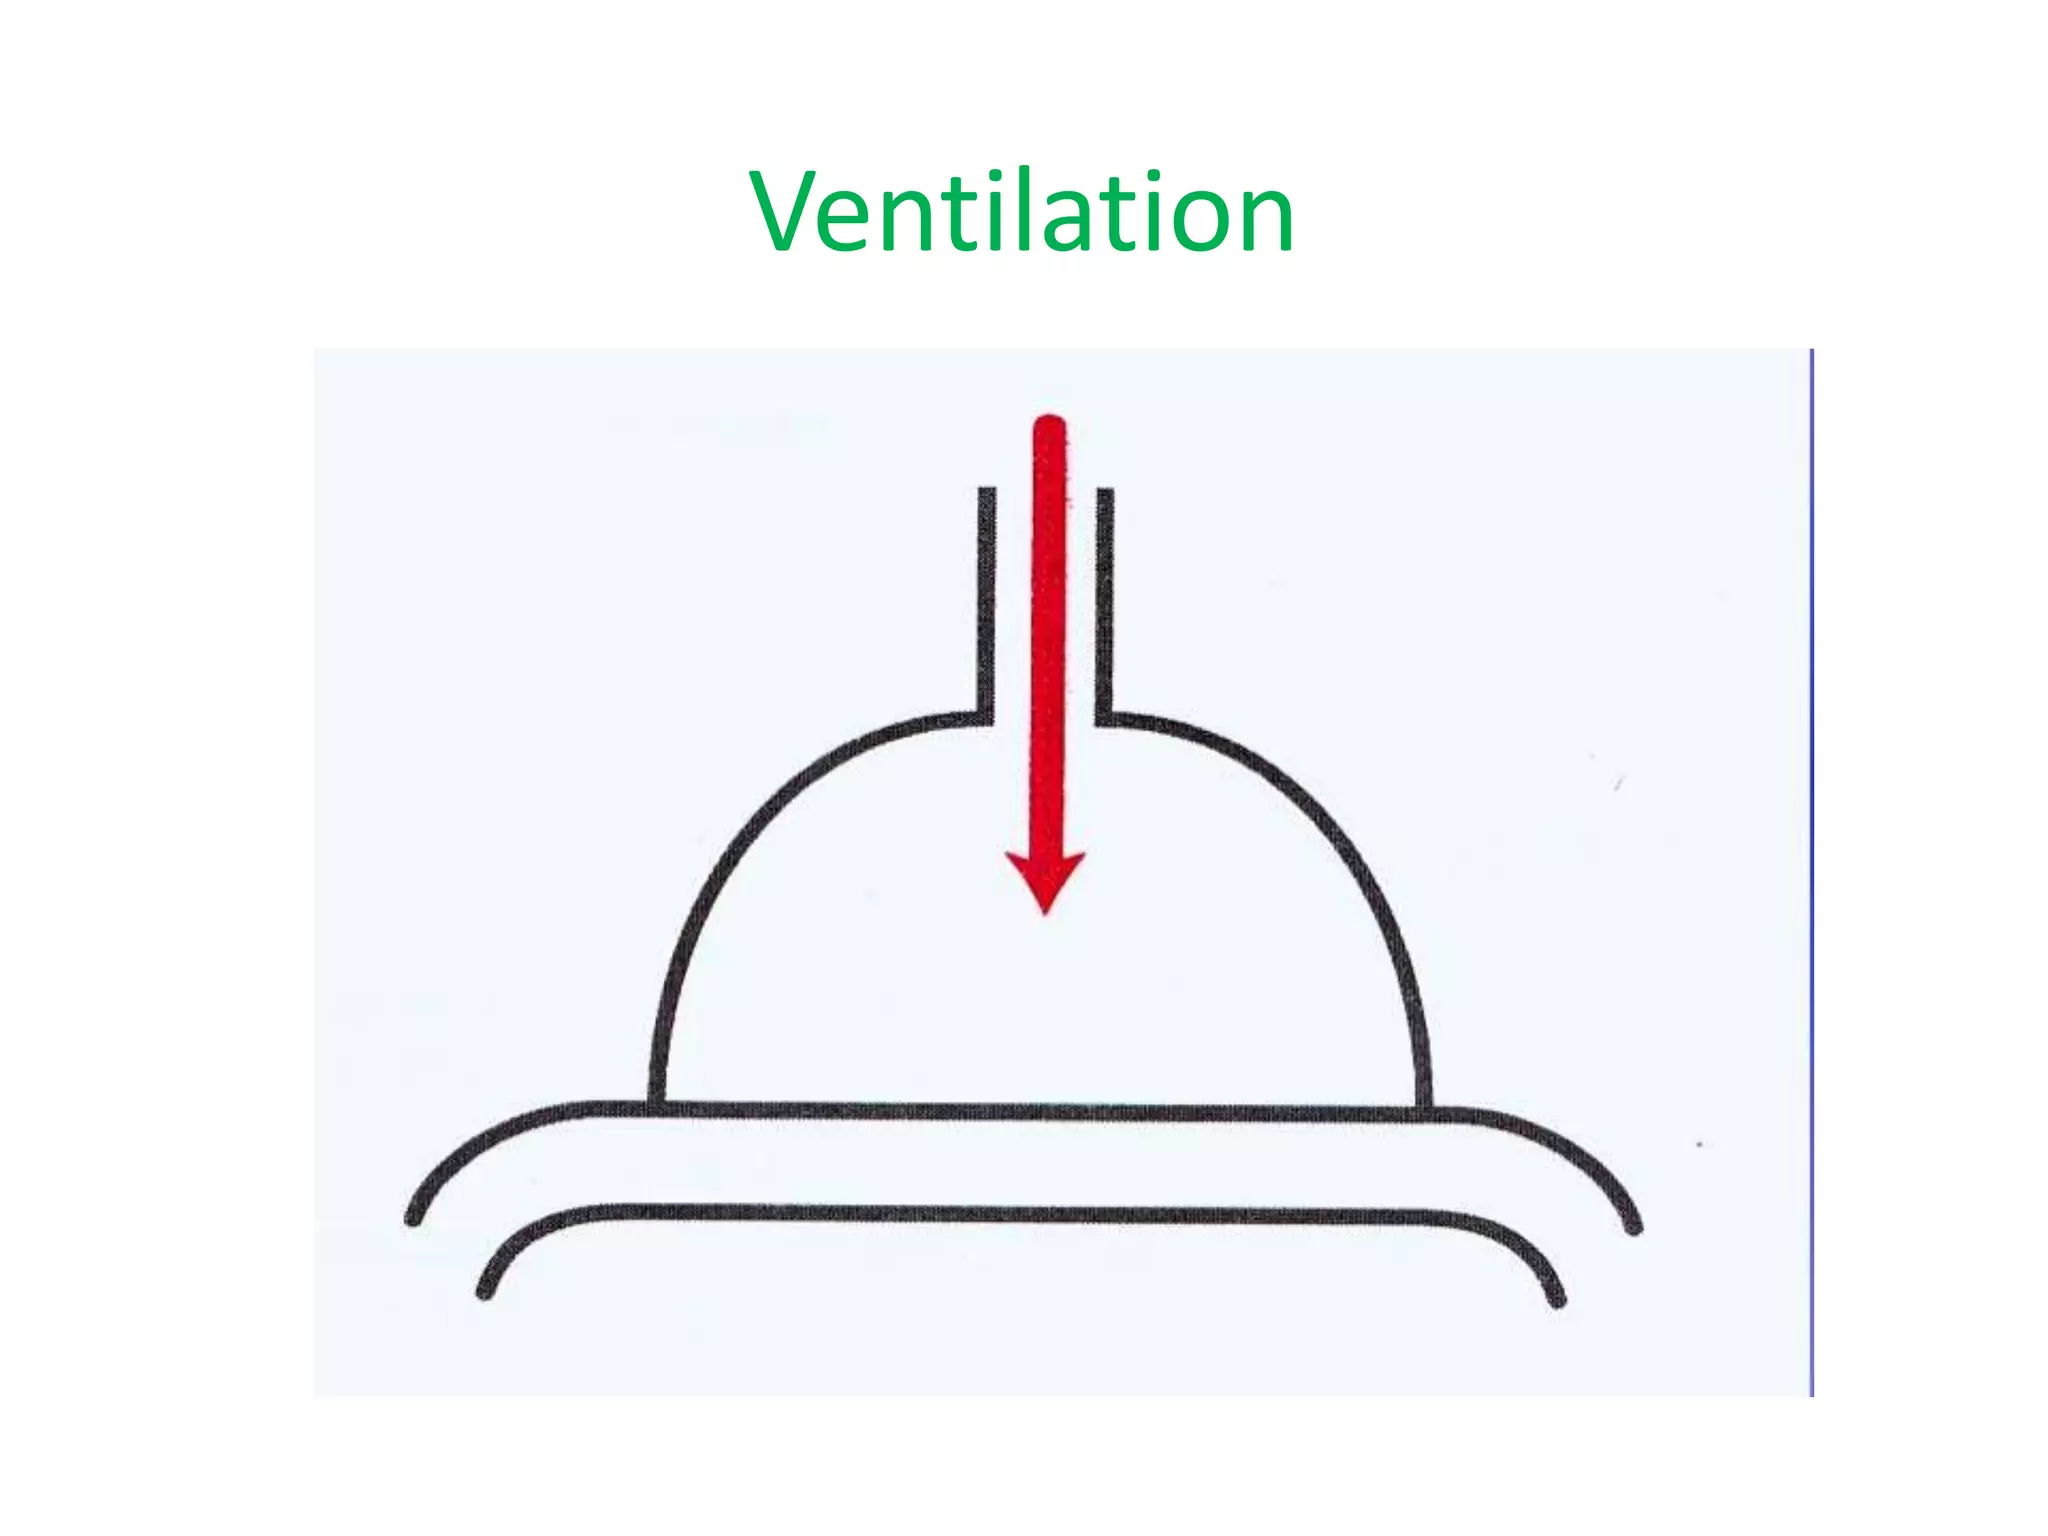
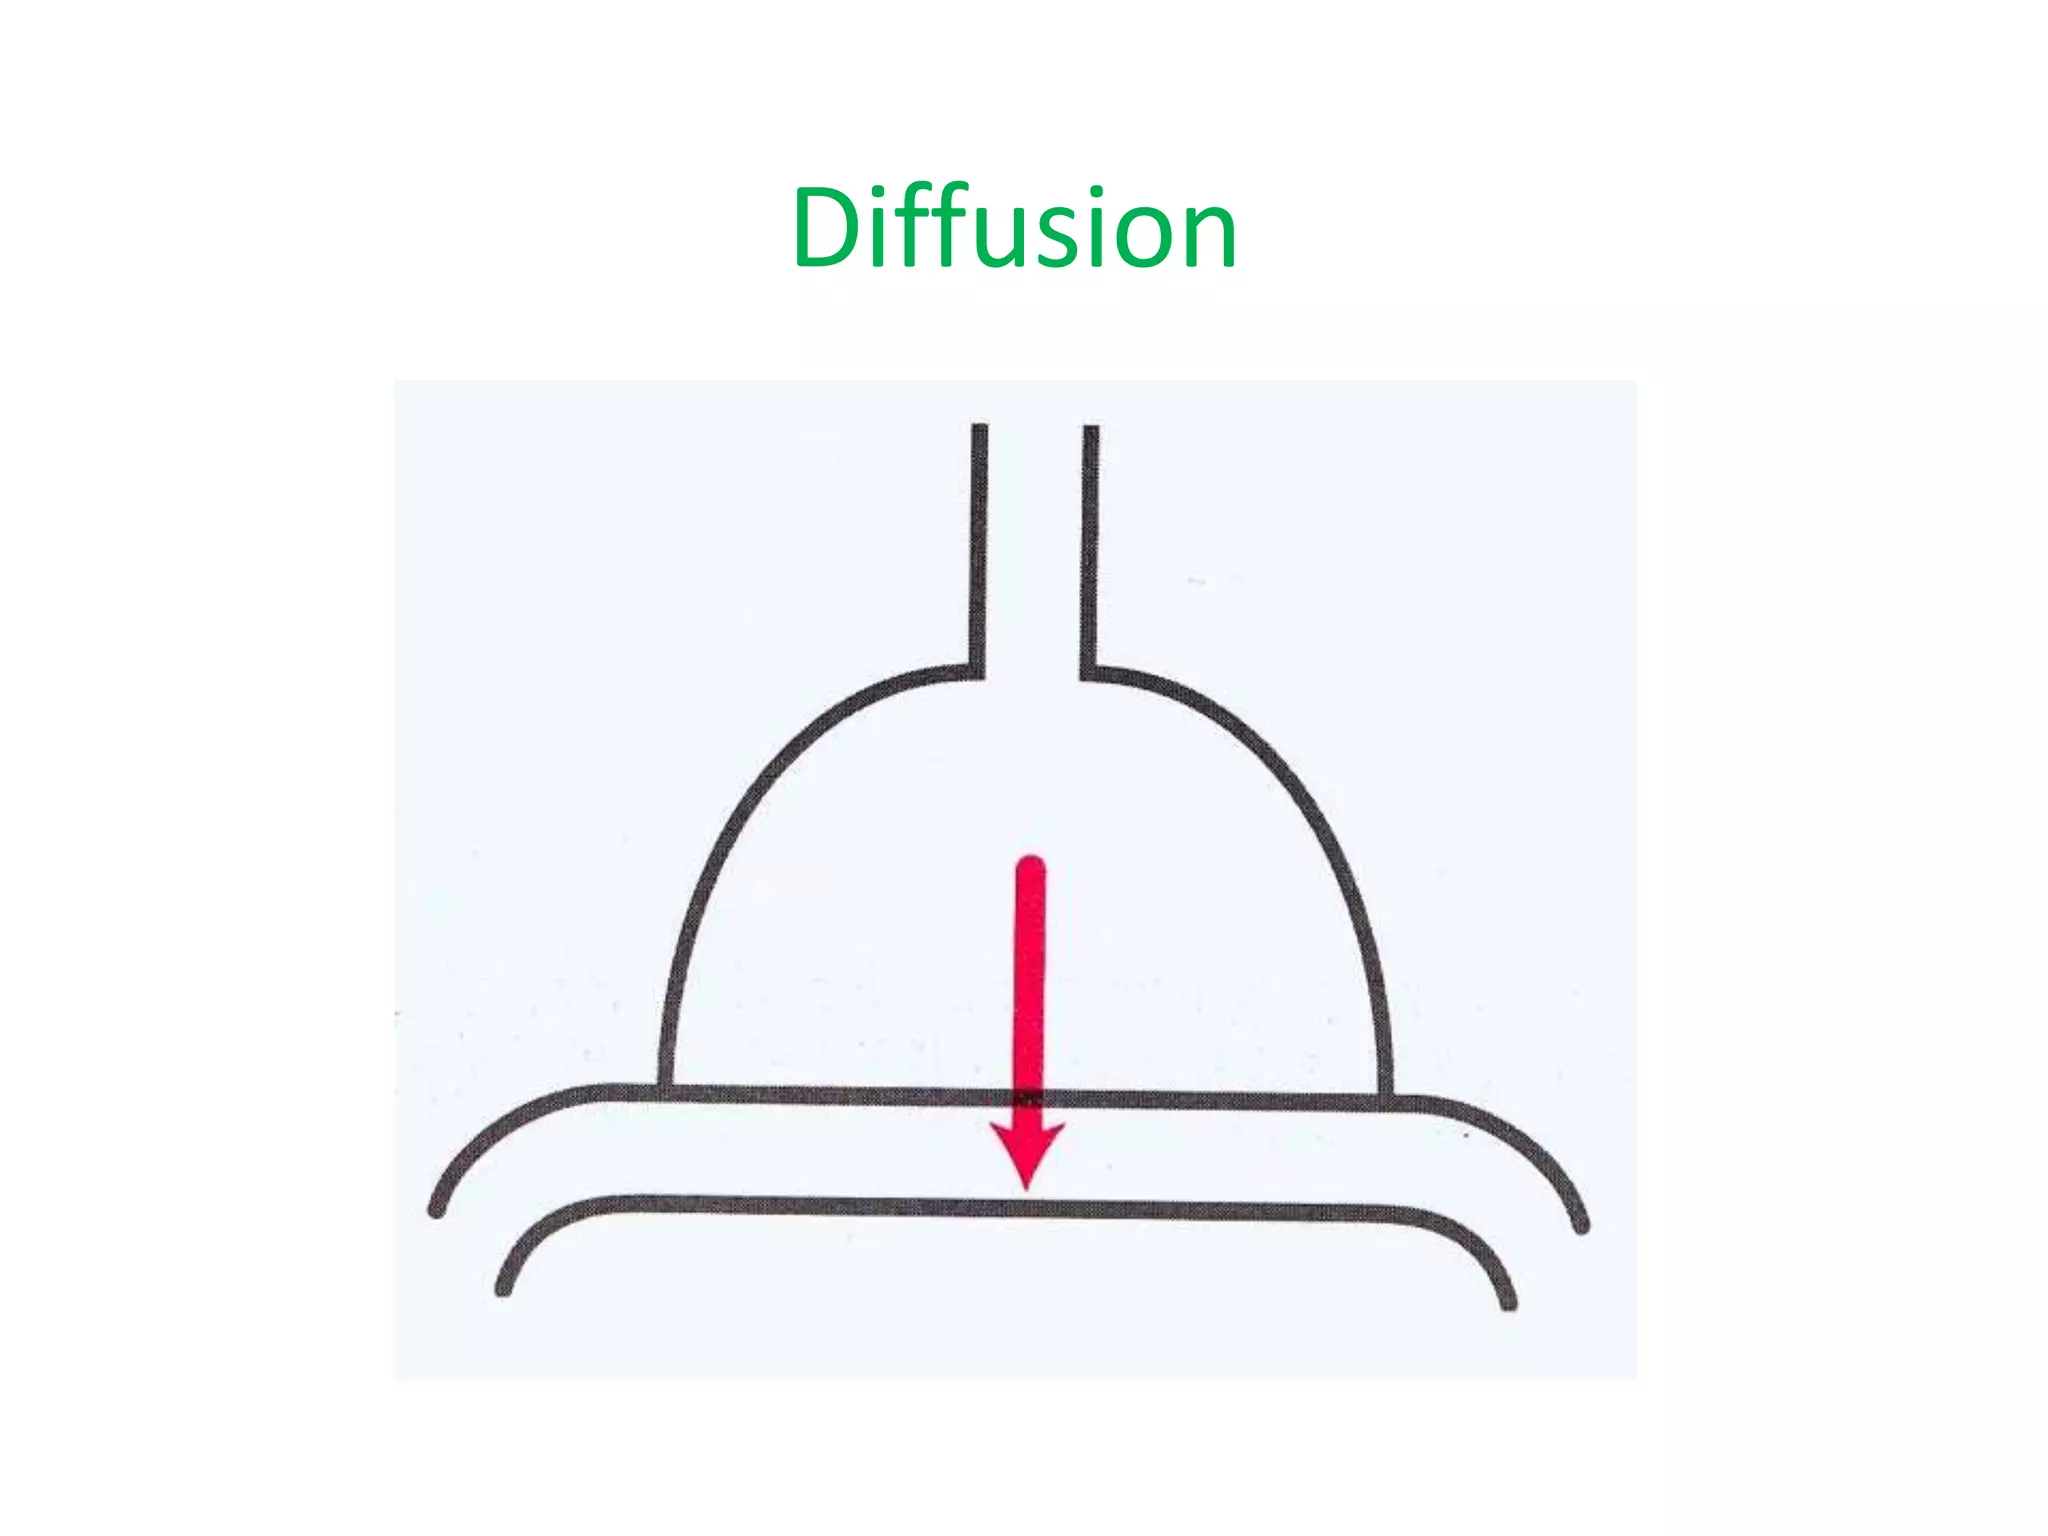
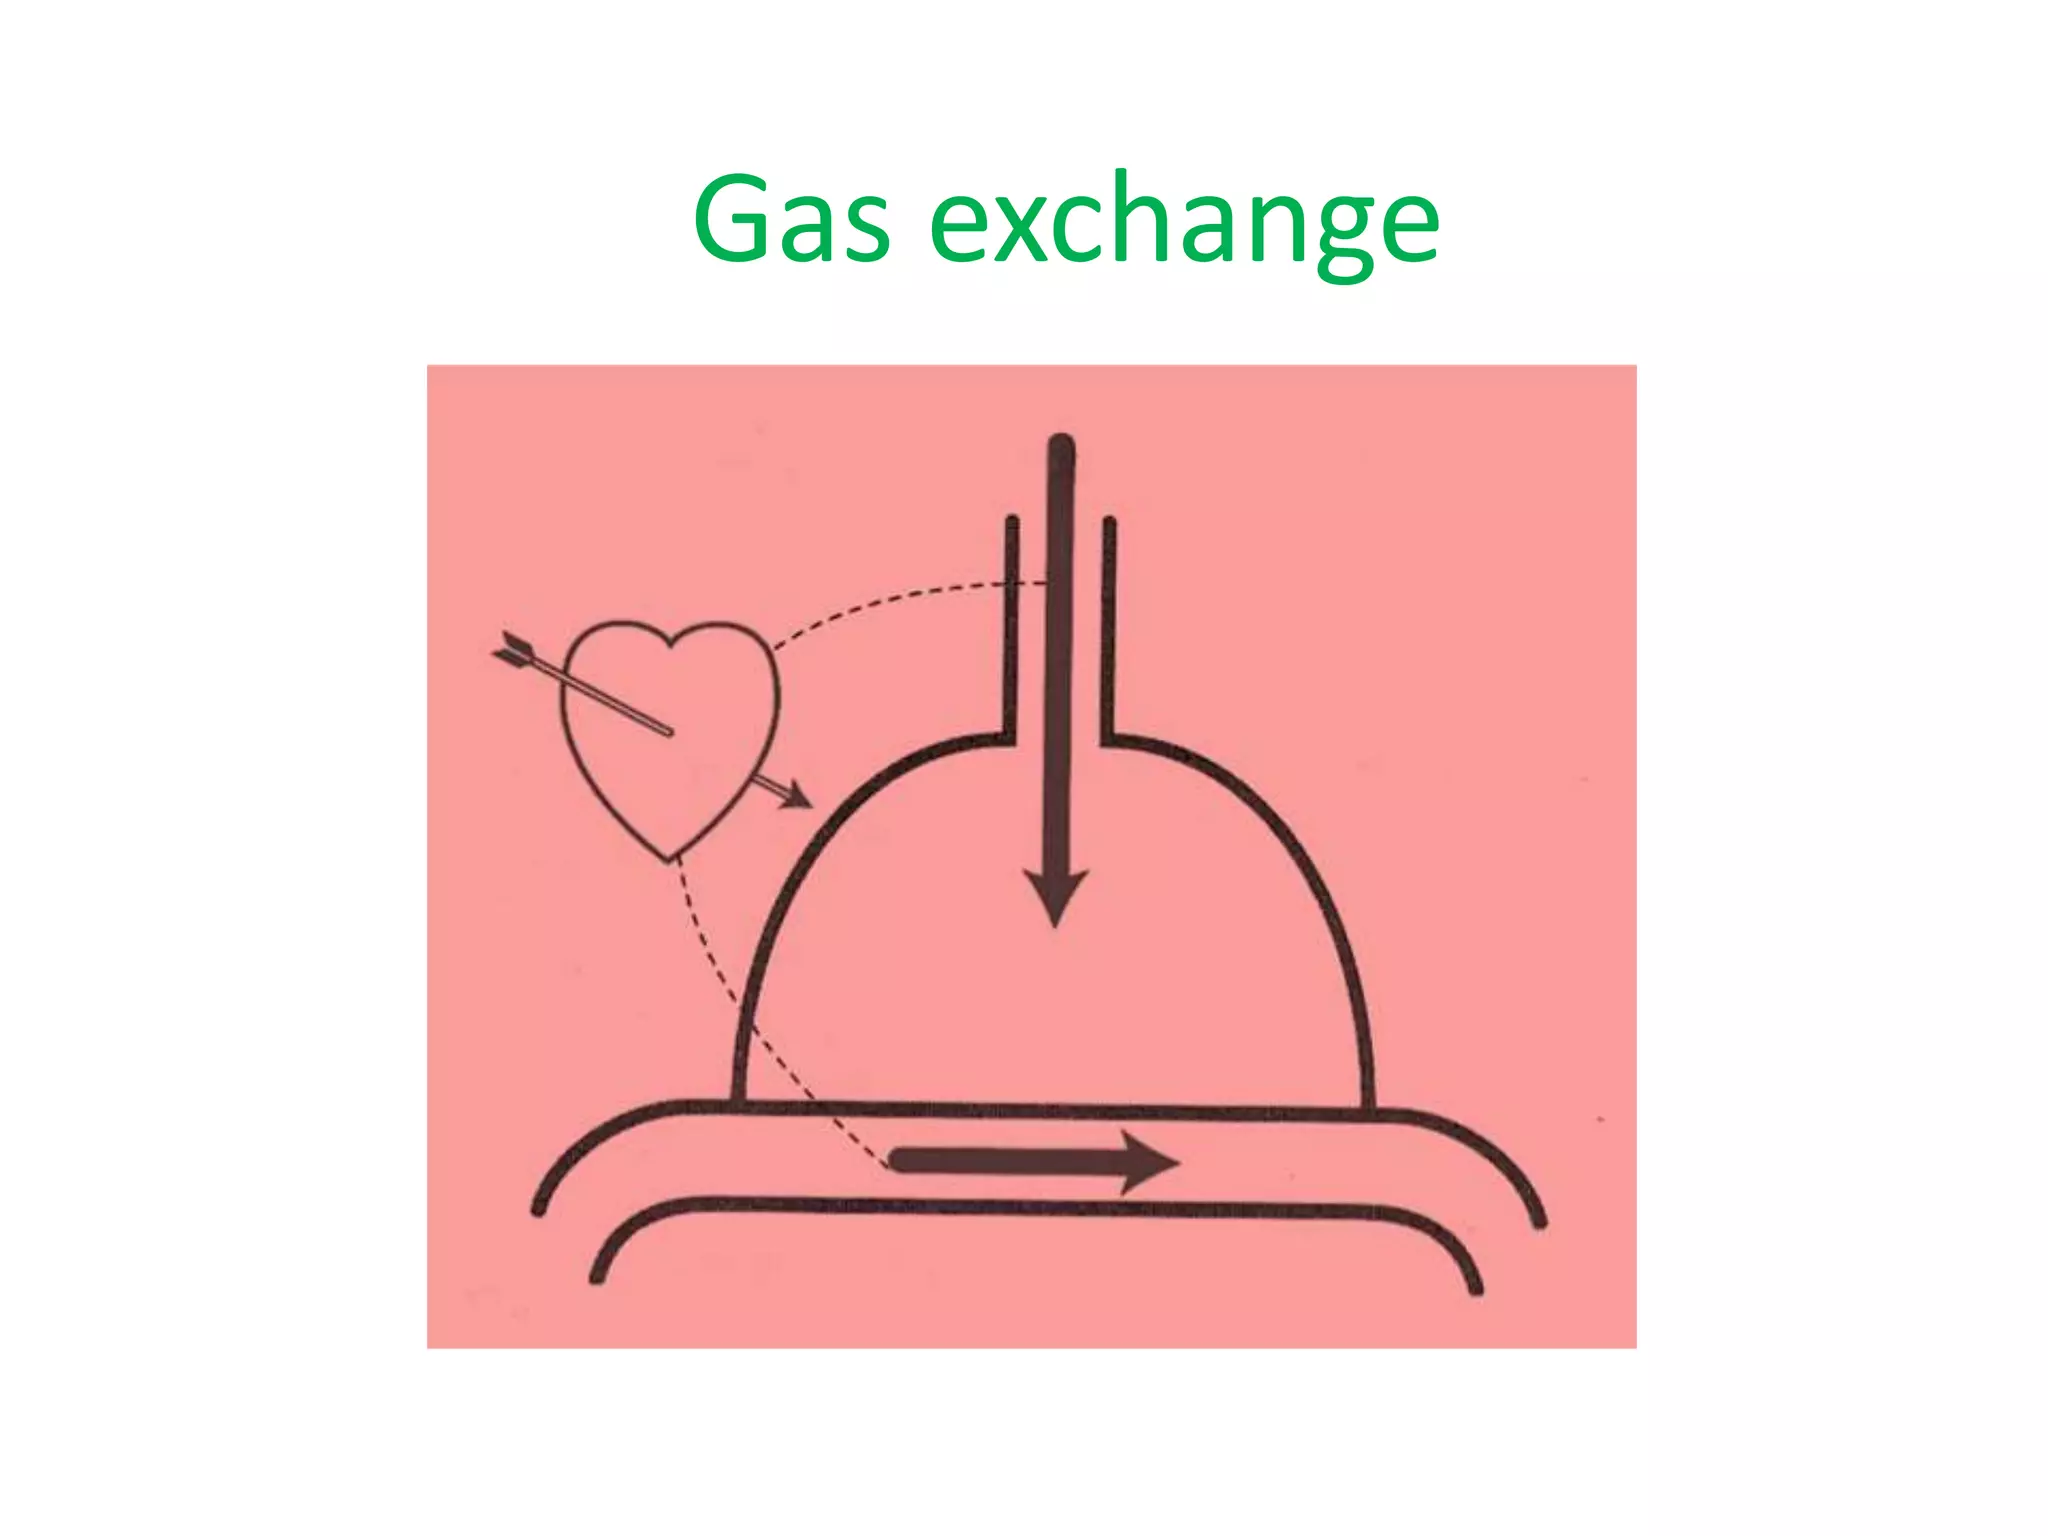
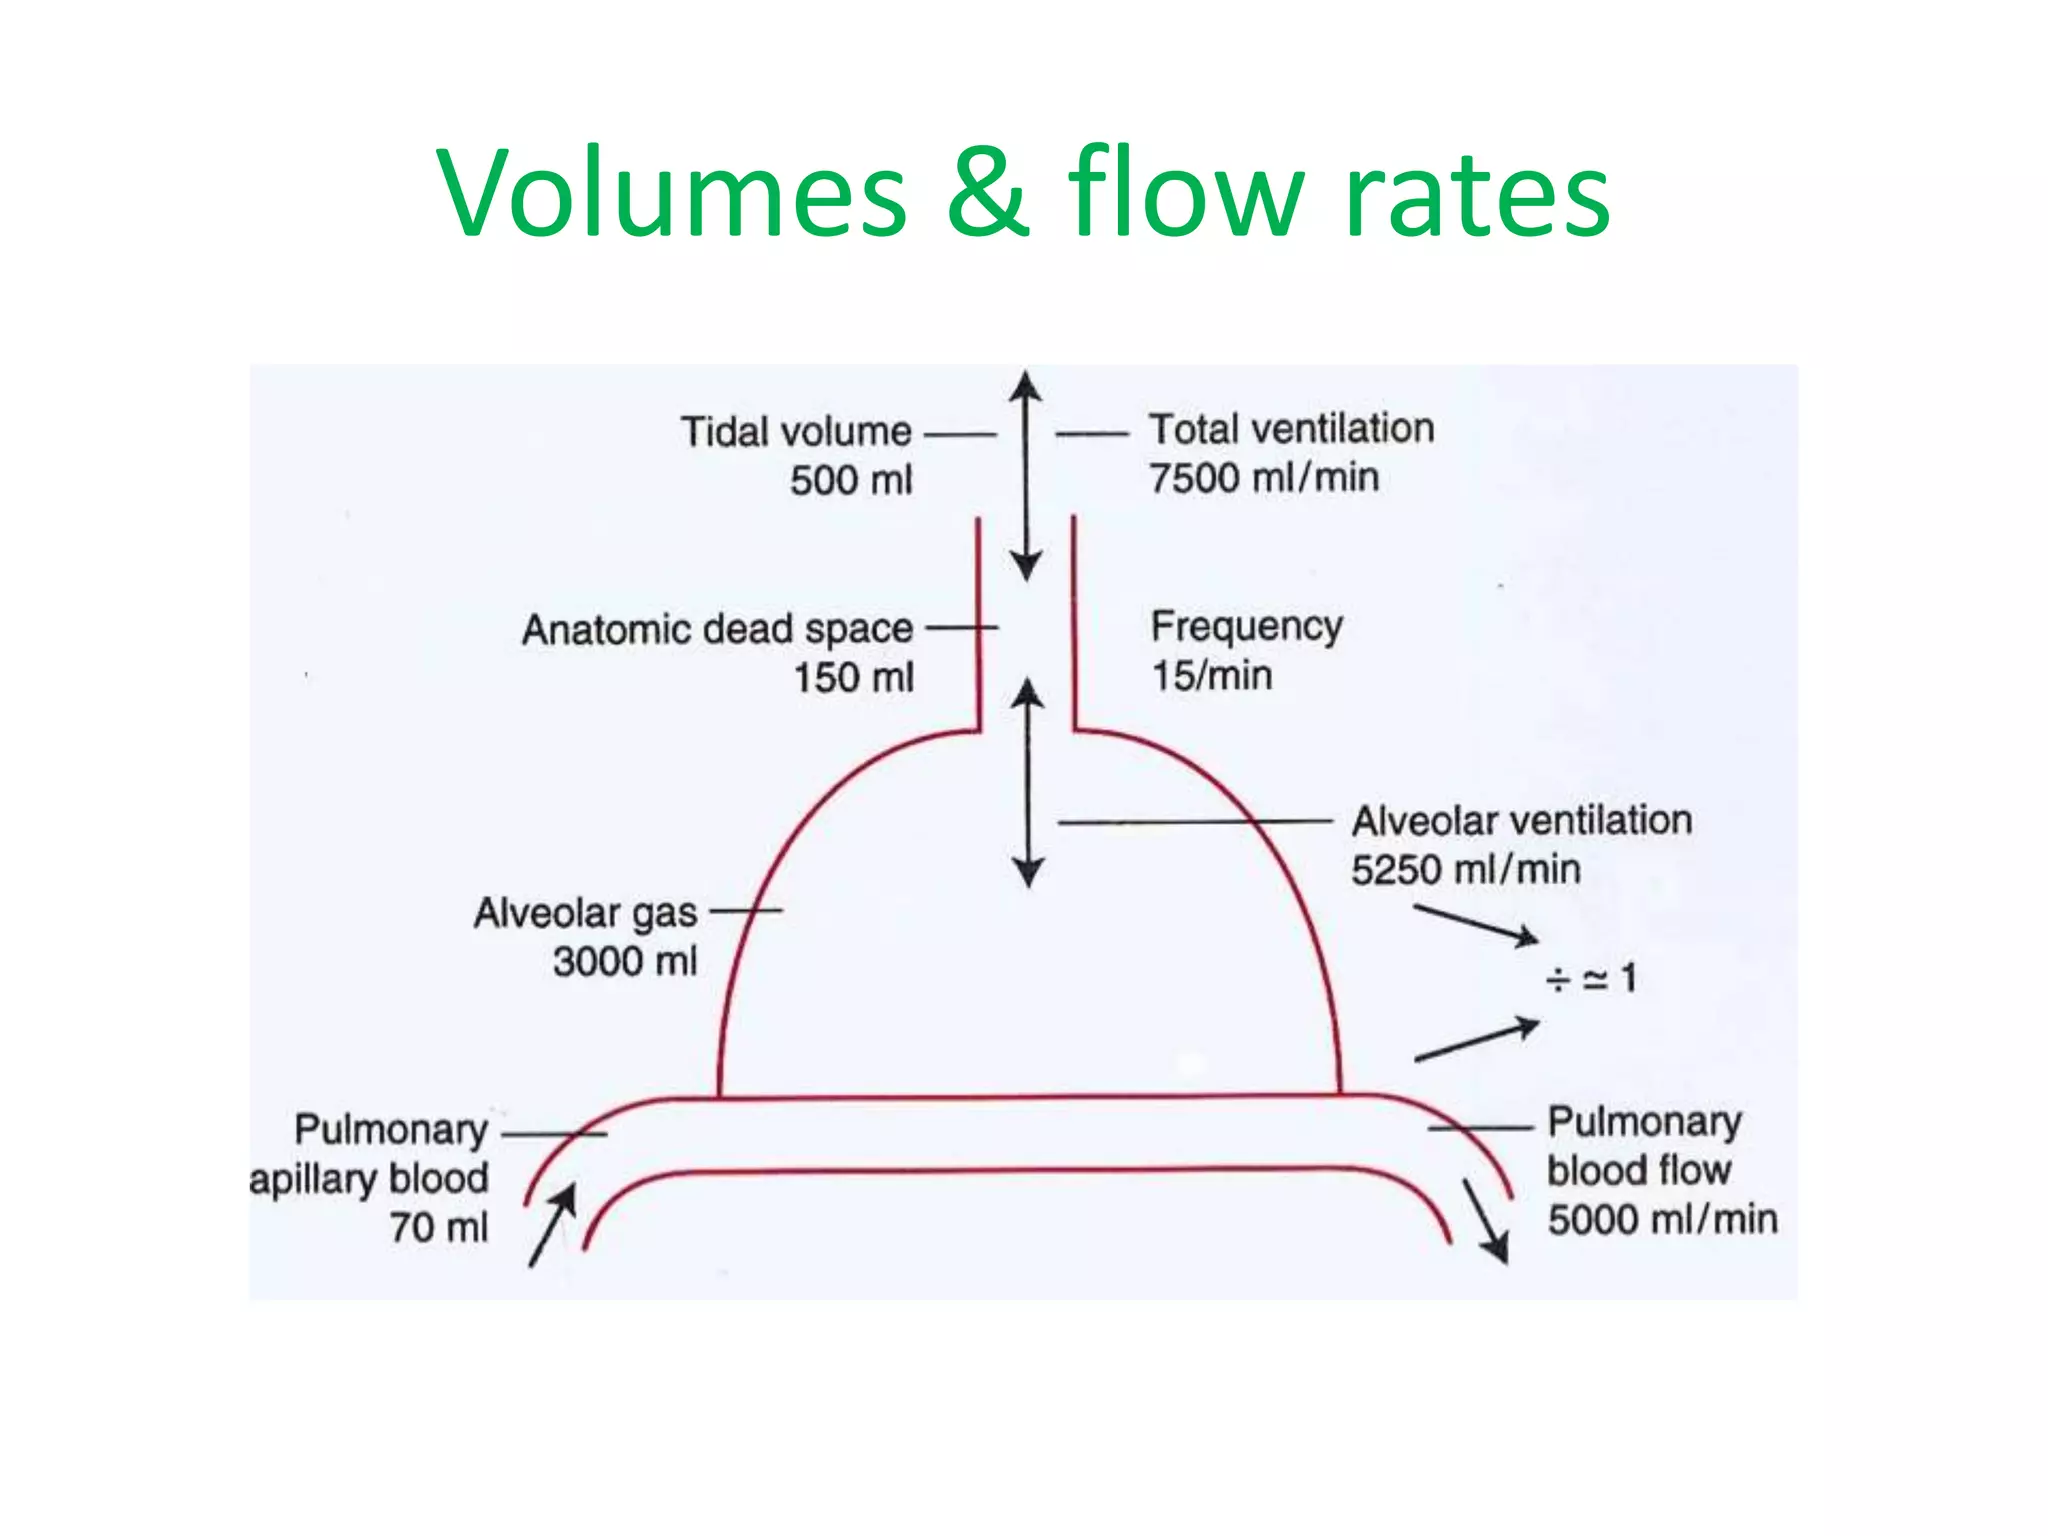
1. The document describes the structure and function of the lungs and trachea. It discusses key anatomical features like the trachea, bronchi, bronchopulmonary segments, blood supply, lymphatic drainage, and gas exchange in the lungs.
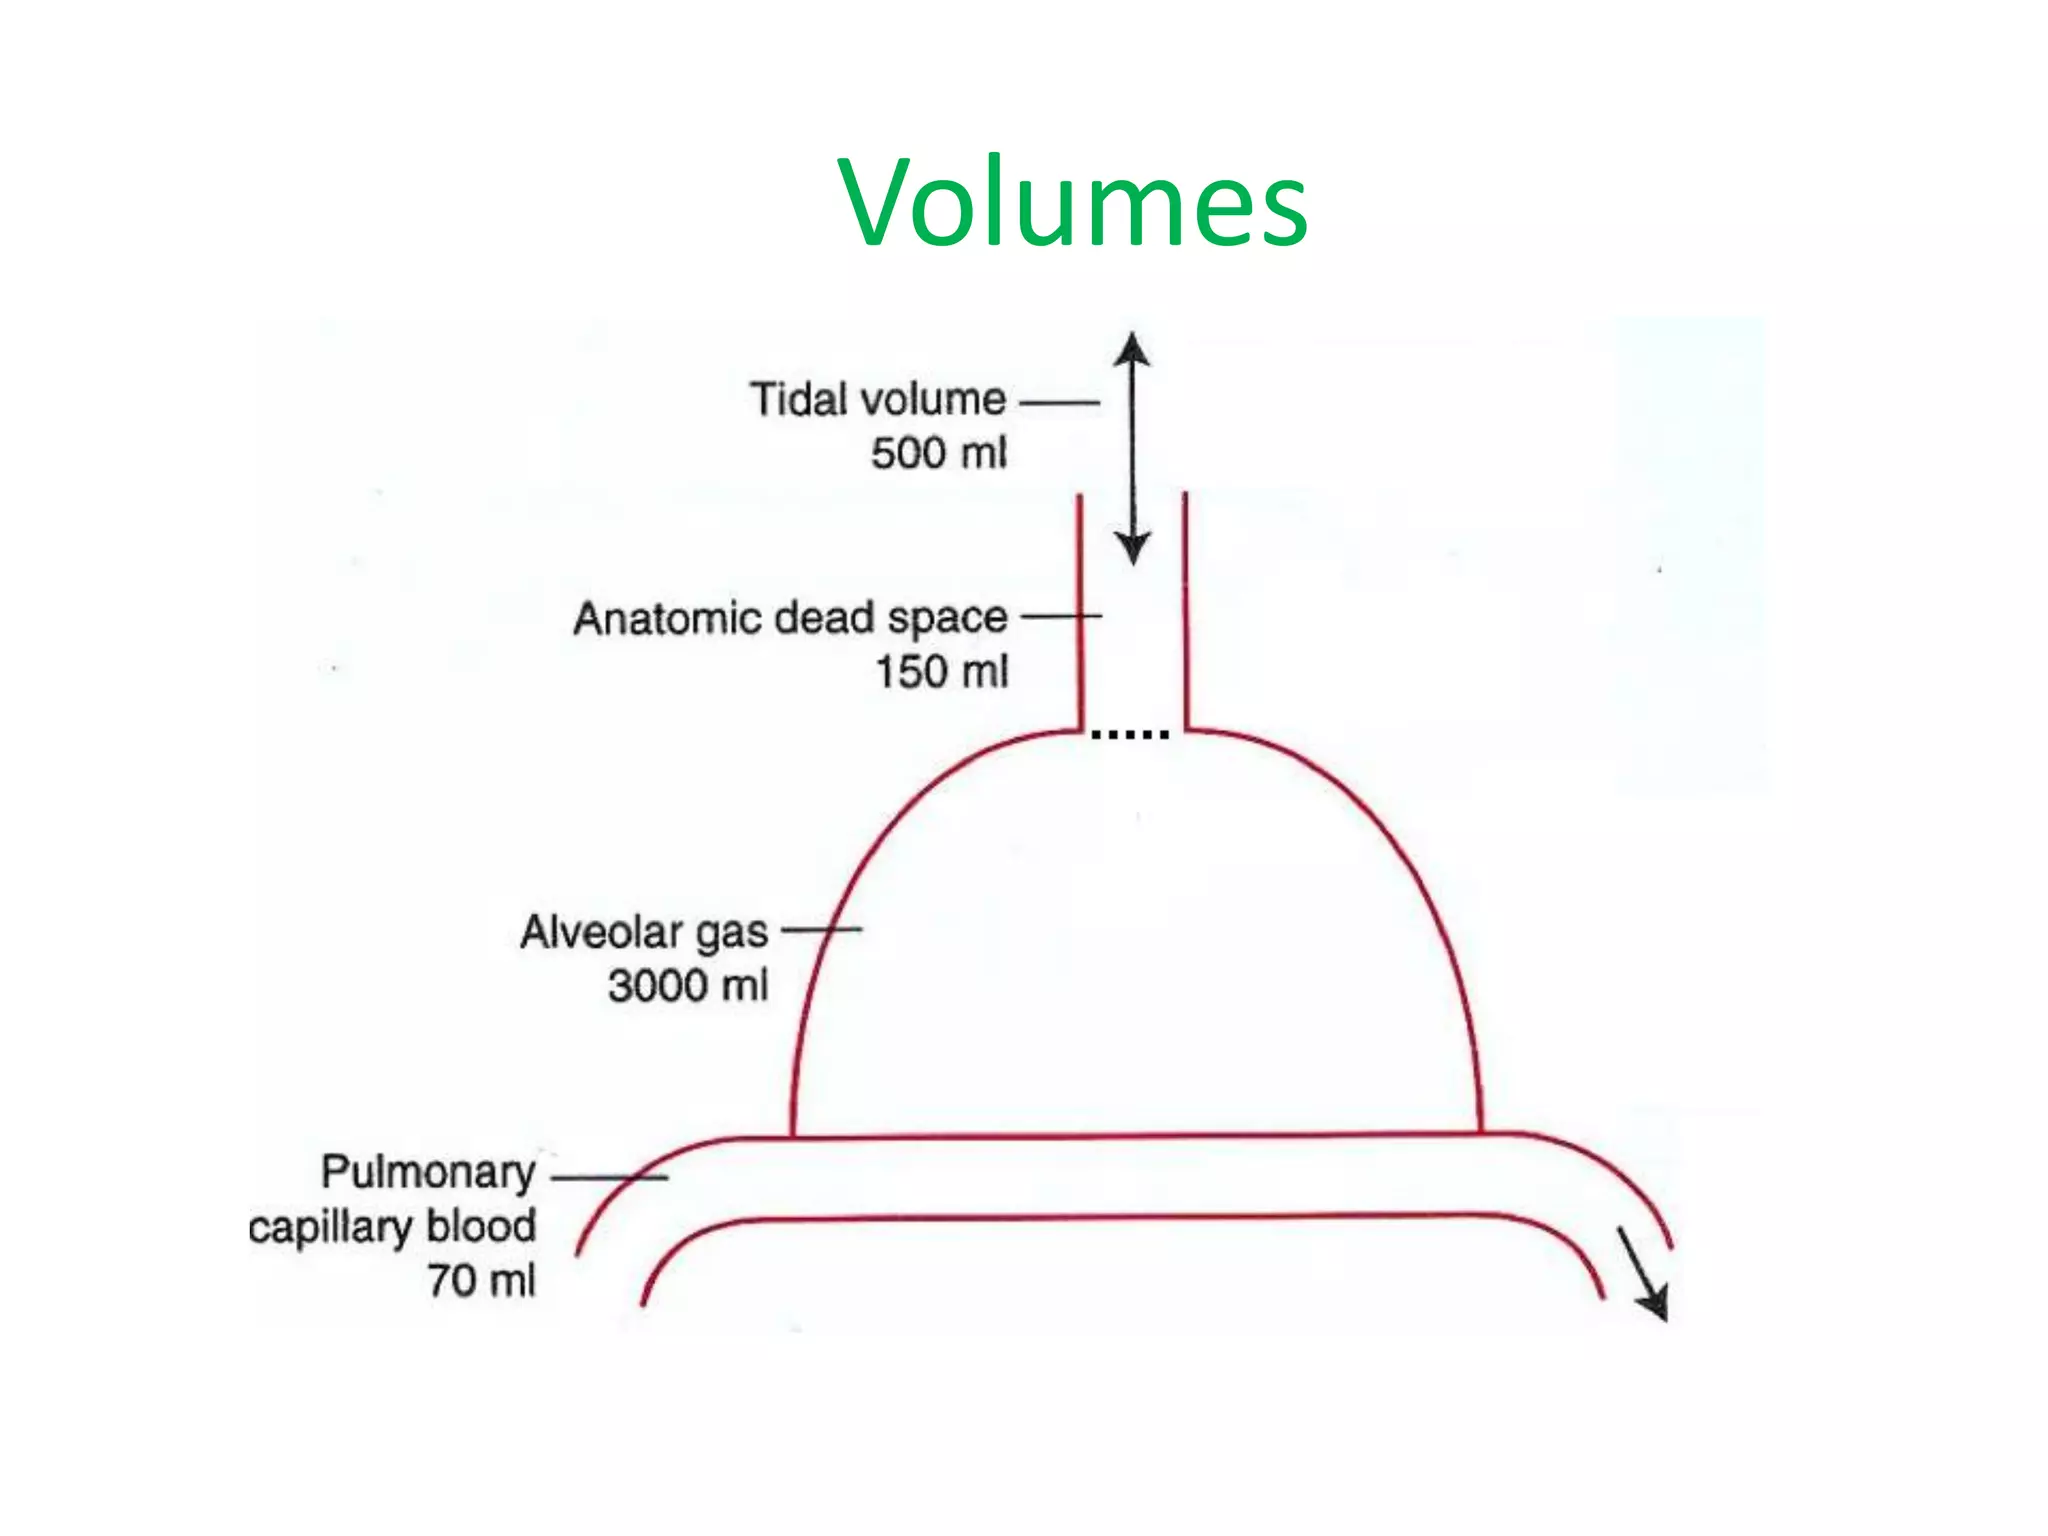
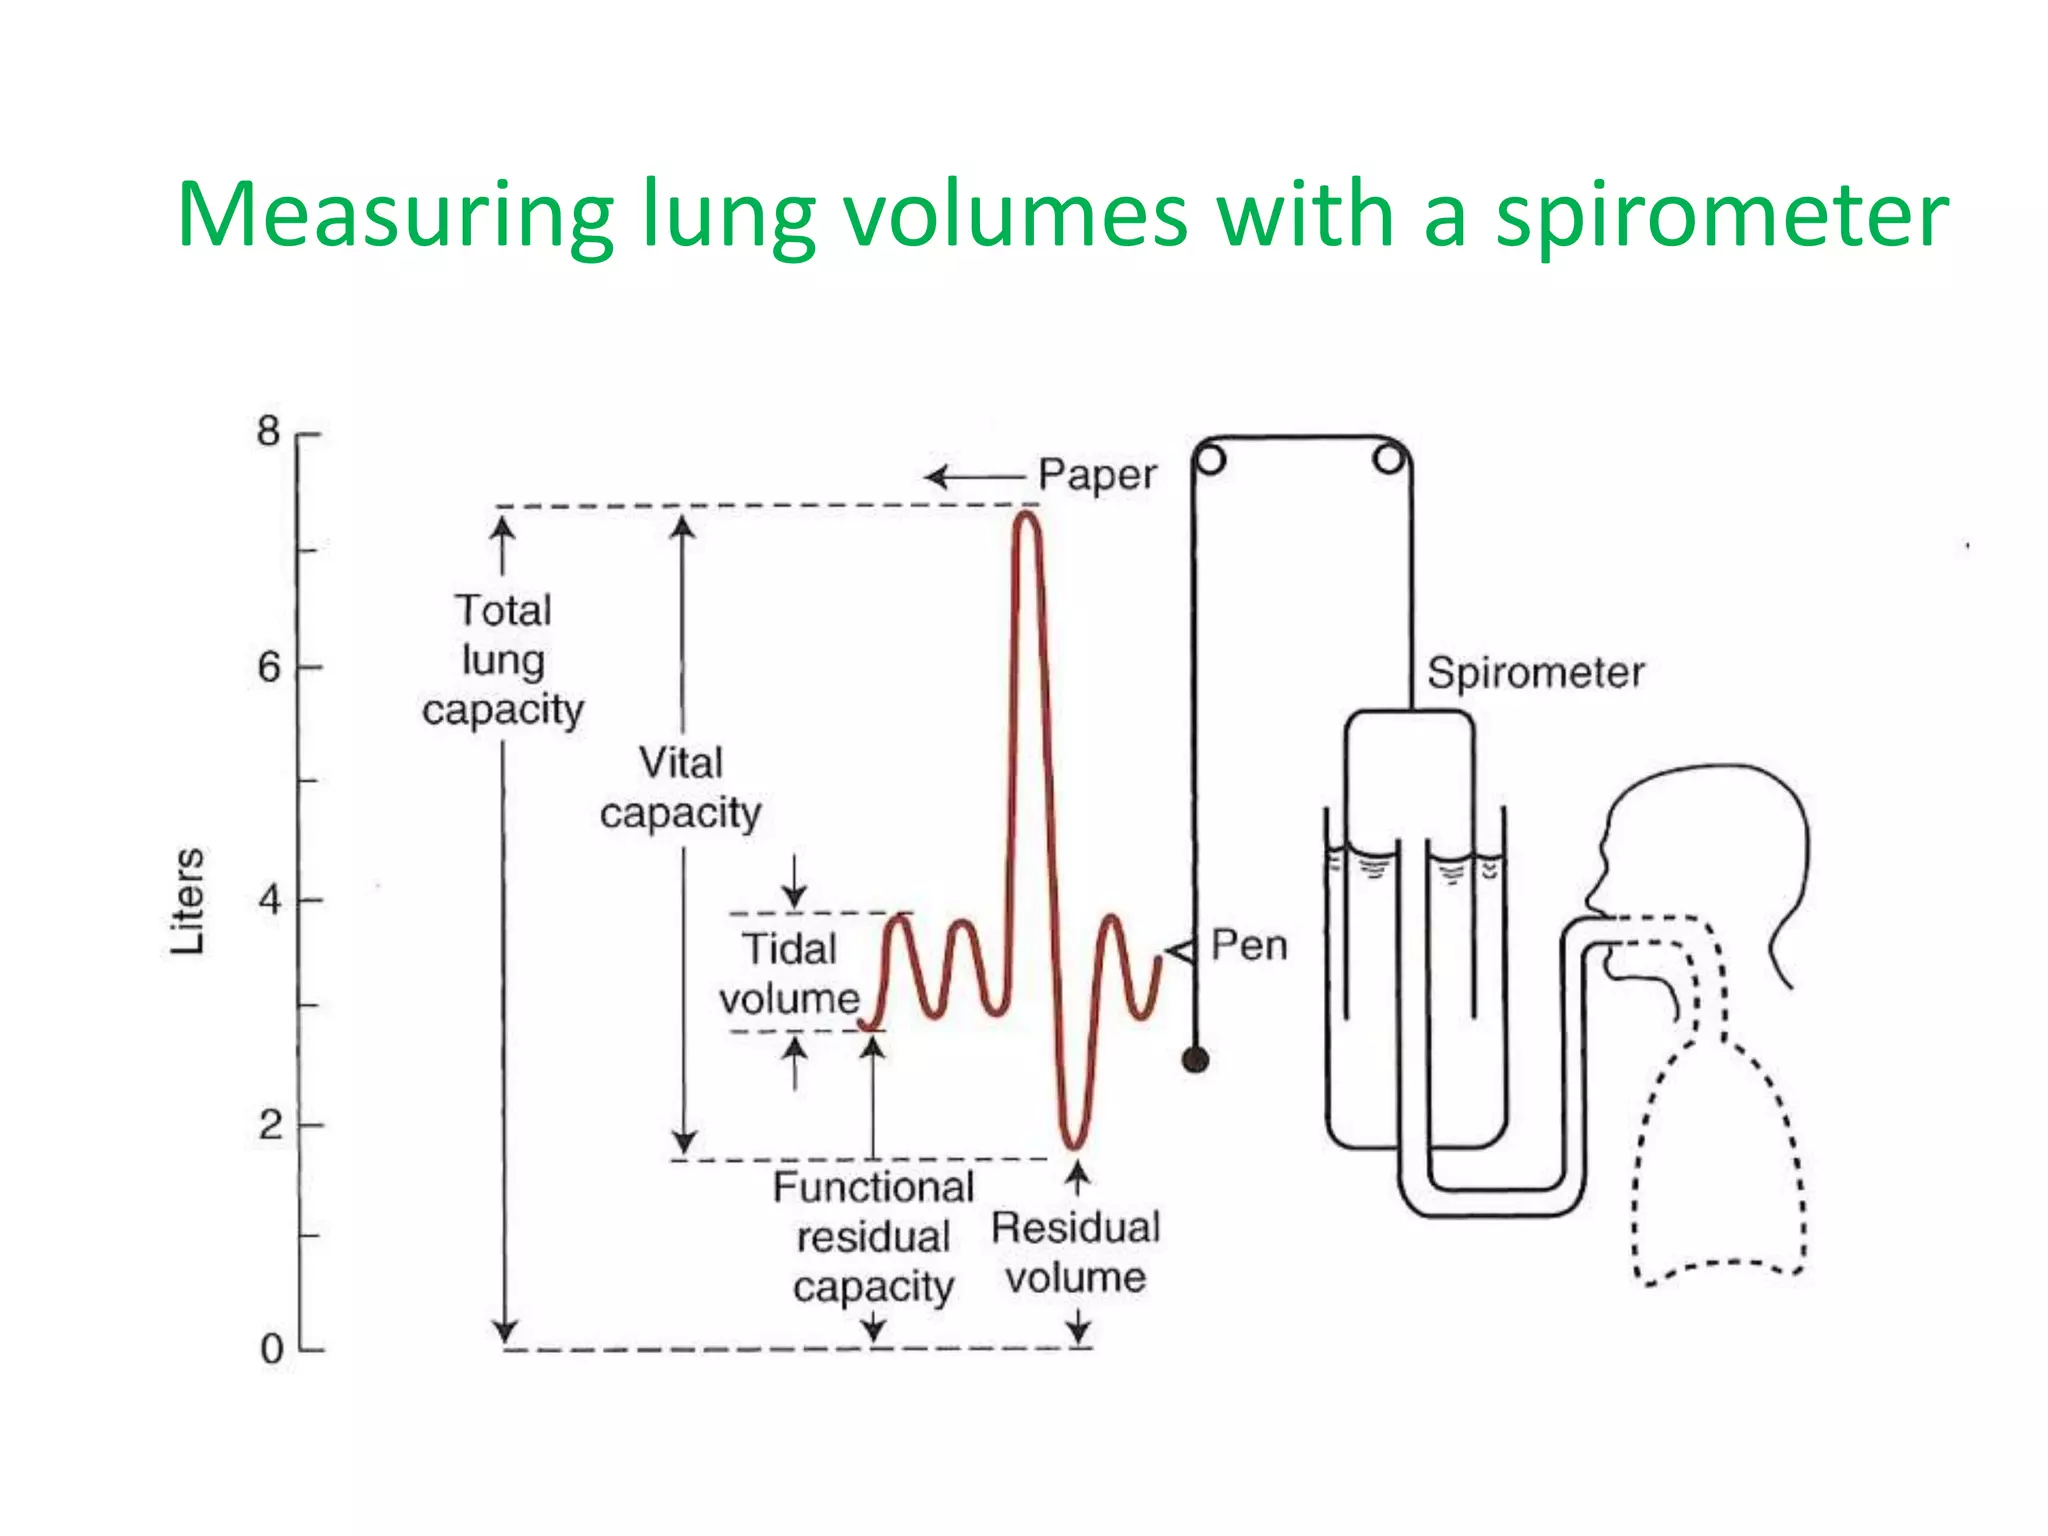
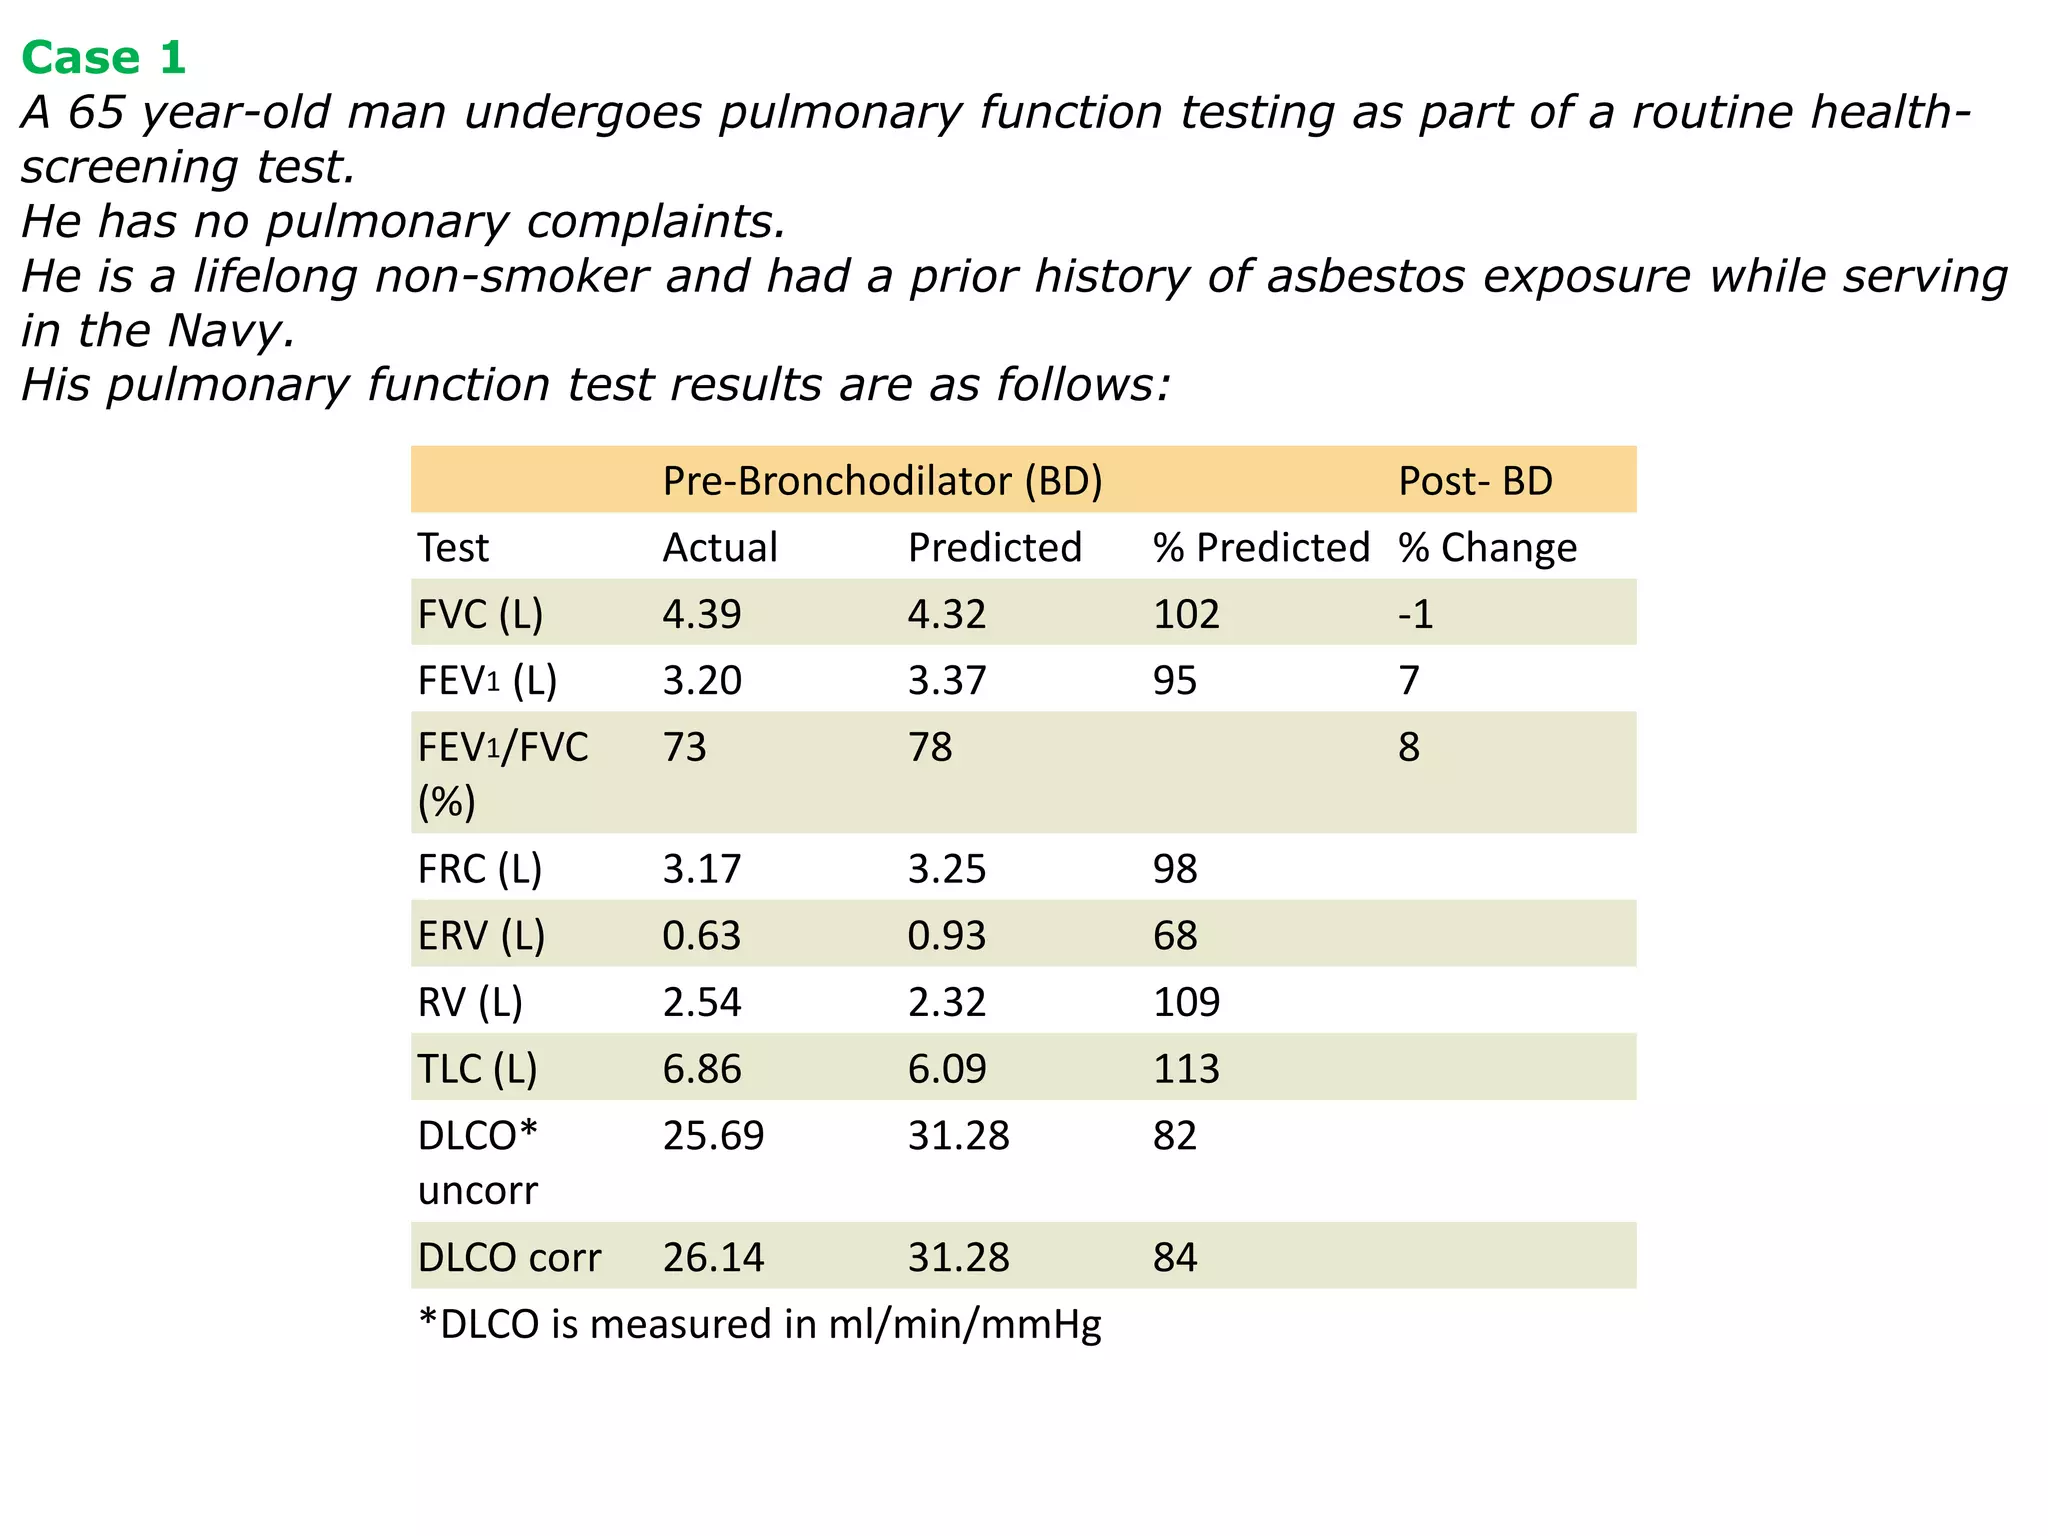
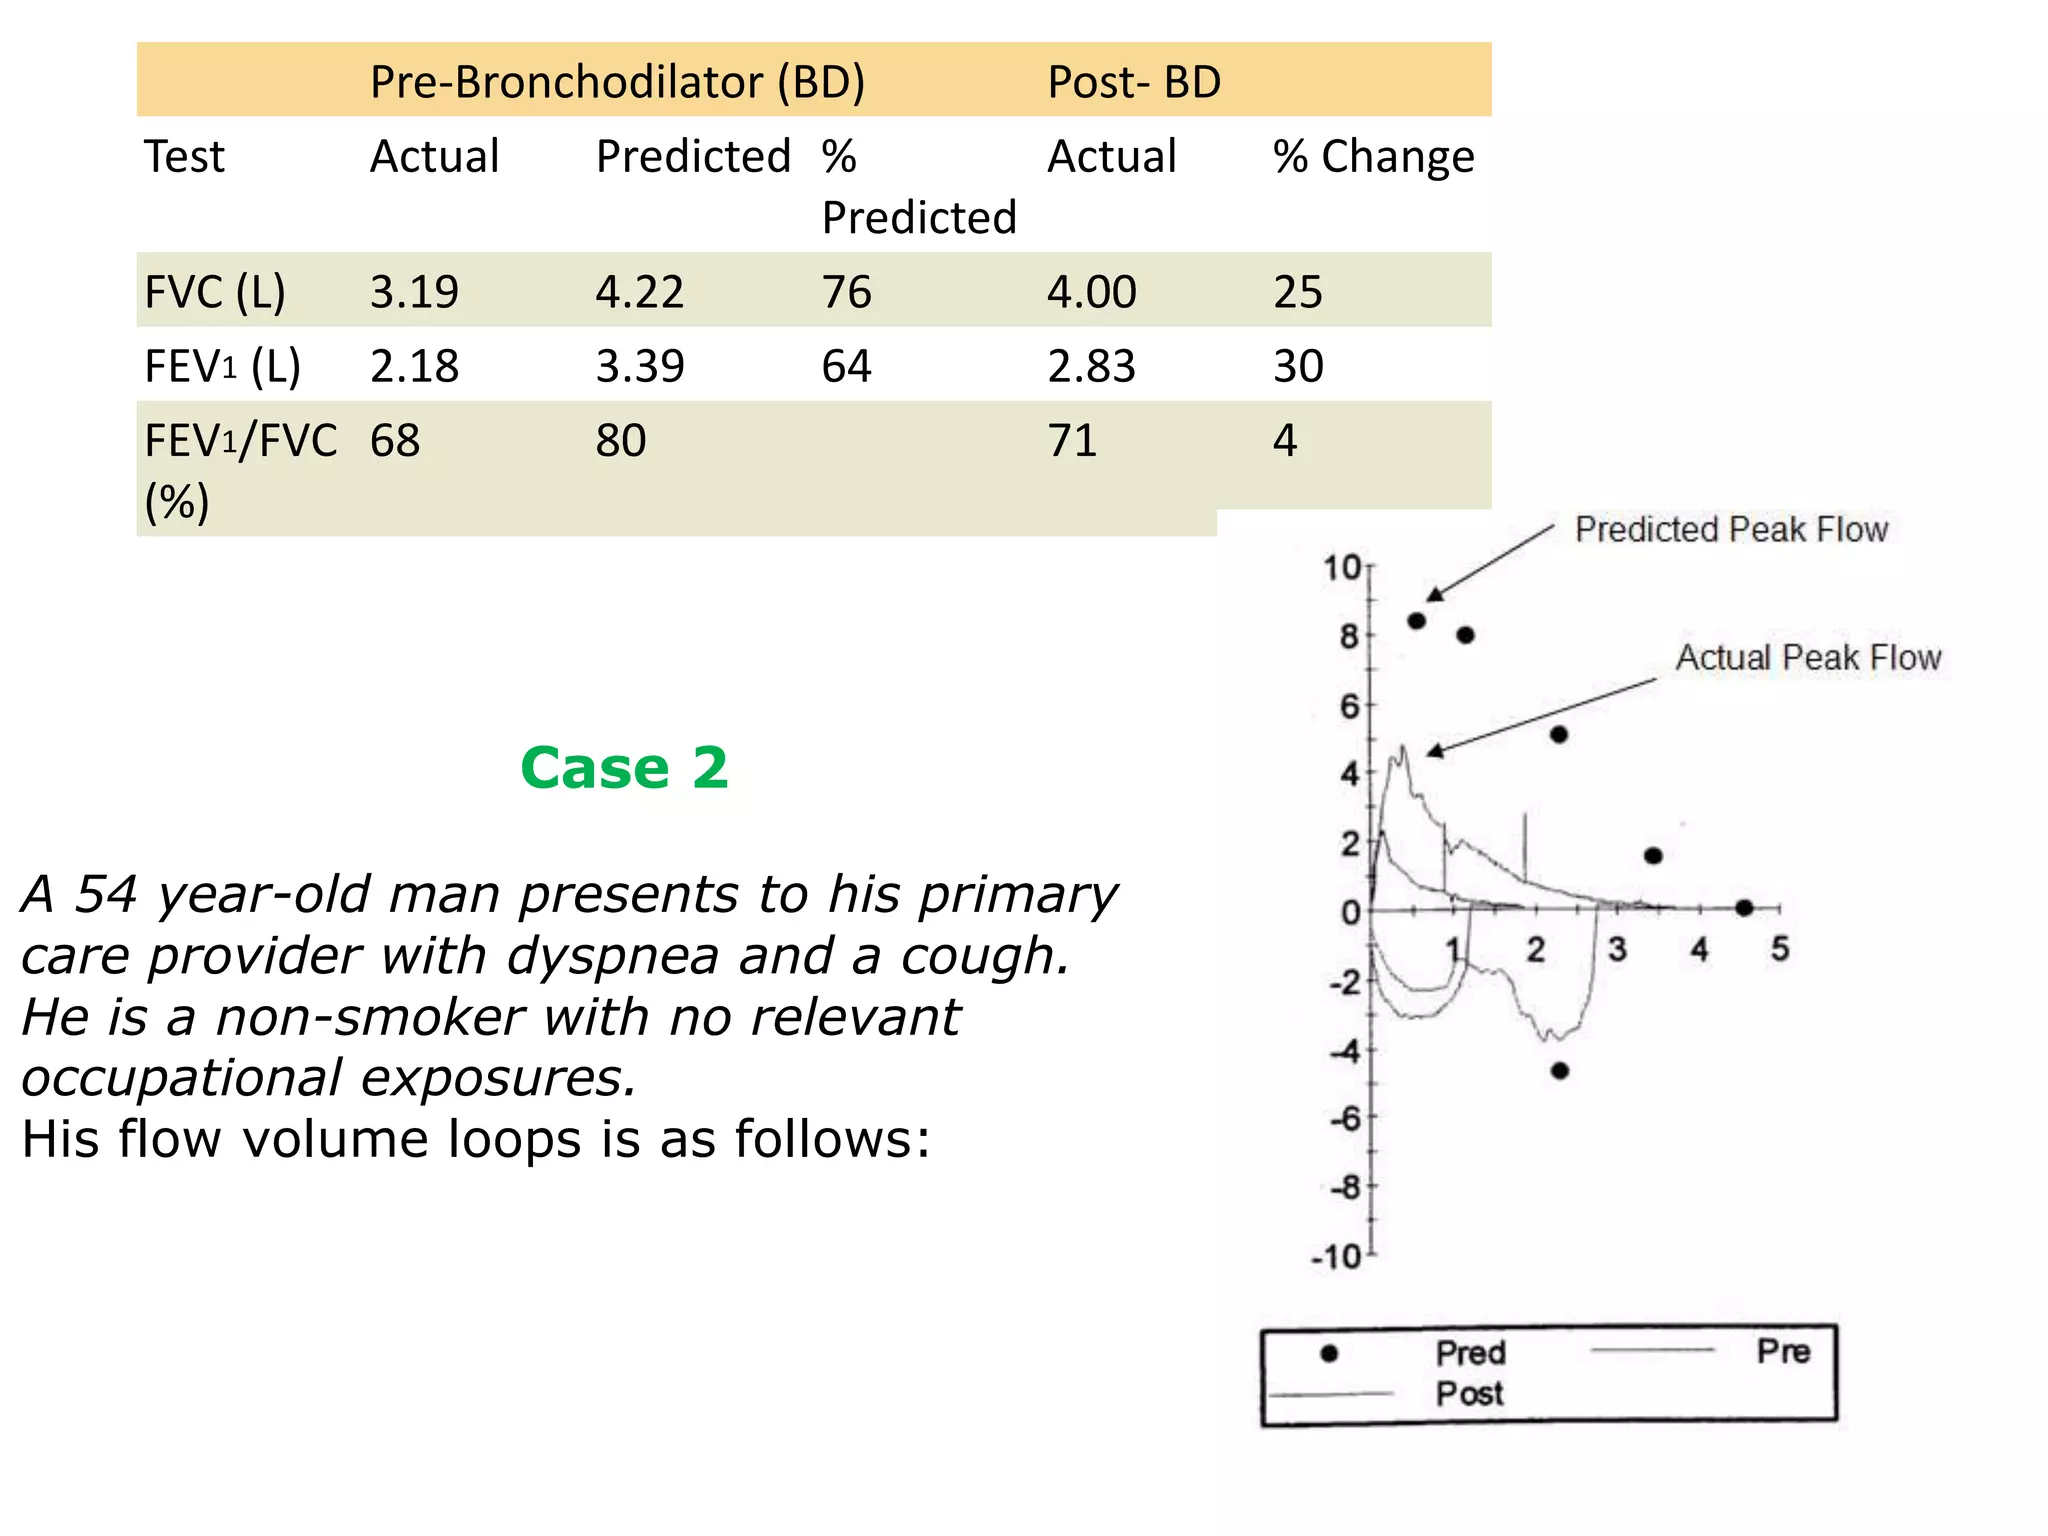
2. It also provides information on measuring lung volumes using spirometry and includes two sample patient cases - one with normal pulmonary function and one with moderate airflow obstruction.
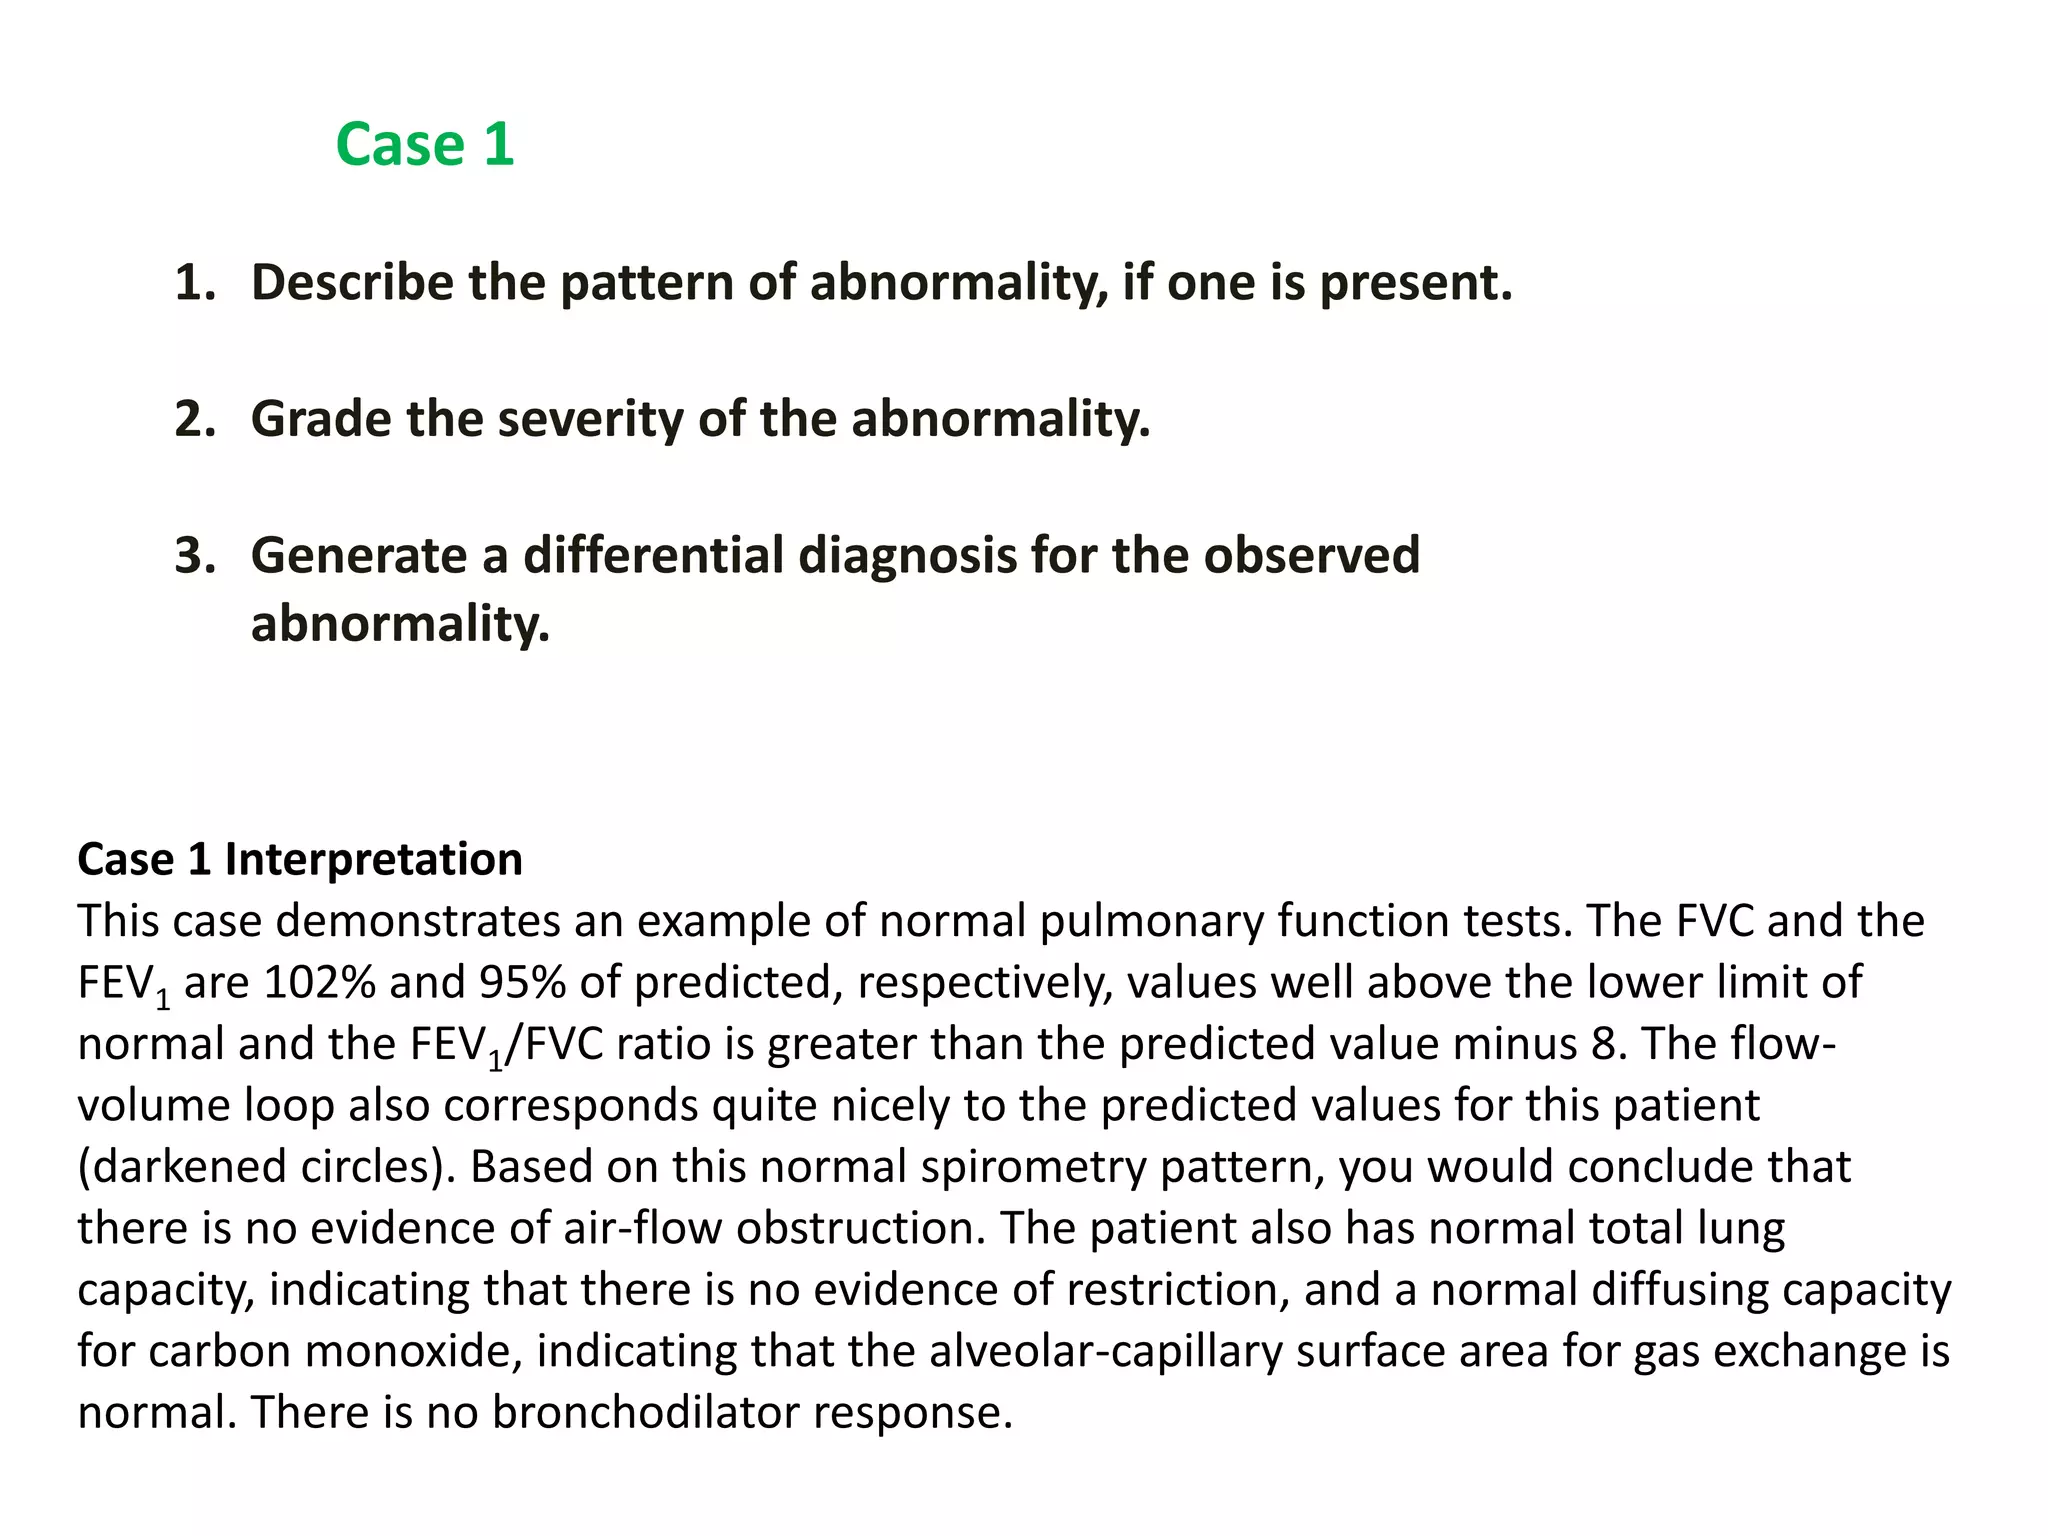
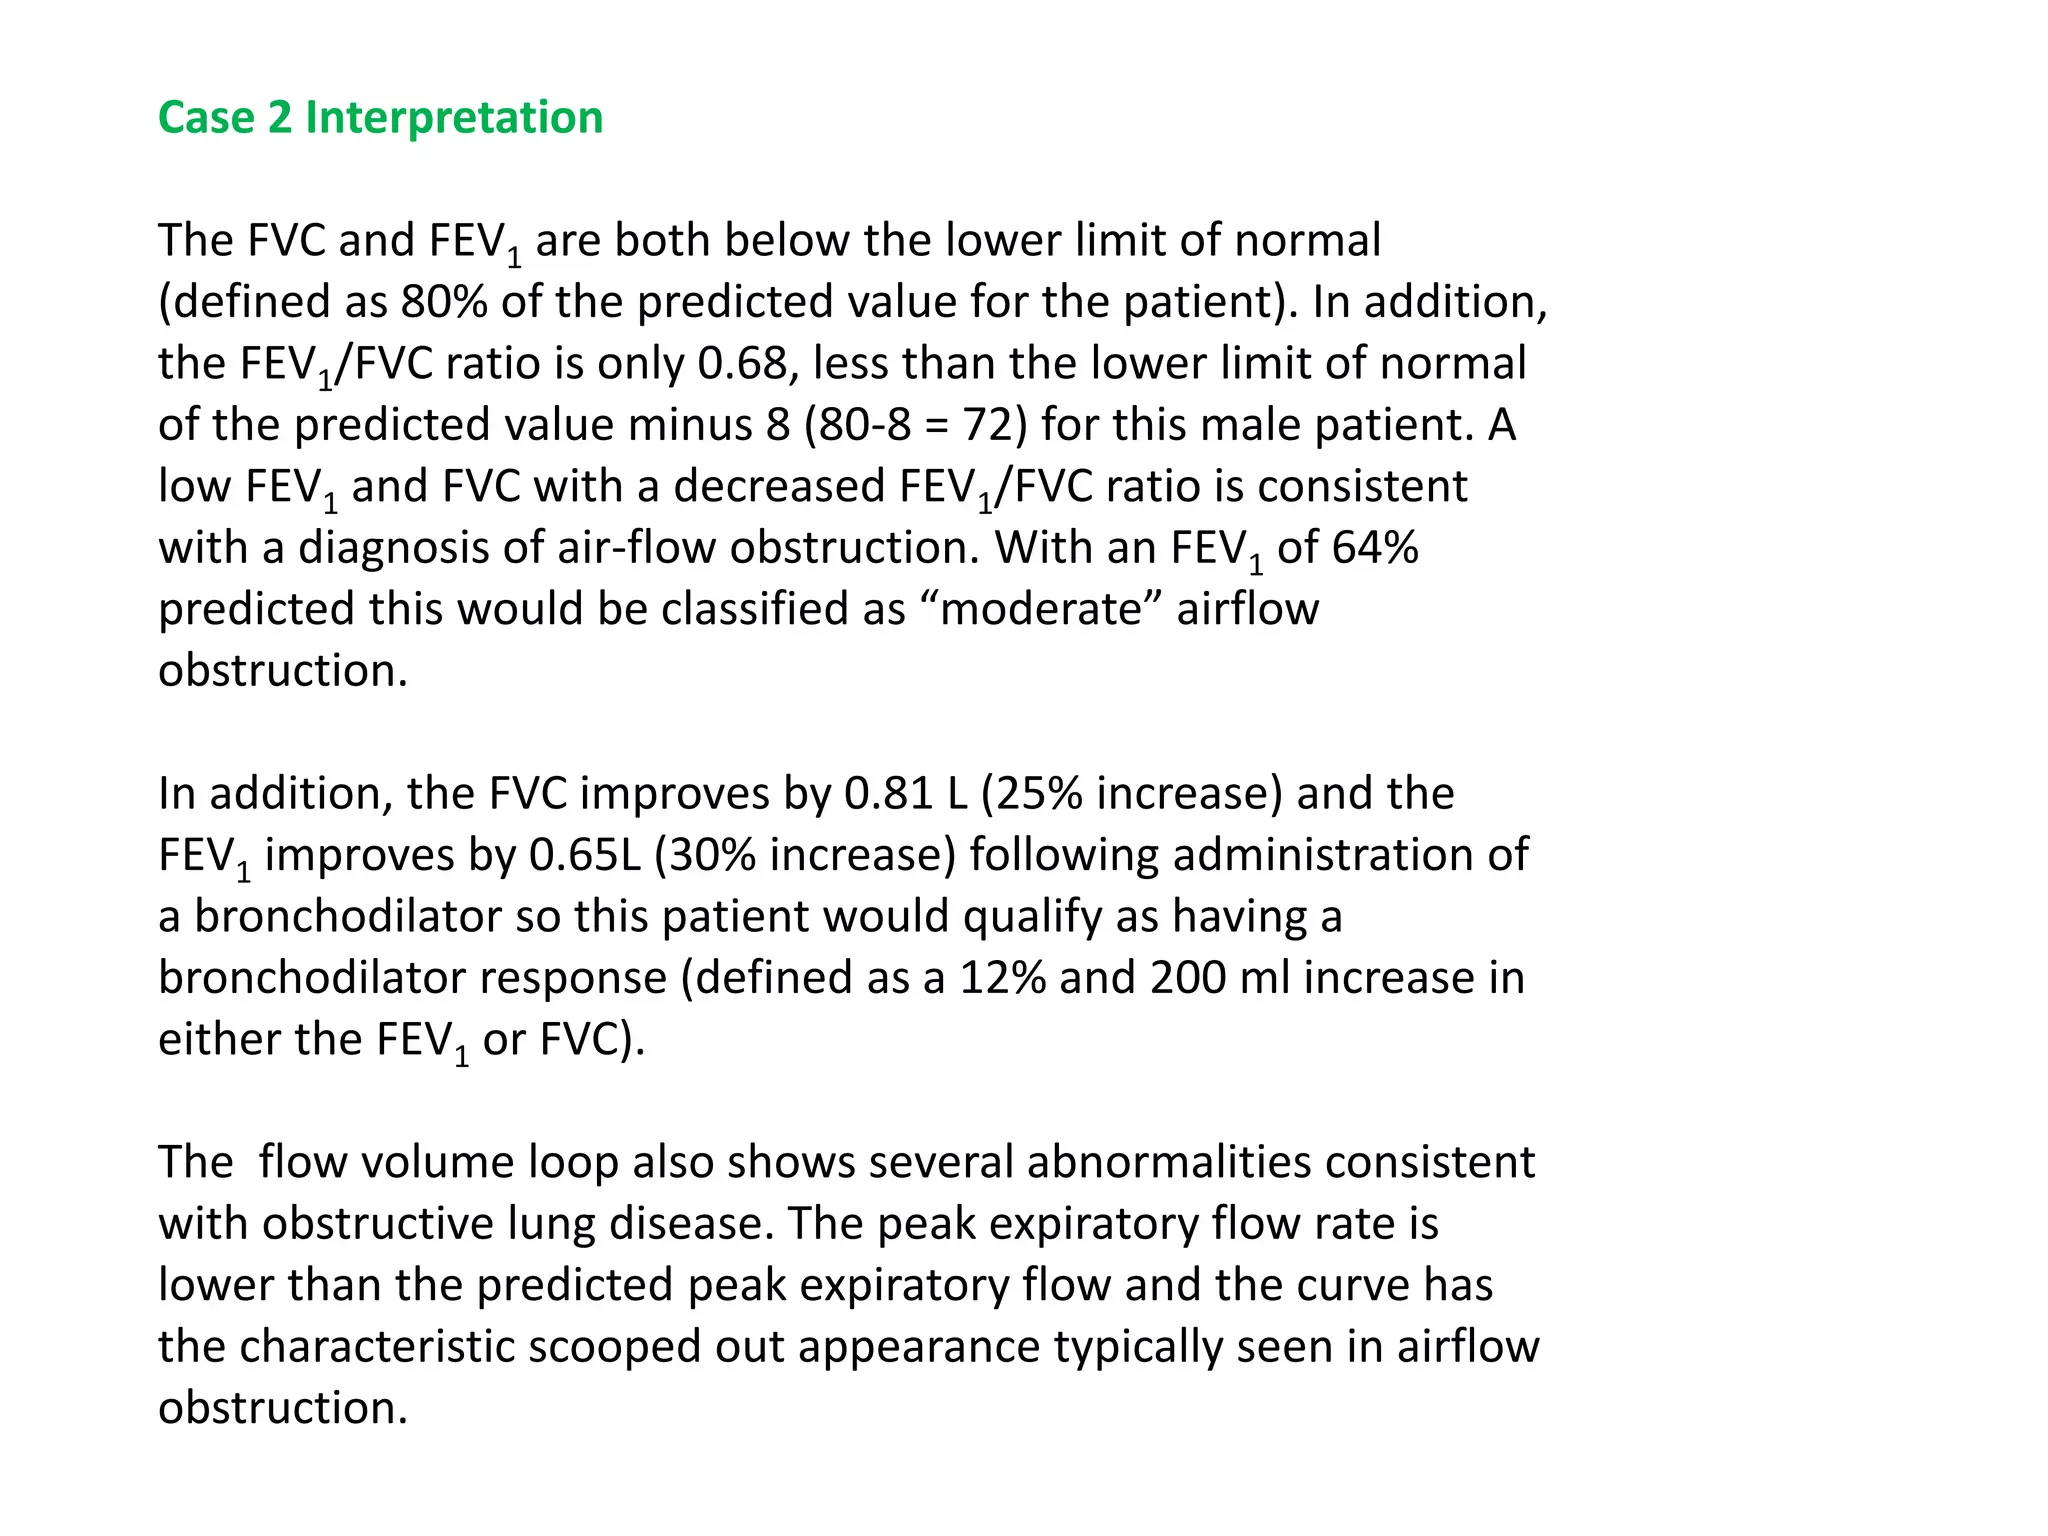
3. The cases demonstrate how to interpret spirometry results and determine the presence, severity, and differential diagnosis of any lung abnormalities.