Downloaded 262 times
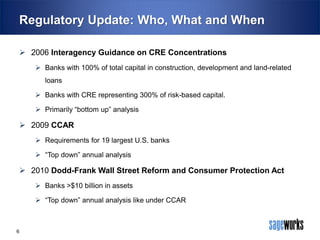
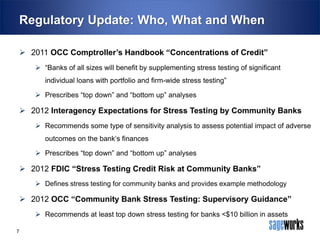
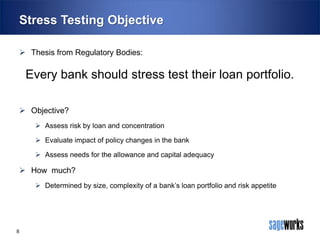
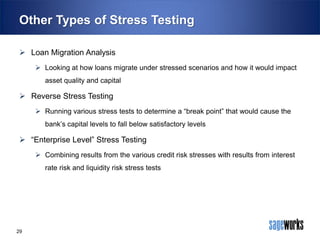
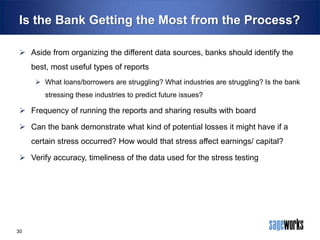


This document summarizes a webinar presented by Mike Lubansky on stress testing loan portfolios. The webinar covered regulatory requirements for stress testing, the objective and importance of stress testing, different types of stress testing approaches for community banks, challenges with data collection, scenario selection, and maximizing the value of stress test reports. Sample stress test outputs were presented and common mistakes were discussed. The webinar provided an overview of effective stress testing practices for community banks.


