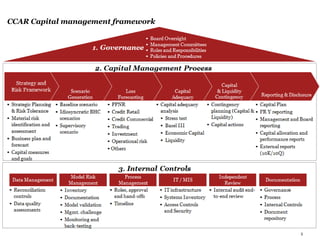
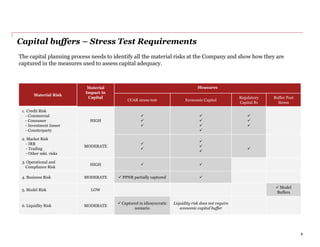
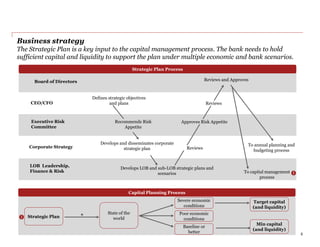
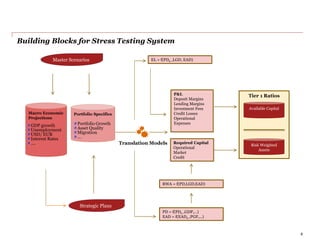
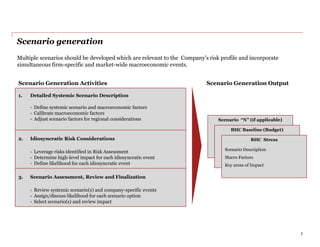
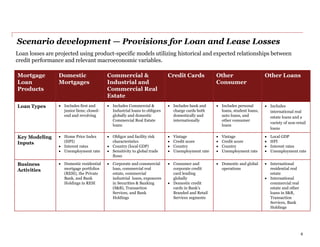
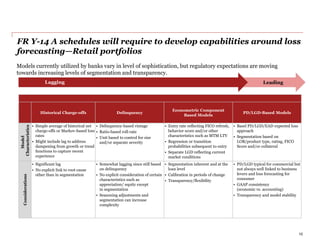
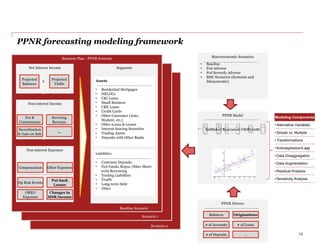
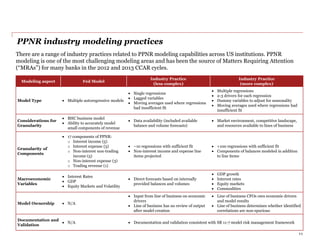
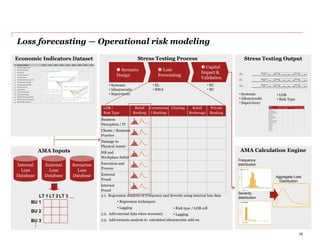
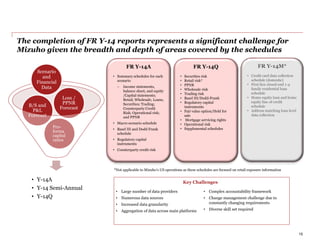
Capital Management and
Stress Test
Capital management framework
3
CCAR Capital management framework
Capital buffers – Stress Test Requirements
Material Risk
Material
Impact in
Capital
Measures
CCAR stress test Economic Capital
Regulatory
Capital B1
Buffer Post
Stress
1. Credit Risk
- Commercial
- Consumer
- Investment Issuer
- Counterparty
HIGH










2. Market Risk
- IRR
- Trading
- Other mkt. risks
MODERATE






3. Operational and
Compliance Risk
HIGH  
4. Business Risk MODERATE  PPNR partially captured 
5. Model Risk LOW
 Model
Buffers
6. Liquidity Risk MODERATE
 Captured in idiosyncratic
scenario
Liquidity risk does not require
economic capital buffer
The capital planning process needs to identify all the material risks at the Company and show how they are
captured in the measures used to assess capital adequacy.
4
CCAR process & stress test overview
The CCAR process is intended to ensure banks hold sufficient capital to continue operating under multiple
stressed scenarios inclusive of any proposed capital action. CCAR warrants comprehensive capital-based stress
testing .
5
Scenarios
Stress Testing
/ Modeling
and Data
Templates
(FRY 14-A, Q
and Ms)
Capital Plan
Document
Baseline
Scenario
Internal Stress
Scenario(s)
Supervisory
Stress Scenario
Loss Estimation
• Credit Risk (by portfolio)
• Trading Risk
9-Quarters Pro Forma
Income Statement
• Loss Estimates.
• Revenue impact.
• Cost Impact
9-Quarters Pro
Forma Balance Sheet
• Retained Earnings
• OCI
• DTA Goodwill
Base and Stress
Capital Ratios
Capital Adequacy Assessment
• AFS/HTM
• Operational Risk
Integrated Stress Testing
• Comprehensive systemic and
idiosyncratic scenarios
• Enterprise-wide consolidated stress
testing
• Dynamic over the course of the next
nine quarters
• Linked to capital adequacy by expecting
Tier 1 common post-stress limits (e.g.,
5% Tier 1 common)
• Incorporates financial forecast of
revenue and expenses
• CCAR data templates and result
disclosures
Single Shock, Risk-Specific Stress
Requirements
• Trading Market Risk
• Credit and Counterparty
• Liquidity/ Funding
• Operational
Business strategy
The Strategic Plan is a key input to the capital management process. The bank needs to hold
sufficient capital and liquidity to support the plan under multiple economic and bank scenarios.
To annual planning and
budgeting process
Defines strategic objectives
and plans
Recommends Risk
Appetite
Develops and disseminates corporate
strategic plan
Develops LOB and sub-LOB strategic plans and
scenarios
Strategic Plan Process
Approves Risk Appetite
Reviews and Approves
Reviews
Reviews
LOB Leadership,
Finance & Risk
Corporate Strategy
Executive Risk
Committee
CEO/CFO
Board of Directors
Strategic Plan
State of the
world
Baseline or
better
Poor economic
conditions
Severe economic
conditions
Min capital
(and liquidity)
Target capital
(and liquidity)
Capital Planning Process
To capital management
process


5
Building Blocks for Stress Testing System
6
Tier 1 Ratios
Master Scenarios
Macro Economic
Projections
GDP growth
Unemployment
USD/ EUR
Interest Rates
....
Portfolio Specifics
Portfolio Growth
Asset Quality
Migration
...
Translation Models
P&L
Deposit Margins
Lending Margins
Investment Fees
Credit Losses
Operational
Expenses
Required Capital
Operational
Market
Credit
Available Capital
Strategic Plans
Risk Weighted
Assets
PD = f(PD0 ,GDP,...)
EAD = f(EAD0 ,PGF,...)
RWA = f(PD,LGD,EAD)
EL = f(PD0 ,LGD, EAD)
Scenario generation
Scenario Generation Activities Scenario Generation Output
1. Detailed Systemic Scenario Description
- Define systemic scenario and macroeconomic factors
- Calibrate macroeconomic factors
- Adjust scenario factors for regional considerations
2. Idiosyncratic Risk Considerations
- Leverage risks identified in Risk Assessment
- Determine high-level impact for each idiosyncratic event
- Define likelihood for each idiosyncratic event
3. Scenario Assessment, Review and Finalization
- Review systemic scenario(s) and company-specific events
- Assign/discuss likelihood for each scenario option
- Select scenario(s) and review impact
Scenario “N” (if applicable)
BHC Baseline (Budget)
BHC Stress
Scenario Description
Macro Factors
Key areas of Impact
Multiple scenarios should be developed which are relevant to the Company’s risk profile and incorporate
simultaneous firm-specific and market-wide macroeconomic events.
7
Scenario development — Provisions for Loan and Lease Losses
Loan losses are projected using product-specific models utilizing historical and expected relationships between
credit performance and relevant macroeconomic variables.
9
Mortgage
Loan
Products
Domestic
Mortgages
Commercial &
Industrial and
Commercial Real
Estate
Credit Cards Other
Consumer
Other Loans
Loan Types  Includes first and
junior liens; closed-
end and revolving
 Includes Commercial &
Industrial loans to obligors
globally and domestic
Commercial Real Estate
loans
 Includes bank and
charge cards both
domestically and
internationally
 Includes personal
loans, student loans,
auto loans, and
other consumer
loans
 Includes
international real
estate loans and a
variety of non-retail
loans
Key Modeling
Inputs
 Home Price Index
(HPI)
 Interest rates
 Unemployment rate
 Obligor and facility risk
characteristics
 Country (local GDP)
 Sensitivity to global trade
flows
 Vintage
 Credit score
 Country
 Unemployment rate
 Vintage
 Credit score
 Country
 Unemployment rate
 Local GDP
 HPI
 Interest rates
 Unemployment rate
Business
Activities
 Domestic residential
mortgage portfolios
(RESI), the Private
Bank, and Bank
Holdings in RESI
 Corporate and commercial
loan, commercial real
estate, commercial
industrial loans, exposures
in Securities & Banking
(S&B), Transaction
Services, and Bank
Holdings
 Consumer and
corporate credit
card lending
globally
 Domestic credit
cards in Bank’s
Branded and Retail
Services segments
 Domestic and global
operations
 International
residential real
estate
 International
commercial real
estate and other
loans in S&B,
Transaction
Services, Bank
Holdings
FR Y-14 A schedules will require to develop capabilities around loss
forecasting—Retail portfolios
Historical Charge-offs Delinquency
Econometric Component
Based Models
PD/LGD-Based Models
Model
Characteristics
• Simple average of historical net
charge-offs or Markov-based loss
rates
• Might include lag to address
dampening from growth or trend
functions to capture recent
experience
• Delinquency-based vintage
• Ratio-based roll-rate
• Unit based to control for size
and/or separate severity
• Entry rate reflecting FICO refresh,
behavior score and/or other
characteristics such as MTM LTV
• Regression or transition
probabilities subsequent to entry
• Separate LGD reflecting current
market conditions
• Basel PD/LGD/EAD expected loss
approach
• Segmentation based on
LOB/product type, rating, FICO
Score and/or collateral
Considerations
• Significant lag
• No explicit link to root cause
other than in segmentation
• Somewhat lagging since still based
on delinquency
• No explicit consideration of certain
characteristics such as
appreciation/ equity except
in segmentation
• Seasoning adjustments and
segmentation can increase
complexity
• Segmentation inherent and at the
loan level
• Calibration in periods of change
• Transparency/flexibility
• PD/LGD typical for commercial but
not always well linked to business
levers and loss forecasting for
consumer
• GAAP consistency
(economic vs. accounting)
• Transparency and model stability
LeadingLagging
Models currently utilized by banks vary in level of sophistication, but regulatory expectations are moving
towards increasing levels of segmentation and transparency.
10
LeadingLagging
FR Y-14 A schedules will require to develop capabilities around loss
forecasting—wholesale portfolios
Top Down Loss Model Simple Delinquency / Rating
Based Portfolio Models
More Sophisticated Flow or
Transition Models
Loan Level Default and Severity
Models
Model Characteristics Model Characteristics Model Characteristics Model Characteristics
• Simple regression of charge-off rate
(gross or net) to macroeconomic
variables
• Might include lag functions
• May be augmented by, or
benchmarked to, call report peer
data
• Rating based PD banding
• Macroeconomic regression of PD
cycle adjustments by rating band
• Separate severity assumption or
model(s)
• May be augmented with vendor data
• Dynamic full risk rating transition
matrix
• Various options for regressing /
estimating rates as a function of
macroeconomic inputs
• Separate severity assumption or
model(s)
• Can be augmented with vendor data
• Predict default probability and/or
loss severity as a function of loan
level characteristic data and
macroeconomic inputs
• Often leverages vendor models
calibrated to pooled data sets
Considerations Considerations Considerations Considerations
• Longer time series available
• Useful benchmark model
• Limited segmentation
• Implicit but not explicit reflection of
the portfolio condition at the
forecast start date (e.g., delinquency
pipeline)
• Lags many CCAR banks
• Within range of broader current
practices of CCAR banks
• Relatively robust and transparent
• Only marginally more data intensive
than top down loss model
• Separates frequency and severity
• Implicit, not explicit transition
modeling (requires additional
transformation to quarterly
defaults)
• Limited vendor-based data specific
to CRE
• Explicit modeling of defaults and
timing of loss
• More consistent with leading
industry approach for commercial
• Much more data intensive (loan
level vs. summary level)
• More complex modeling concepts
• May sacrifice some transparency /
flexibility
• Limited vendor-based data specific
to CRE
• Incorporates loan specific drivers
• Increased segmentation inherent in
models
• Much more data intensive – very
few companies with sufficient
internal data to develop / validate
• Much more complex modeling
concepts
• Vendor models gaining more
traction; initial and on-going
licensing costs, however and some
lack of transparency
LeadingLagging
Vendor Solutions available for Credit loss forecasting
LeadingLagging
The following is a representative, but not necessarily comprehensive list of vendor solutions and data sets that
can be used to augment the credit modeling
12
Economic Data Portfolio & Loan Level Credit Data Pooled Default and Recovery Data
Representative Vendors / Data Model Characteristics Model Characteristics
• Moody’s Analytics, CreditCycle & Economy.Com (Moody’s
specific scenarios and Fed scenarios)
• FHLB regional economic reports (historical)
• FRB/FFIEC– Macro Economic Data and Consumer Macro
Performance Data
• Credit Bureaus – Consumer Credit Data
• NAR – Residential Mortgage Macro Performance Data
• S&P Case-Shiller Home Price Indices
• S&P Credit Models & Capital Stress Test services
• CoreLogic
• Argus Information Services & Predictive Analytics
• Oracle OFSAA
• Axiom
• SNL Call Report Data (e.g., balances, 30-89,
90+, charge-off, recovery data for major
product segments)
• RMBS, CMBS Securitization data
• Delinquency and flow rates, defaults, write-
offs and charge-offs, recoveries and net-
losses, prepayments
• Scoring metrics
• Loan to value, debt-to-income ratios, credit
limits and usage
• Application volume, marketing activity,
collection treatments
• ADCO & Intex
• Moody’s DRD (corporate default and
recovery data)
• Moody’s CRD (private firm financial and
EDF data)
• Moody’s LGD data (recovery database)
Considerations Considerations Considerations
• Moody’s develops full “economies” under both proprietary
scenarios (S1-S5) and Fed scenarios
• Useful for utilizing regional inputs or deriving derivative
indices from the limited set of variables forecast by the Fed
• Useful for augmenting internal data when
developing top down loss models, or serving
as a benchmark to more sophisticated
models (i.e., sanity check)
• Useful for augmenting internal rating
and recovery data in developing
proprietary (internal) rating index or
transition matrix based methods
Scenario development — Trading and Counterparty Losses
Trading and counterparty losses represent losses on Bank’s trading portfolios, CVA, and other mark-to-market
assets, inclusive of default losses.
.
8
Integrated Risk and Capital decision reporting
12
Key Risk Indicators Current Prior Trend
vs. Tolerance /
Target
Score Benchmarking
Credit
Mortgages
HELOC
Auto Loans
Credit Cards
Other
Consumer
C&I
CRE
Market
Opera-
tional
RISK
 Credit
 Market
 Investment
 Operational
CAPITAL
 Capital Ratios
 Basel III
 Capital
Actions
EARNINGS
LIQUIDITY
 Liquidity
Ratios
 Basel III
 Contingency
Actions
 Revenue
 Expenses
 PPNR
 Profitability
Risk BASELINE STRESSED
S 1 S 2 S 3 S 4 S 5 BenchmarkingKey Risk Indicators
Baseline Stressed
Current Prior Trend
vs.
Tolerance/Target
Score Benchmarking S1 S2 S3 S4 S5 Benchmarking
Capital reporting should include baseline and stressed views of KRIs.
PPNR forecasting modeling framework
Business Plan - PPNR Forecast
Business Plan - PPNR Forecast Macroeconomic Scenarios
• Baseline
• Fed Adverse
• Fed Severely Adverse
• BHC Scenarios (Systemic and
Idiosyncratic)
PPNR Model
Estimated Regression Coefficients
PPNR Drivers
Net Interest Income
Projected
Balances
Projected
Yields
Non-interest Income
Non-interest Expenses
+
-
Compensation
Op Risk Events
Put‐back
Losses
OREO
Expenses
Changes in
MSR Income
Other Expenses
x
Fee &
Commissions
Securitization
& Gain on Sale
…
Servicing
Revenue
Segments
Baseline Scenario
Scenario 1
Scenario 2
Balances Originations
# of Accounts # of Loans
Assets
• Residential Mortgages
• HELOCs
• C&I Loans
• Small Business
• CRE Loans
• Credit Cards
• Other Consumer (Auto,
Student, etc.)
• Other Loans & Leases
• Interest-bearing Securities
• Trading Assets
• Deposits with Other Banks
Liabilities
• Customer Deposits
• Fed Funds, Repos, Other Short-
term Borrowing
• Trading Liabilities
• TruPS
• Long-term Debt
• Other
# of Deposits …
Modeling Components
• Alternative Variables
• Simple vs. Multiple
• Transformations
• Autoregression/Lags
• Data Disaggregation
• Data Augmentation
• Residual Analysis
• Sensitivity Analysis
13
Modeling aspect Fed Model
Industry Practice
(less complex)
Industry Practice
(more complex)
Model Type  Multiple autoregressive models
 Single regressions
 Lagged variables
 Moving averages used where regressions
had insufficient fit
 Multiple regressions
 2-3 drivers for each regression
 Dummy variables to adjust for seasonality
 Moving averages used where regressions had
insufficient fit
Considerations for
Granularity
 BHC business model
 Ability to accurately model
small components of revenue
 Data availability (included available
balance and volume forecasts)
 Market environment, competitive landscape,
and resources available to lines of business
Granularity of
Components
 17 components of PPNR:
o Interest income (5)
o Interest expense (3)
o Non-interest non-trading
income (5)
o Non-interest expense (3)
o Trading revenue (1)
 ~10 regressions with sufficient fit
 Non-interest income and expense line
items projected
 +100 regressions with sufficient fit
 Components of balances modeled in addition
to line items
Macroeconomic
Variables
 Interest Rates
 GDP
 Equity Markets and Volatility
 Direct forecasts based on internally
provided balances and volumes
 GDP growth
 Interest rates
 Equity markets
 Commodities
Model Ownership  N/A
 Input from line of business on economic
drivers
 Line of business has no review of output
after model creation
 Line of business CFOs own economic drivers
and model results
 Line of business determines whether identified
correlations are non-spurious
Documentation and
Validation
 N/A  Documentation and validation consistent with SR 11-7 model risk management framework
There are a range of industry practices related to PPNR modeling capabilities across US institutions. PPNR
modeling is one of the most challenging modeling areas and has been the source of Matters Requiring Attention
(“MRAs”) for many banks in the 2012 and 2013 CCAR cycles.
PPNR industry modeling practices
11
Loss forecasting — Operational risk modeling
2.1. Regression Analysis of Frequency and Severity using internal loss data
• Regression techniques
• Lagging
2.2. Add external data when necessary
2.3. Add scenario analysis to calculated idiosyncratic add-on
Economic Indicators Dataset
LOB /
Risk Type
Retail
Banking
Commercia
l Banking
Clearing Retail
Brokerage
Private
Banking
Business
Disruption / IT
Clients / Business
Practice
Damage to
Physical Assets
HR and
Workplace Safety
Execution and
Process
External
Fraud
Internal
Fraud
# Economic Factors 4Q’11 1Q’12 2Q’12 3Q’12 4Q’12 1Q’12 2Q’13 3Q’13 4Q’13
1 RealGDPchange (% YoY)
2 Unemploymentrate
3 Inflation(%)
4 Personalsavingsrate
5 House price index
6 Consumerdebttoincome ratio
7 Personalbankruptcyfiling
8 Businessbankruptcyfiling
9 Prime interestrate
10 3-MonthLibor
11 10-YearTreasury Note
12 Vehicle Sales(millions)
13 S&P500 Index (endof period)
14 NationalConsumerloangrowth
15 NationalC&Iloan growth
AMA Inputs
BU 1
BU 2
BU 3...
LT 1 LT 2LT 3 …
Internal
Loss
Database
External
Loss
Database
Scenarios
Loss
Database
AMA Calculation Engine
Frequency
distribution
Severity
distribution
Aggregate Loss
Distribution
 Scenario
Design
 Loss
Forecasting
 Capital
Impact &
Validation
• Systemic
• Idiosyncratic
• Supervisory
• EL
• RWA
• EC
• RC
• Risk type / LOB cell
• Lagging
Stress Testing Output
Scenario1 2010Amountin$Mil
BHCBaseline Q42010 Q12011 Q22011 Q32011 Q42011 Q12012 Q22012 Q32012 Q42012
ProjectedOperational RiskLosses
Scenario2 2010Amountin$Mil
BHCStress Q42010 Q12011 Q22011 Q32011 Q42011 Q12012 Q22012 Q32012 Q42012
ProjectedOperational RiskLosses
Scenario3 2010Amountin$Mil
SupervisoryStress Q42010 Q12011 Q22011 Q32011 Q42011 Q12012 Q22012 Q32012 Q42012
ProjectedOperational RiskLosses
2011Amountin$Mil 2012Amountin$Mil
• Systemic
• Idiosyncratic
• Supervisory
LOB /
Risk Type
Retail
Banking
Commercial
Banking
Clearing Retail
Brokerage
Private
Banking
Business
Disruption/ IT
Clients / Business
Practice
Damage to
Physical Assets
HR and
Workplace Safety
Executionand
Process
External
Fraud
Internal
Fraud
• LOB
• Risk Type
Stress Testing Process
16
Pro-
forma
capital
ratios
B/S and
P&L
Forecast
Loss /
PPNR
Forecast
Scenario
and
Financial
Data
The completion of FR Y-14 reports represents a significant challenge for
Mizuho given the breadth and depth of areas covered by the schedules
FR Y-14M*
• Credit card data collection
schedule (domestic)
• First lien closed-end 1-4
family residential loan
schedule
• Home equity loan and home
equity line of credit
schedule
• Address matching loan level
data collection
FR Y-14Q
• Securities risk
• Retail risk*
• PPNR
• Wholesale risk
• Trading risk
• Basel III/Dodd-Frank
• Regulatory capital
instruments
• Fair value option/Held for
sale
• Mortgage servicing rights
• Operational risk
• Supplemental schedules
FR Y-14A
• Summary schedules for each
scenario
– Income statements,
balance sheet, and equity
/Capital statements;
Retail, Wholesale, Loans,
Securities; Trading;
Counterparty Credit
Risk; Operational risk;
and PPNR
• Macro scenario schedule
• Basel III and Dodd Frank
schedule
• Regulatory capital
instruments
• Counterparty credit risk
15
*Not applicable to Mizuho’s US operations as these schedules are focused on retail exposure information
• Large number of data providers
• Numerous data sources
• Increased data granularity
• Aggregation of data across main platforms
• Complex accountability framework
• Change management challenge due to
constantly changing requirements
• Diverse skill set required
• Y-14A
• Y-14 Semi-Annual
• Y-14Q
Key Challenges
The completion of FR Y-14 and other material regulatory filings is
supported by over 3,000 data attributes across 16 categories
16
Below is the approximate count of total data attributes, by different product type, used to build a data platform
with the capabilities to address external regulatory reports and internal management reports/analytics
# Type of Product
Approximate # of
data attributes
10 Repo 175+
11 Equities 50+
12 Forex 20+
Mitigants
13 Guarantees 175+
14 Credit derivatives 75+
15 Collaterals 50+
Financial Data
16 GL data 25+
# Type of Product
Approximate # of
data attributes
1 Loan contracts 450+
2 Investments 350+
3 Overdraft accounts 325+
4 Options 300+
5 Swaps 300+
6 Futures 250+
7 Money market contracts 200+
8 Bills 200+
9 Letters of Credit 175+
Stress test aggregation solution functionality overview
The stress test platform requires a consolidated baseline forecast with aggregated incremental
stress impacts, determined at each business unit/portfolio and at the aggregate enterprise level,
to produce a set of pro forma stressed financials.
Baseline Income Statement
Q1 Q2 Q3 Q4 Q1 Q2 Q3 Q4
($MM)
Revenue:
1 Fee revenue
Net interest revenue:
2 Interest revenue
3 Interest expense
4 Net interest revenue - - - - - - - -
5 Total revenue - - - - - - - -
6 Operating expenses
7 Pre-provision net revenue - - - - - - - -
Losses:
8 Loan losses
Investment portfolio (OTTI):
9 AFS
10 HTM
11 Total OTTI - - - - - - - -
12 Trading losses
13 Counterparty losses
14 Operational/fiduciary
15 Off-balance sheet
16 Total losses - - - - - - - -
17 Taxes
18 Extraordinary items, net of tax
19 Net income - - - - - - - -
2011 2012
Baseline Balance Sheet
Q1 Q2 Q3 Q4 Q1 Q2 Q3 Q4
($MM)
Assets:
1 Cash and due from banks
2 Interest-bearing deposits with banks
3 Securities purchased under resale agreements
4 Trading account assets
5 AFS investment securities
6 HTM investment securities
7 Loans and leases
8 Goodwill and other intangible assets
9 Other assets
10 Total assets - - - - - - - -
Liabilities:
11 Deposits
12 Securities sold under repurchase agreements
13 Federal funds purchased
14 Short-term borrowings
15 Accrued expenses and other liabilities
16 Long-term debt
17 Total liabilities - - - - - - - -
Shareholders' Equity:
18 Preferred stock + surplus
19 Common stock + surplus
20 Retained earnings
21 Accumulated other comprehensive income
22 Treasury stock
23 Total shareholders' equity - - - - - - - -
24 Total liabilities and shareholders' equity - - - - - - - -
Off-balance sheet:
25 Commitments and contingencies
2011 2012
Baseline
Summary Income Statement - Scenario 1
Q1 Q2 Q3 Q4 Q1 Q2 Q3 Q4
($MM)
Revenue:
1 Fee revenue - - - - - - - -
Net interest revenue:
2 Interest revenue - - - - - - - -
3 Interest expense - - - - - - - -
4 Net interest revenue - - - - - - - -
5 Total revenue - - - - - - - -
6 Operating expenses - - - - - - - -
7 Pre-provision net revenue - - - - - - - -
Losses:
8 Loan losses - - - - - - - -
Investment portfolio (OTTI):
9 AFS - - - - - - - -
10 HTM - - - - - - - -
11 Total OTTI - - - - - - - -
12 Trading losses - - - - - - - -
13 Counterparty losses - - - - - - - -
14 Operational/fiduciary - - - - - - - -
15 Off-balance sheet - - - - - - - -
16 Total losses - - - - - - - -
17 Taxes - - - - - - - -
18 Extraordinary items, net of tax - - - - - - - -
19 Net income - - - - - - - -
2011 2012
Summary Balance Sheet - Scenario 1
Q1 Q2 Q3 Q4 Q1 Q2 Q3 Q4
($MM)
Assets:
1 Cash and due from banks - - - - - - - -
2 Interest-bearing deposits with banks - - - - - - - -
3 Securities purchased under resale agreements - - - - - - - -
4 Trading account assets - - - - - - - -
5 AFS investment securities - - - - - - - -
6 HTM investment securities - - - - - - - -
7 Loans and leases - - - - - - - -
8 Goodwill and other intangible assets - - - - - - - -
9 Other assets - - - - - - - -
10 Total assets - - - - - - - -
Liabilities:
11 Deposits - - - - - - - -
12 Securities sold under repurchase agreements - - - - - - - -
13 Federal funds purchased - - - - - - - -
14 Short-term borrowings - - - - - - - -
15 Accrued expenses and other liabilities - - - - - - - -
16 Long-term debt - - - - - - - -
17 Total liabilities - - - - - - - -
Shareholders' Equity:
18 Preferred stock + surplus - - - - - - - -
19 Common stock + surplus - - - - - - - -
20 Retained earnings - - - - - - - -
21 Accumulated other comprehensive income - - - - - - - -
22 Treasury stock - - - - - - - -
23 Total shareholders' equity - - - - - - - -
24 Total liabilities and shareholders' equity - - - - - - - -
Off-balance sheet:
25 Commitments and contingencies - - - - - - - -
2011 2012
Stressed Pro Forma
BU 1 Stress Losses - Scenario 1
Q1 Q2 Q3 Q4 Q1 Q2 Q3 Q4
($MM)
Revenue:
1 Fee revenue
Net interest revenue:
2 Interest revenue
3 Interest expense
4 Net interest revenue - - - - - - - -
5 Total revenue - - - - - - - -
6 Operating expenses
7 Pre-provision net revenue - - - - - - - -
Losses:
8 Loan losses
Investment portfolio (OTTI):
9 AFS
10 HTM
11 Total OTTI - - - - - - - -
12 Trading losses
13 Counterparty losses
14 Operational/fiduciary
15 Off-balance sheet
16 Total losses - - - - - - - -
17 Taxes
18 Extraordinary items, net of tax
19 Net income - - - - - - - -
2011 2012
Source Reports
BU 1 Stress Losses - Scenario 1
Source Reports
Q1 Q2 Q3 Q4 Q1 Q2 Q3 Q4
($MM)
Assets:
1 Cash and due from banks
2 Interest-bearing deposits with banks
3 Securities purchased under resale agreements
4 Trading account assets
5 AFS investment securities
6 HTM investment securities
7 Loans and leases
8 Goodwill and other intangible assets
9 Other assets
10 Total assets - - - - - - - -
Liabilities:
11 Deposits
12 Securities sold under repurchase agreements
13 Federal funds purchased
14 Short-term borrowings
15 Accrued expenses and other liabilities
16 Long-term debt
17 Total liabilities - - - - - - - -
Shareholders' Equity:
18 Preferred stock + surplus
19 Common stock + surplus
20 Retained earnings
21 Accumulated other comprehensive income
22 Treasury stock
23 Total shareholders' equity - - - - - - - -
24 Total liabilities and shareholders' equity - - - - - - - -
Off-balance sheet:
25 Commitments and contingencies
2011 2012
Corporate
BU 1 Stress Losses - Scenario 1
Q1 Q2 Q3 Q4 Q1 Q2 Q3 Q4
($MM)
Revenue:
1 Fee revenue
Net interest revenue:
2 Interest revenue
3 Interest expense
4 Net interest revenue - - - - - - - -
5 Total revenue - - - - - - - -
6 Operating expenses
7 Pre-provision net revenue - - - - - - - -
Losses:
8 Loan losses
Investment portfolio (OTTI):
9 AFS
10 HTM
11 Total OTTI - - - - - - - -
12 Trading losses
13 Counterparty losses
14 Operational/fiduciary
15 Off-balance sheet
16 Total losses - - - - - - - -
17 Taxes
18 Extraordinary items, net of tax
19 Net income - - - - - - - -
2011 2012
Source Reports
BU 1 Stress Losses - Scenario 1
Source Reports
Q1 Q2 Q3 Q4 Q1 Q2 Q3 Q4
($MM)
Assets:
1 Cash and due from banks
2 Interest-bearing deposits with banks
3 Securities purchased under resale agreements
4 Trading account assets
5 AFS investment securities
6 HTM investment securities
7 Loans and leases
8 Goodwill and other intangible assets
9 Other assets
10 Total assets - - - - - - - -
Liabilities:
11 Deposits
12 Securities sold under repurchase agreements
13 Federal funds purchased
14 Short-term borrowings
15 Accrued expenses and other liabilities
16 Long-term debt
17 Total liabilities - - - - - - - -
Shareholders' Equity:
18 Preferred stock + surplus
19 Common stock + surplus
20 Retained earnings
21 Accumulated other comprehensive income
22 Treasury stock
23 Total shareholders' equity - - - - - - - -
24 Total liabilities and shareholders' equity - - - - - - - -
Off-balance sheet:
25 Commitments and contingencies
2011 2012
Business Unit 4
BU 1 Stress Losses - Scenario 1
Q1 Q2 Q3 Q4 Q1 Q2 Q3 Q4
($MM)
Revenue:
1 Fee revenue
Net interest revenue:
2 Interest revenue
3 Interest expense
4 Net interest revenue - - - - - - - -
5 Total revenue - - - - - - - -
6 Operating expenses
7 Pre-provision net revenue - - - - - - - -
Losses:
8 Loan losses
Investment portfolio (OTTI):
9 AFS
10 HTM
11 Total OTTI - - - - - - - -
12 Trading losses
13 Counterparty losses
14 Operational/fiduciary
15 Off-balance sheet
16 Total losses - - - - - - - -
17 Taxes
18 Extraordinary items, net of tax
19 Net income - - - - - - - -
2011 2012
Source Reports
BU 1 Stress Losses - Scenario 1
Source Reports
Q1 Q2 Q3 Q4 Q1 Q2 Q3 Q4
($MM)
Assets:
1 Cash and due from banks
2 Interest-bearing deposits with banks
3 Securities purchased under resale agreements
4 Trading account assets
5 AFS investment securities
6 HTM investment securities
7 Loans and leases
8 Goodwill and other intangible assets
9 Other assets
10 Total assets - - - - - - - -
Liabilities:
11 Deposits
12 Securities sold under repurchase agreements
13 Federal funds purchased
14 Short-term borrowings
15 Accrued expenses and other liabilities
16 Long-term debt
17 Total liabilities - - - - - - - -
Shareholders' Equity:
18 Preferred stock + surplus
19 Common stock + surplus
20 Retained earnings
21 Accumulated other comprehensive income
22 Treasury stock
23 Total shareholders' equity - - - - - - - -
24 Total liabilities and shareholders' equity - - - - - - - -
Off-balance sheet:
25 Commitments and contingencies
2011 2012
Business Unit 3
BU 1 Stress Losses - Scenario 1
Q1 Q2 Q3 Q4 Q1 Q2 Q3 Q4
($MM)
Revenue:
1 Fee revenue
Net interest revenue:
2 Interest revenue
3 Interest expense
4 Net interest revenue - - - - - - - -
5 Total revenue - - - - - - - -
6 Operating expenses
7 Pre-provision net revenue - - - - - - - -
Losses:
8 Loan losses
Investment portfolio (OTTI):
9 AFS
10 HTM
11 Total OTTI - - - - - - - -
12 Trading losses
13 Counterparty losses
14 Operational/fiduciary
15 Off-balance sheet
16 Total losses - - - - - - - -
17 Taxes
18 Extraordinary items, net of tax
19 Net income - - - - - - - -
2011 2012
Source Reports
BU 1 Stress Losses - Scenario 1
Source Reports
Q1 Q2 Q3 Q4 Q1 Q2 Q3 Q4
($MM)
Assets:
1 Cash and due from banks
2 Interest-bearing deposits with banks
3 Securities purchased under resale agreements
4 Trading account assets
5 AFS investment securities
6 HTM investment securities
7 Loans and leases
8 Goodwill and other intangible assets
9 Other assets
10 Total assets - - - - - - - -
Liabilities:
11 Deposits
12 Securities sold under repurchase agreements
13 Federal funds purchased
14 Short-term borrowings
15 Accrued expenses and other liabilities
16 Long-term debt
17 Total liabilities - - - - - - - -
Shareholders' Equity:
18 Preferred stock + surplus
19 Common stock + surplus
20 Retained earnings
21 Accumulated other comprehensive income
22 Treasury stock
23 Total shareholders' equity - - - - - - - -
24 Total liabilities and shareholders' equity - - - - - - - -
Off-balance sheet:
25 Commitments and contingencies
2011 2012
Business Unit 2
BU 1 Stress Losses - Scenario 1
Q1 Q2 Q3 Q4 Q1 Q2 Q3 Q4
($MM)
Revenue:
1 Fee revenue
Net interest revenue:
2 Interest revenue
3 Interest expense
4 Net interest revenue - - - - - - - -
5 Total revenue - - - - - - - -
6 Operating expenses
7 Pre-provision net revenue - - - - - - - -
Losses:
8 Loan losses
Investment portfolio (OTTI):
9 AFS
10 HTM
11 Total OTTI - - - - - - - -
12 Trading losses
13 Counterparty losses
14 Operational/fiduciary
15 Off-balance sheet
16 Total losses - - - - - - - -
17 Taxes
18 Extraordinary items, net of tax
19 Net income - - - - - - - -
2011 2012
Source Reports
BU 1 Stress Losses - Scenario 1
Source Reports
Q1 Q2 Q3 Q4 Q1 Q2 Q3 Q4
($MM)
Assets:
1 Cash and due from banks
2 Interest-bearing deposits with banks
3 Securities purchased under resale agreements
4 Trading account assets
5 AFS investment securities
6 HTM investment securities
7 Loans and leases
8 Goodwill and other intangible assets
9 Other assets
10 Total assets - - - - - - - -
Liabilities:
11 Deposits
12 Securities sold under repurchase agreements
13 Federal funds purchased
14 Short-term borrowings
15 Accrued expenses and other liabilities
16 Long-term debt
17 Total liabilities - - - - - - - -
Shareholders' Equity:
18 Preferred stock + surplus
19 Common stock + surplus
20 Retained earnings
21 Accumulated other comprehensive income
22 Treasury stock
23 Total shareholders' equity - - - - - - - -
24 Total liabilities and shareholders' equity - - - - - - - -
Off-balance sheet:
25 Commitments and contingencies
2011 2012
Business Unit 1
Consolidated Baseline
Income Statement and
Balance Sheet Forecast
Incremental Stress
Impact Estimates Pro Forma Stressed
Income Statement and
Balance Sheet
2016
Current Actions Taken at CCAR Institutions
CCAR institutions continue to enhance capital management process and related validation processes
18
At Risk
Inefficient Unstable Stress Testing
Process
Functional
Issue Awareness with Manual
Processes and Control
Sustainable
Reliable,
Controlled Function
Aspirational
High Performing Enterprise-
wide Business enabler
Strategy
• Siloed Stress Testing Approach
• Ad-hoc planning for consolidated
stress testing exercises
• Coordinated business and
corporate stress testing approach
• Integrated business and corporate
approach
• Comprehensive coverage and
alignment of stress testing efforts
• IT enabled strategy focused on creating
value for business and corporate
function
• Integrated framework fully aligned to
Basel, ICAAP, contingency, recovery and
resolution planning
Governance
• Structures remain inconsistent and
are based on “who can do it” rather
than “who should do it”
• Skills and capabilities requirements
loosely defined
• Consistent structures exist with
clear functional boundaries
between risk, finance and LOB
• Some functions are centralized
• Skills and capability requirements
are well defined and pursued
• Stress testing committee and
working group
• Centralized and organized stress
testing unit to increase
accountability and drive expertise
• Stress testing fully aligned to strategic
planning and performance evaluation
• Highly skilled resources focused on
analysis vs. result production
• Leverage shared services to deliver
routine, high volume transaction
processing when necessary
Process
• Scenario Analysis, loss forecasting,
aggregation and reporting
processes are informally
documented, not standard and
disconnected
• Issues are partially known and
managed reactively
• Standard policies and procedures
are well documented and
maintained
• Ad-hoc efforts to standardize and
automate procedures
• Activities are performed manually
and consume excessive resources
• Outsource of systemic scenario
generation
• Processes are highly standardized
and consistent across LOBs
• Linkage between LOB and
corporate stress testing processes
• Key activities and controls are
performed on a timely basis based
on controlled cycle time and
effective preventive controls that
reduce errors
• End-to-end process
approach to standardization
& simplification
• Integrated loss and RWA forecasting
• Continuous process improvement and
ongoing formalized documentation
Technology
• Multiple databases with no
common structure or reliable
interfaces
• Heavy reliance on ad-hoc reporting
to provide information
• Significant data manipulation to
support stress testing needs
• Streamlined inventory of risk and
finance applications participate in
stress testing process
• Data validation controls in place
to ensure completeness and
reconciled information to
GL/disclosures
• Automation of balance sheet
aggregation and reporting steps in
stress testing process
• Model and data quality governance
and controls in place
• Financial and risk applications
(scenarios, loss forecasting, balance
sheet aggregation and fully integrated
into a common stress testing platform
• Ability to expand functionality and link
other areas (RWA, ICAAP, liquidity risk,
ALM, etc.)
• Flexible functionality (e.g., what if and
sensitivity analysis)
Stabilization Sustainability
The identification, discovery and preparation of data to complete the FR Y-
14 reports should leverage both top-down and bottom-up approaches
18
There are two methodologies to identify, discover and get data ready for the FR Y-14 reporting, top down
approach and bottom up approach as shown in the diagram below.
Data
gaps
Data sourcing
solutions
Strategic
enhancements
Tactical workarounds
end-user computing
Understand the internal/
external reporting
requirements
Component evaluation &
issue resolutions
FRY-14
Data Elements
•Balance sheet,
•Income statement
• Risk reports,
•Financial data
FRY-14
Data Model
Data schema
(grouping)
Group FRY-14 Data
Requirements
Identify source
system for the data
elements
Data dictionary
Top Down
Bottom Up
Defining Reporting Requirements – Reporting & Data
Anticipating Reporting Requirements – Work Streams
Mapping Sourcing
Analysis

capital management and stress test

  • 1.
  • 2.
    Capital management framework 3 CCARCapital management framework
  • 3.
    Capital buffers –Stress Test Requirements Material Risk Material Impact in Capital Measures CCAR stress test Economic Capital Regulatory Capital B1 Buffer Post Stress 1. Credit Risk - Commercial - Consumer - Investment Issuer - Counterparty HIGH           2. Market Risk - IRR - Trading - Other mkt. risks MODERATE       3. Operational and Compliance Risk HIGH   4. Business Risk MODERATE  PPNR partially captured  5. Model Risk LOW  Model Buffers 6. Liquidity Risk MODERATE  Captured in idiosyncratic scenario Liquidity risk does not require economic capital buffer The capital planning process needs to identify all the material risks at the Company and show how they are captured in the measures used to assess capital adequacy. 4
  • 4.
    CCAR process &stress test overview The CCAR process is intended to ensure banks hold sufficient capital to continue operating under multiple stressed scenarios inclusive of any proposed capital action. CCAR warrants comprehensive capital-based stress testing . 5 Scenarios Stress Testing / Modeling and Data Templates (FRY 14-A, Q and Ms) Capital Plan Document Baseline Scenario Internal Stress Scenario(s) Supervisory Stress Scenario Loss Estimation • Credit Risk (by portfolio) • Trading Risk 9-Quarters Pro Forma Income Statement • Loss Estimates. • Revenue impact. • Cost Impact 9-Quarters Pro Forma Balance Sheet • Retained Earnings • OCI • DTA Goodwill Base and Stress Capital Ratios Capital Adequacy Assessment • AFS/HTM • Operational Risk Integrated Stress Testing • Comprehensive systemic and idiosyncratic scenarios • Enterprise-wide consolidated stress testing • Dynamic over the course of the next nine quarters • Linked to capital adequacy by expecting Tier 1 common post-stress limits (e.g., 5% Tier 1 common) • Incorporates financial forecast of revenue and expenses • CCAR data templates and result disclosures Single Shock, Risk-Specific Stress Requirements • Trading Market Risk • Credit and Counterparty • Liquidity/ Funding • Operational
  • 5.
    Business strategy The StrategicPlan is a key input to the capital management process. The bank needs to hold sufficient capital and liquidity to support the plan under multiple economic and bank scenarios. To annual planning and budgeting process Defines strategic objectives and plans Recommends Risk Appetite Develops and disseminates corporate strategic plan Develops LOB and sub-LOB strategic plans and scenarios Strategic Plan Process Approves Risk Appetite Reviews and Approves Reviews Reviews LOB Leadership, Finance & Risk Corporate Strategy Executive Risk Committee CEO/CFO Board of Directors Strategic Plan State of the world Baseline or better Poor economic conditions Severe economic conditions Min capital (and liquidity) Target capital (and liquidity) Capital Planning Process To capital management process   5
  • 6.
    Building Blocks forStress Testing System 6 Tier 1 Ratios Master Scenarios Macro Economic Projections GDP growth Unemployment USD/ EUR Interest Rates .... Portfolio Specifics Portfolio Growth Asset Quality Migration ... Translation Models P&L Deposit Margins Lending Margins Investment Fees Credit Losses Operational Expenses Required Capital Operational Market Credit Available Capital Strategic Plans Risk Weighted Assets PD = f(PD0 ,GDP,...) EAD = f(EAD0 ,PGF,...) RWA = f(PD,LGD,EAD) EL = f(PD0 ,LGD, EAD)
  • 7.
    Scenario generation Scenario GenerationActivities Scenario Generation Output 1. Detailed Systemic Scenario Description - Define systemic scenario and macroeconomic factors - Calibrate macroeconomic factors - Adjust scenario factors for regional considerations 2. Idiosyncratic Risk Considerations - Leverage risks identified in Risk Assessment - Determine high-level impact for each idiosyncratic event - Define likelihood for each idiosyncratic event 3. Scenario Assessment, Review and Finalization - Review systemic scenario(s) and company-specific events - Assign/discuss likelihood for each scenario option - Select scenario(s) and review impact Scenario “N” (if applicable) BHC Baseline (Budget) BHC Stress Scenario Description Macro Factors Key areas of Impact Multiple scenarios should be developed which are relevant to the Company’s risk profile and incorporate simultaneous firm-specific and market-wide macroeconomic events. 7
  • 8.
    Scenario development —Provisions for Loan and Lease Losses Loan losses are projected using product-specific models utilizing historical and expected relationships between credit performance and relevant macroeconomic variables. 9 Mortgage Loan Products Domestic Mortgages Commercial & Industrial and Commercial Real Estate Credit Cards Other Consumer Other Loans Loan Types  Includes first and junior liens; closed- end and revolving  Includes Commercial & Industrial loans to obligors globally and domestic Commercial Real Estate loans  Includes bank and charge cards both domestically and internationally  Includes personal loans, student loans, auto loans, and other consumer loans  Includes international real estate loans and a variety of non-retail loans Key Modeling Inputs  Home Price Index (HPI)  Interest rates  Unemployment rate  Obligor and facility risk characteristics  Country (local GDP)  Sensitivity to global trade flows  Vintage  Credit score  Country  Unemployment rate  Vintage  Credit score  Country  Unemployment rate  Local GDP  HPI  Interest rates  Unemployment rate Business Activities  Domestic residential mortgage portfolios (RESI), the Private Bank, and Bank Holdings in RESI  Corporate and commercial loan, commercial real estate, commercial industrial loans, exposures in Securities & Banking (S&B), Transaction Services, and Bank Holdings  Consumer and corporate credit card lending globally  Domestic credit cards in Bank’s Branded and Retail Services segments  Domestic and global operations  International residential real estate  International commercial real estate and other loans in S&B, Transaction Services, Bank Holdings
  • 9.
    FR Y-14 Aschedules will require to develop capabilities around loss forecasting—Retail portfolios Historical Charge-offs Delinquency Econometric Component Based Models PD/LGD-Based Models Model Characteristics • Simple average of historical net charge-offs or Markov-based loss rates • Might include lag to address dampening from growth or trend functions to capture recent experience • Delinquency-based vintage • Ratio-based roll-rate • Unit based to control for size and/or separate severity • Entry rate reflecting FICO refresh, behavior score and/or other characteristics such as MTM LTV • Regression or transition probabilities subsequent to entry • Separate LGD reflecting current market conditions • Basel PD/LGD/EAD expected loss approach • Segmentation based on LOB/product type, rating, FICO Score and/or collateral Considerations • Significant lag • No explicit link to root cause other than in segmentation • Somewhat lagging since still based on delinquency • No explicit consideration of certain characteristics such as appreciation/ equity except in segmentation • Seasoning adjustments and segmentation can increase complexity • Segmentation inherent and at the loan level • Calibration in periods of change • Transparency/flexibility • PD/LGD typical for commercial but not always well linked to business levers and loss forecasting for consumer • GAAP consistency (economic vs. accounting) • Transparency and model stability LeadingLagging Models currently utilized by banks vary in level of sophistication, but regulatory expectations are moving towards increasing levels of segmentation and transparency. 10 LeadingLagging
  • 10.
    FR Y-14 Aschedules will require to develop capabilities around loss forecasting—wholesale portfolios Top Down Loss Model Simple Delinquency / Rating Based Portfolio Models More Sophisticated Flow or Transition Models Loan Level Default and Severity Models Model Characteristics Model Characteristics Model Characteristics Model Characteristics • Simple regression of charge-off rate (gross or net) to macroeconomic variables • Might include lag functions • May be augmented by, or benchmarked to, call report peer data • Rating based PD banding • Macroeconomic regression of PD cycle adjustments by rating band • Separate severity assumption or model(s) • May be augmented with vendor data • Dynamic full risk rating transition matrix • Various options for regressing / estimating rates as a function of macroeconomic inputs • Separate severity assumption or model(s) • Can be augmented with vendor data • Predict default probability and/or loss severity as a function of loan level characteristic data and macroeconomic inputs • Often leverages vendor models calibrated to pooled data sets Considerations Considerations Considerations Considerations • Longer time series available • Useful benchmark model • Limited segmentation • Implicit but not explicit reflection of the portfolio condition at the forecast start date (e.g., delinquency pipeline) • Lags many CCAR banks • Within range of broader current practices of CCAR banks • Relatively robust and transparent • Only marginally more data intensive than top down loss model • Separates frequency and severity • Implicit, not explicit transition modeling (requires additional transformation to quarterly defaults) • Limited vendor-based data specific to CRE • Explicit modeling of defaults and timing of loss • More consistent with leading industry approach for commercial • Much more data intensive (loan level vs. summary level) • More complex modeling concepts • May sacrifice some transparency / flexibility • Limited vendor-based data specific to CRE • Incorporates loan specific drivers • Increased segmentation inherent in models • Much more data intensive – very few companies with sufficient internal data to develop / validate • Much more complex modeling concepts • Vendor models gaining more traction; initial and on-going licensing costs, however and some lack of transparency LeadingLagging
  • 11.
    Vendor Solutions availablefor Credit loss forecasting LeadingLagging The following is a representative, but not necessarily comprehensive list of vendor solutions and data sets that can be used to augment the credit modeling 12 Economic Data Portfolio & Loan Level Credit Data Pooled Default and Recovery Data Representative Vendors / Data Model Characteristics Model Characteristics • Moody’s Analytics, CreditCycle & Economy.Com (Moody’s specific scenarios and Fed scenarios) • FHLB regional economic reports (historical) • FRB/FFIEC– Macro Economic Data and Consumer Macro Performance Data • Credit Bureaus – Consumer Credit Data • NAR – Residential Mortgage Macro Performance Data • S&P Case-Shiller Home Price Indices • S&P Credit Models & Capital Stress Test services • CoreLogic • Argus Information Services & Predictive Analytics • Oracle OFSAA • Axiom • SNL Call Report Data (e.g., balances, 30-89, 90+, charge-off, recovery data for major product segments) • RMBS, CMBS Securitization data • Delinquency and flow rates, defaults, write- offs and charge-offs, recoveries and net- losses, prepayments • Scoring metrics • Loan to value, debt-to-income ratios, credit limits and usage • Application volume, marketing activity, collection treatments • ADCO & Intex • Moody’s DRD (corporate default and recovery data) • Moody’s CRD (private firm financial and EDF data) • Moody’s LGD data (recovery database) Considerations Considerations Considerations • Moody’s develops full “economies” under both proprietary scenarios (S1-S5) and Fed scenarios • Useful for utilizing regional inputs or deriving derivative indices from the limited set of variables forecast by the Fed • Useful for augmenting internal data when developing top down loss models, or serving as a benchmark to more sophisticated models (i.e., sanity check) • Useful for augmenting internal rating and recovery data in developing proprietary (internal) rating index or transition matrix based methods
  • 12.
    Scenario development —Trading and Counterparty Losses Trading and counterparty losses represent losses on Bank’s trading portfolios, CVA, and other mark-to-market assets, inclusive of default losses. . 8
  • 13.
    Integrated Risk andCapital decision reporting 12 Key Risk Indicators Current Prior Trend vs. Tolerance / Target Score Benchmarking Credit Mortgages HELOC Auto Loans Credit Cards Other Consumer C&I CRE Market Opera- tional RISK  Credit  Market  Investment  Operational CAPITAL  Capital Ratios  Basel III  Capital Actions EARNINGS LIQUIDITY  Liquidity Ratios  Basel III  Contingency Actions  Revenue  Expenses  PPNR  Profitability Risk BASELINE STRESSED S 1 S 2 S 3 S 4 S 5 BenchmarkingKey Risk Indicators Baseline Stressed Current Prior Trend vs. Tolerance/Target Score Benchmarking S1 S2 S3 S4 S5 Benchmarking Capital reporting should include baseline and stressed views of KRIs.
  • 14.
    PPNR forecasting modelingframework Business Plan - PPNR Forecast Business Plan - PPNR Forecast Business Plan - PPNR Forecast Macroeconomic Scenarios • Baseline • Fed Adverse • Fed Severely Adverse • BHC Scenarios (Systemic and Idiosyncratic) PPNR Model Estimated Regression Coefficients PPNR Drivers Net Interest Income Projected Balances Projected Yields Non-interest Income Non-interest Expenses + - Compensation Op Risk Events Put‐back Losses OREO Expenses Changes in MSR Income Other Expenses x Fee & Commissions Securitization & Gain on Sale … Servicing Revenue Segments Baseline Scenario Scenario 1 Scenario 2 Balances Originations # of Accounts # of Loans Assets • Residential Mortgages • HELOCs • C&I Loans • Small Business • CRE Loans • Credit Cards • Other Consumer (Auto, Student, etc.) • Other Loans & Leases • Interest-bearing Securities • Trading Assets • Deposits with Other Banks Liabilities • Customer Deposits • Fed Funds, Repos, Other Short- term Borrowing • Trading Liabilities • TruPS • Long-term Debt • Other # of Deposits … Modeling Components • Alternative Variables • Simple vs. Multiple • Transformations • Autoregression/Lags • Data Disaggregation • Data Augmentation • Residual Analysis • Sensitivity Analysis 13
  • 15.
    Modeling aspect FedModel Industry Practice (less complex) Industry Practice (more complex) Model Type  Multiple autoregressive models  Single regressions  Lagged variables  Moving averages used where regressions had insufficient fit  Multiple regressions  2-3 drivers for each regression  Dummy variables to adjust for seasonality  Moving averages used where regressions had insufficient fit Considerations for Granularity  BHC business model  Ability to accurately model small components of revenue  Data availability (included available balance and volume forecasts)  Market environment, competitive landscape, and resources available to lines of business Granularity of Components  17 components of PPNR: o Interest income (5) o Interest expense (3) o Non-interest non-trading income (5) o Non-interest expense (3) o Trading revenue (1)  ~10 regressions with sufficient fit  Non-interest income and expense line items projected  +100 regressions with sufficient fit  Components of balances modeled in addition to line items Macroeconomic Variables  Interest Rates  GDP  Equity Markets and Volatility  Direct forecasts based on internally provided balances and volumes  GDP growth  Interest rates  Equity markets  Commodities Model Ownership  N/A  Input from line of business on economic drivers  Line of business has no review of output after model creation  Line of business CFOs own economic drivers and model results  Line of business determines whether identified correlations are non-spurious Documentation and Validation  N/A  Documentation and validation consistent with SR 11-7 model risk management framework There are a range of industry practices related to PPNR modeling capabilities across US institutions. PPNR modeling is one of the most challenging modeling areas and has been the source of Matters Requiring Attention (“MRAs”) for many banks in the 2012 and 2013 CCAR cycles. PPNR industry modeling practices 11
  • 16.
    Loss forecasting —Operational risk modeling 2.1. Regression Analysis of Frequency and Severity using internal loss data • Regression techniques • Lagging 2.2. Add external data when necessary 2.3. Add scenario analysis to calculated idiosyncratic add-on Economic Indicators Dataset LOB / Risk Type Retail Banking Commercia l Banking Clearing Retail Brokerage Private Banking Business Disruption / IT Clients / Business Practice Damage to Physical Assets HR and Workplace Safety Execution and Process External Fraud Internal Fraud # Economic Factors 4Q’11 1Q’12 2Q’12 3Q’12 4Q’12 1Q’12 2Q’13 3Q’13 4Q’13 1 RealGDPchange (% YoY) 2 Unemploymentrate 3 Inflation(%) 4 Personalsavingsrate 5 House price index 6 Consumerdebttoincome ratio 7 Personalbankruptcyfiling 8 Businessbankruptcyfiling 9 Prime interestrate 10 3-MonthLibor 11 10-YearTreasury Note 12 Vehicle Sales(millions) 13 S&P500 Index (endof period) 14 NationalConsumerloangrowth 15 NationalC&Iloan growth AMA Inputs BU 1 BU 2 BU 3... LT 1 LT 2LT 3 … Internal Loss Database External Loss Database Scenarios Loss Database AMA Calculation Engine Frequency distribution Severity distribution Aggregate Loss Distribution  Scenario Design  Loss Forecasting  Capital Impact & Validation • Systemic • Idiosyncratic • Supervisory • EL • RWA • EC • RC • Risk type / LOB cell • Lagging Stress Testing Output Scenario1 2010Amountin$Mil BHCBaseline Q42010 Q12011 Q22011 Q32011 Q42011 Q12012 Q22012 Q32012 Q42012 ProjectedOperational RiskLosses Scenario2 2010Amountin$Mil BHCStress Q42010 Q12011 Q22011 Q32011 Q42011 Q12012 Q22012 Q32012 Q42012 ProjectedOperational RiskLosses Scenario3 2010Amountin$Mil SupervisoryStress Q42010 Q12011 Q22011 Q32011 Q42011 Q12012 Q22012 Q32012 Q42012 ProjectedOperational RiskLosses 2011Amountin$Mil 2012Amountin$Mil 2011Amountin$Mil 2012Amountin$Mil 2011Amountin$Mil 2012Amountin$Mil • Systemic • Idiosyncratic • Supervisory LOB / Risk Type Retail Banking Commercial Banking Clearing Retail Brokerage Private Banking Business Disruption/ IT Clients / Business Practice Damage to Physical Assets HR and Workplace Safety Executionand Process External Fraud Internal Fraud • LOB • Risk Type Stress Testing Process 16
  • 17.
    Pro- forma capital ratios B/S and P&L Forecast Loss / PPNR Forecast Scenario and Financial Data Thecompletion of FR Y-14 reports represents a significant challenge for Mizuho given the breadth and depth of areas covered by the schedules FR Y-14M* • Credit card data collection schedule (domestic) • First lien closed-end 1-4 family residential loan schedule • Home equity loan and home equity line of credit schedule • Address matching loan level data collection FR Y-14Q • Securities risk • Retail risk* • PPNR • Wholesale risk • Trading risk • Basel III/Dodd-Frank • Regulatory capital instruments • Fair value option/Held for sale • Mortgage servicing rights • Operational risk • Supplemental schedules FR Y-14A • Summary schedules for each scenario – Income statements, balance sheet, and equity /Capital statements; Retail, Wholesale, Loans, Securities; Trading; Counterparty Credit Risk; Operational risk; and PPNR • Macro scenario schedule • Basel III and Dodd Frank schedule • Regulatory capital instruments • Counterparty credit risk 15 *Not applicable to Mizuho’s US operations as these schedules are focused on retail exposure information • Large number of data providers • Numerous data sources • Increased data granularity • Aggregation of data across main platforms • Complex accountability framework • Change management challenge due to constantly changing requirements • Diverse skill set required • Y-14A • Y-14 Semi-Annual • Y-14Q Key Challenges
  • 18.
    The completion ofFR Y-14 and other material regulatory filings is supported by over 3,000 data attributes across 16 categories 16 Below is the approximate count of total data attributes, by different product type, used to build a data platform with the capabilities to address external regulatory reports and internal management reports/analytics # Type of Product Approximate # of data attributes 10 Repo 175+ 11 Equities 50+ 12 Forex 20+ Mitigants 13 Guarantees 175+ 14 Credit derivatives 75+ 15 Collaterals 50+ Financial Data 16 GL data 25+ # Type of Product Approximate # of data attributes 1 Loan contracts 450+ 2 Investments 350+ 3 Overdraft accounts 325+ 4 Options 300+ 5 Swaps 300+ 6 Futures 250+ 7 Money market contracts 200+ 8 Bills 200+ 9 Letters of Credit 175+
  • 19.
    Stress test aggregationsolution functionality overview The stress test platform requires a consolidated baseline forecast with aggregated incremental stress impacts, determined at each business unit/portfolio and at the aggregate enterprise level, to produce a set of pro forma stressed financials. Baseline Income Statement Q1 Q2 Q3 Q4 Q1 Q2 Q3 Q4 ($MM) Revenue: 1 Fee revenue Net interest revenue: 2 Interest revenue 3 Interest expense 4 Net interest revenue - - - - - - - - 5 Total revenue - - - - - - - - 6 Operating expenses 7 Pre-provision net revenue - - - - - - - - Losses: 8 Loan losses Investment portfolio (OTTI): 9 AFS 10 HTM 11 Total OTTI - - - - - - - - 12 Trading losses 13 Counterparty losses 14 Operational/fiduciary 15 Off-balance sheet 16 Total losses - - - - - - - - 17 Taxes 18 Extraordinary items, net of tax 19 Net income - - - - - - - - 2011 2012 Baseline Balance Sheet Q1 Q2 Q3 Q4 Q1 Q2 Q3 Q4 ($MM) Assets: 1 Cash and due from banks 2 Interest-bearing deposits with banks 3 Securities purchased under resale agreements 4 Trading account assets 5 AFS investment securities 6 HTM investment securities 7 Loans and leases 8 Goodwill and other intangible assets 9 Other assets 10 Total assets - - - - - - - - Liabilities: 11 Deposits 12 Securities sold under repurchase agreements 13 Federal funds purchased 14 Short-term borrowings 15 Accrued expenses and other liabilities 16 Long-term debt 17 Total liabilities - - - - - - - - Shareholders' Equity: 18 Preferred stock + surplus 19 Common stock + surplus 20 Retained earnings 21 Accumulated other comprehensive income 22 Treasury stock 23 Total shareholders' equity - - - - - - - - 24 Total liabilities and shareholders' equity - - - - - - - - Off-balance sheet: 25 Commitments and contingencies 2011 2012 Baseline Summary Income Statement - Scenario 1 Q1 Q2 Q3 Q4 Q1 Q2 Q3 Q4 ($MM) Revenue: 1 Fee revenue - - - - - - - - Net interest revenue: 2 Interest revenue - - - - - - - - 3 Interest expense - - - - - - - - 4 Net interest revenue - - - - - - - - 5 Total revenue - - - - - - - - 6 Operating expenses - - - - - - - - 7 Pre-provision net revenue - - - - - - - - Losses: 8 Loan losses - - - - - - - - Investment portfolio (OTTI): 9 AFS - - - - - - - - 10 HTM - - - - - - - - 11 Total OTTI - - - - - - - - 12 Trading losses - - - - - - - - 13 Counterparty losses - - - - - - - - 14 Operational/fiduciary - - - - - - - - 15 Off-balance sheet - - - - - - - - 16 Total losses - - - - - - - - 17 Taxes - - - - - - - - 18 Extraordinary items, net of tax - - - - - - - - 19 Net income - - - - - - - - 2011 2012 Summary Balance Sheet - Scenario 1 Q1 Q2 Q3 Q4 Q1 Q2 Q3 Q4 ($MM) Assets: 1 Cash and due from banks - - - - - - - - 2 Interest-bearing deposits with banks - - - - - - - - 3 Securities purchased under resale agreements - - - - - - - - 4 Trading account assets - - - - - - - - 5 AFS investment securities - - - - - - - - 6 HTM investment securities - - - - - - - - 7 Loans and leases - - - - - - - - 8 Goodwill and other intangible assets - - - - - - - - 9 Other assets - - - - - - - - 10 Total assets - - - - - - - - Liabilities: 11 Deposits - - - - - - - - 12 Securities sold under repurchase agreements - - - - - - - - 13 Federal funds purchased - - - - - - - - 14 Short-term borrowings - - - - - - - - 15 Accrued expenses and other liabilities - - - - - - - - 16 Long-term debt - - - - - - - - 17 Total liabilities - - - - - - - - Shareholders' Equity: 18 Preferred stock + surplus - - - - - - - - 19 Common stock + surplus - - - - - - - - 20 Retained earnings - - - - - - - - 21 Accumulated other comprehensive income - - - - - - - - 22 Treasury stock - - - - - - - - 23 Total shareholders' equity - - - - - - - - 24 Total liabilities and shareholders' equity - - - - - - - - Off-balance sheet: 25 Commitments and contingencies - - - - - - - - 2011 2012 Stressed Pro Forma BU 1 Stress Losses - Scenario 1 Q1 Q2 Q3 Q4 Q1 Q2 Q3 Q4 ($MM) Revenue: 1 Fee revenue Net interest revenue: 2 Interest revenue 3 Interest expense 4 Net interest revenue - - - - - - - - 5 Total revenue - - - - - - - - 6 Operating expenses 7 Pre-provision net revenue - - - - - - - - Losses: 8 Loan losses Investment portfolio (OTTI): 9 AFS 10 HTM 11 Total OTTI - - - - - - - - 12 Trading losses 13 Counterparty losses 14 Operational/fiduciary 15 Off-balance sheet 16 Total losses - - - - - - - - 17 Taxes 18 Extraordinary items, net of tax 19 Net income - - - - - - - - 2011 2012 Source Reports BU 1 Stress Losses - Scenario 1 Source Reports Q1 Q2 Q3 Q4 Q1 Q2 Q3 Q4 ($MM) Assets: 1 Cash and due from banks 2 Interest-bearing deposits with banks 3 Securities purchased under resale agreements 4 Trading account assets 5 AFS investment securities 6 HTM investment securities 7 Loans and leases 8 Goodwill and other intangible assets 9 Other assets 10 Total assets - - - - - - - - Liabilities: 11 Deposits 12 Securities sold under repurchase agreements 13 Federal funds purchased 14 Short-term borrowings 15 Accrued expenses and other liabilities 16 Long-term debt 17 Total liabilities - - - - - - - - Shareholders' Equity: 18 Preferred stock + surplus 19 Common stock + surplus 20 Retained earnings 21 Accumulated other comprehensive income 22 Treasury stock 23 Total shareholders' equity - - - - - - - - 24 Total liabilities and shareholders' equity - - - - - - - - Off-balance sheet: 25 Commitments and contingencies 2011 2012 Corporate BU 1 Stress Losses - Scenario 1 Q1 Q2 Q3 Q4 Q1 Q2 Q3 Q4 ($MM) Revenue: 1 Fee revenue Net interest revenue: 2 Interest revenue 3 Interest expense 4 Net interest revenue - - - - - - - - 5 Total revenue - - - - - - - - 6 Operating expenses 7 Pre-provision net revenue - - - - - - - - Losses: 8 Loan losses Investment portfolio (OTTI): 9 AFS 10 HTM 11 Total OTTI - - - - - - - - 12 Trading losses 13 Counterparty losses 14 Operational/fiduciary 15 Off-balance sheet 16 Total losses - - - - - - - - 17 Taxes 18 Extraordinary items, net of tax 19 Net income - - - - - - - - 2011 2012 Source Reports BU 1 Stress Losses - Scenario 1 Source Reports Q1 Q2 Q3 Q4 Q1 Q2 Q3 Q4 ($MM) Assets: 1 Cash and due from banks 2 Interest-bearing deposits with banks 3 Securities purchased under resale agreements 4 Trading account assets 5 AFS investment securities 6 HTM investment securities 7 Loans and leases 8 Goodwill and other intangible assets 9 Other assets 10 Total assets - - - - - - - - Liabilities: 11 Deposits 12 Securities sold under repurchase agreements 13 Federal funds purchased 14 Short-term borrowings 15 Accrued expenses and other liabilities 16 Long-term debt 17 Total liabilities - - - - - - - - Shareholders' Equity: 18 Preferred stock + surplus 19 Common stock + surplus 20 Retained earnings 21 Accumulated other comprehensive income 22 Treasury stock 23 Total shareholders' equity - - - - - - - - 24 Total liabilities and shareholders' equity - - - - - - - - Off-balance sheet: 25 Commitments and contingencies 2011 2012 Business Unit 4 BU 1 Stress Losses - Scenario 1 Q1 Q2 Q3 Q4 Q1 Q2 Q3 Q4 ($MM) Revenue: 1 Fee revenue Net interest revenue: 2 Interest revenue 3 Interest expense 4 Net interest revenue - - - - - - - - 5 Total revenue - - - - - - - - 6 Operating expenses 7 Pre-provision net revenue - - - - - - - - Losses: 8 Loan losses Investment portfolio (OTTI): 9 AFS 10 HTM 11 Total OTTI - - - - - - - - 12 Trading losses 13 Counterparty losses 14 Operational/fiduciary 15 Off-balance sheet 16 Total losses - - - - - - - - 17 Taxes 18 Extraordinary items, net of tax 19 Net income - - - - - - - - 2011 2012 Source Reports BU 1 Stress Losses - Scenario 1 Source Reports Q1 Q2 Q3 Q4 Q1 Q2 Q3 Q4 ($MM) Assets: 1 Cash and due from banks 2 Interest-bearing deposits with banks 3 Securities purchased under resale agreements 4 Trading account assets 5 AFS investment securities 6 HTM investment securities 7 Loans and leases 8 Goodwill and other intangible assets 9 Other assets 10 Total assets - - - - - - - - Liabilities: 11 Deposits 12 Securities sold under repurchase agreements 13 Federal funds purchased 14 Short-term borrowings 15 Accrued expenses and other liabilities 16 Long-term debt 17 Total liabilities - - - - - - - - Shareholders' Equity: 18 Preferred stock + surplus 19 Common stock + surplus 20 Retained earnings 21 Accumulated other comprehensive income 22 Treasury stock 23 Total shareholders' equity - - - - - - - - 24 Total liabilities and shareholders' equity - - - - - - - - Off-balance sheet: 25 Commitments and contingencies 2011 2012 Business Unit 3 BU 1 Stress Losses - Scenario 1 Q1 Q2 Q3 Q4 Q1 Q2 Q3 Q4 ($MM) Revenue: 1 Fee revenue Net interest revenue: 2 Interest revenue 3 Interest expense 4 Net interest revenue - - - - - - - - 5 Total revenue - - - - - - - - 6 Operating expenses 7 Pre-provision net revenue - - - - - - - - Losses: 8 Loan losses Investment portfolio (OTTI): 9 AFS 10 HTM 11 Total OTTI - - - - - - - - 12 Trading losses 13 Counterparty losses 14 Operational/fiduciary 15 Off-balance sheet 16 Total losses - - - - - - - - 17 Taxes 18 Extraordinary items, net of tax 19 Net income - - - - - - - - 2011 2012 Source Reports BU 1 Stress Losses - Scenario 1 Source Reports Q1 Q2 Q3 Q4 Q1 Q2 Q3 Q4 ($MM) Assets: 1 Cash and due from banks 2 Interest-bearing deposits with banks 3 Securities purchased under resale agreements 4 Trading account assets 5 AFS investment securities 6 HTM investment securities 7 Loans and leases 8 Goodwill and other intangible assets 9 Other assets 10 Total assets - - - - - - - - Liabilities: 11 Deposits 12 Securities sold under repurchase agreements 13 Federal funds purchased 14 Short-term borrowings 15 Accrued expenses and other liabilities 16 Long-term debt 17 Total liabilities - - - - - - - - Shareholders' Equity: 18 Preferred stock + surplus 19 Common stock + surplus 20 Retained earnings 21 Accumulated other comprehensive income 22 Treasury stock 23 Total shareholders' equity - - - - - - - - 24 Total liabilities and shareholders' equity - - - - - - - - Off-balance sheet: 25 Commitments and contingencies 2011 2012 Business Unit 2 BU 1 Stress Losses - Scenario 1 Q1 Q2 Q3 Q4 Q1 Q2 Q3 Q4 ($MM) Revenue: 1 Fee revenue Net interest revenue: 2 Interest revenue 3 Interest expense 4 Net interest revenue - - - - - - - - 5 Total revenue - - - - - - - - 6 Operating expenses 7 Pre-provision net revenue - - - - - - - - Losses: 8 Loan losses Investment portfolio (OTTI): 9 AFS 10 HTM 11 Total OTTI - - - - - - - - 12 Trading losses 13 Counterparty losses 14 Operational/fiduciary 15 Off-balance sheet 16 Total losses - - - - - - - - 17 Taxes 18 Extraordinary items, net of tax 19 Net income - - - - - - - - 2011 2012 Source Reports BU 1 Stress Losses - Scenario 1 Source Reports Q1 Q2 Q3 Q4 Q1 Q2 Q3 Q4 ($MM) Assets: 1 Cash and due from banks 2 Interest-bearing deposits with banks 3 Securities purchased under resale agreements 4 Trading account assets 5 AFS investment securities 6 HTM investment securities 7 Loans and leases 8 Goodwill and other intangible assets 9 Other assets 10 Total assets - - - - - - - - Liabilities: 11 Deposits 12 Securities sold under repurchase agreements 13 Federal funds purchased 14 Short-term borrowings 15 Accrued expenses and other liabilities 16 Long-term debt 17 Total liabilities - - - - - - - - Shareholders' Equity: 18 Preferred stock + surplus 19 Common stock + surplus 20 Retained earnings 21 Accumulated other comprehensive income 22 Treasury stock 23 Total shareholders' equity - - - - - - - - 24 Total liabilities and shareholders' equity - - - - - - - - Off-balance sheet: 25 Commitments and contingencies 2011 2012 Business Unit 1 Consolidated Baseline Income Statement and Balance Sheet Forecast Incremental Stress Impact Estimates Pro Forma Stressed Income Statement and Balance Sheet 2016
  • 20.
    Current Actions Takenat CCAR Institutions CCAR institutions continue to enhance capital management process and related validation processes 18 At Risk Inefficient Unstable Stress Testing Process Functional Issue Awareness with Manual Processes and Control Sustainable Reliable, Controlled Function Aspirational High Performing Enterprise- wide Business enabler Strategy • Siloed Stress Testing Approach • Ad-hoc planning for consolidated stress testing exercises • Coordinated business and corporate stress testing approach • Integrated business and corporate approach • Comprehensive coverage and alignment of stress testing efforts • IT enabled strategy focused on creating value for business and corporate function • Integrated framework fully aligned to Basel, ICAAP, contingency, recovery and resolution planning Governance • Structures remain inconsistent and are based on “who can do it” rather than “who should do it” • Skills and capabilities requirements loosely defined • Consistent structures exist with clear functional boundaries between risk, finance and LOB • Some functions are centralized • Skills and capability requirements are well defined and pursued • Stress testing committee and working group • Centralized and organized stress testing unit to increase accountability and drive expertise • Stress testing fully aligned to strategic planning and performance evaluation • Highly skilled resources focused on analysis vs. result production • Leverage shared services to deliver routine, high volume transaction processing when necessary Process • Scenario Analysis, loss forecasting, aggregation and reporting processes are informally documented, not standard and disconnected • Issues are partially known and managed reactively • Standard policies and procedures are well documented and maintained • Ad-hoc efforts to standardize and automate procedures • Activities are performed manually and consume excessive resources • Outsource of systemic scenario generation • Processes are highly standardized and consistent across LOBs • Linkage between LOB and corporate stress testing processes • Key activities and controls are performed on a timely basis based on controlled cycle time and effective preventive controls that reduce errors • End-to-end process approach to standardization & simplification • Integrated loss and RWA forecasting • Continuous process improvement and ongoing formalized documentation Technology • Multiple databases with no common structure or reliable interfaces • Heavy reliance on ad-hoc reporting to provide information • Significant data manipulation to support stress testing needs • Streamlined inventory of risk and finance applications participate in stress testing process • Data validation controls in place to ensure completeness and reconciled information to GL/disclosures • Automation of balance sheet aggregation and reporting steps in stress testing process • Model and data quality governance and controls in place • Financial and risk applications (scenarios, loss forecasting, balance sheet aggregation and fully integrated into a common stress testing platform • Ability to expand functionality and link other areas (RWA, ICAAP, liquidity risk, ALM, etc.) • Flexible functionality (e.g., what if and sensitivity analysis) Stabilization Sustainability
  • 21.
    The identification, discoveryand preparation of data to complete the FR Y- 14 reports should leverage both top-down and bottom-up approaches 18 There are two methodologies to identify, discover and get data ready for the FR Y-14 reporting, top down approach and bottom up approach as shown in the diagram below. Data gaps Data sourcing solutions Strategic enhancements Tactical workarounds end-user computing Understand the internal/ external reporting requirements Component evaluation & issue resolutions FRY-14 Data Elements •Balance sheet, •Income statement • Risk reports, •Financial data FRY-14 Data Model Data schema (grouping) Group FRY-14 Data Requirements Identify source system for the data elements Data dictionary Top Down Bottom Up Defining Reporting Requirements – Reporting & Data Anticipating Reporting Requirements – Work Streams Mapping Sourcing Analysis