Downloaded 135 times
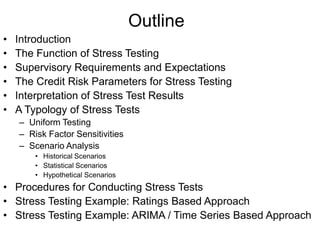
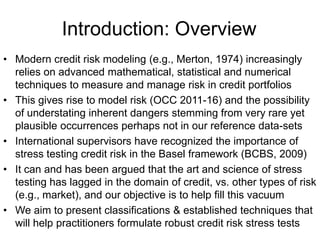
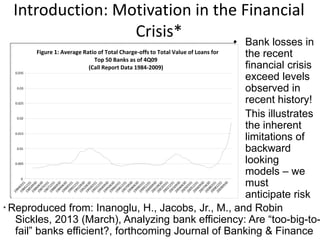
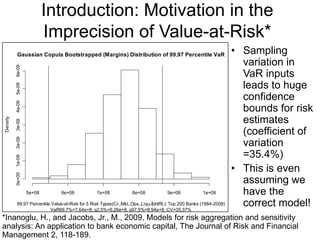
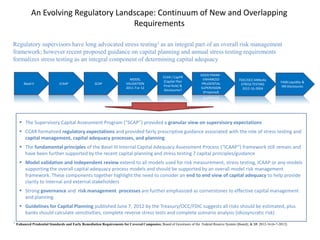
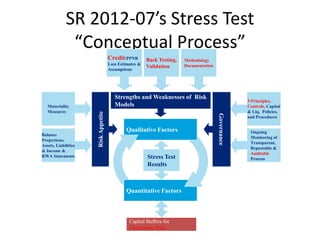
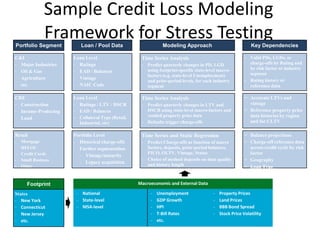
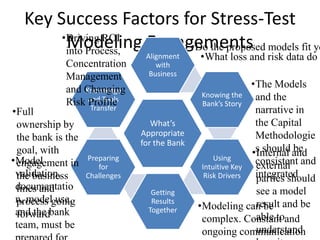


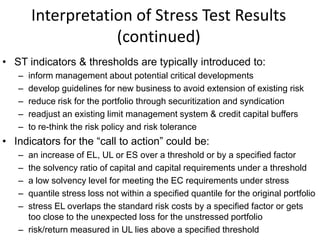
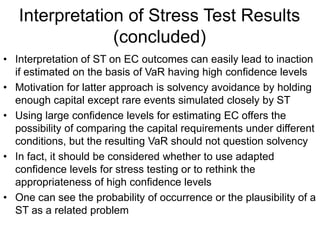
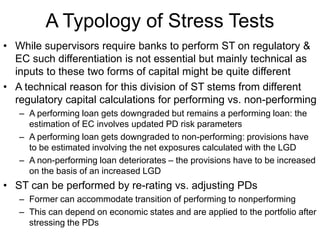
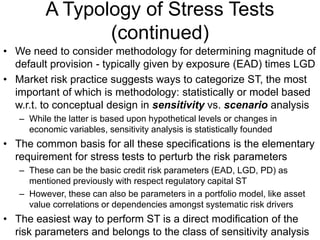
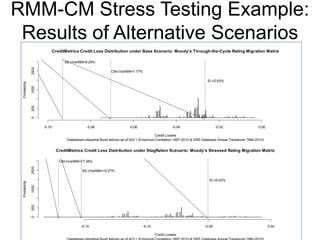
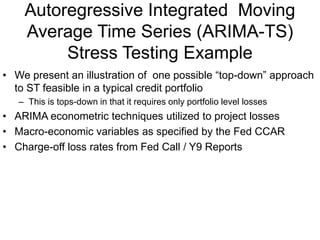

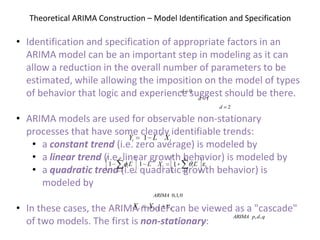

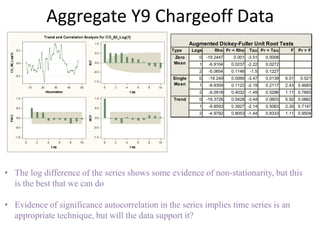


The document discusses stress testing for credit risk portfolios, detailing its significance in modern risk management, particularly in light of regulatory expectations stemming from financial crises. It provides an overview of methodologies, including scenario analysis and the application of various models to assess potential losses and capital adequacy. Furthermore, it emphasizes the need for robust governance, model validation, and integration of stress test results into overall risk management processes.


![Lgd Model Jacobs 10 10 V2[1]](https://cdn.slidesharecdn.com/ss_thumbnails/lgdmodeljacobs1010v21-12872530142448-phpapp02-thumbnail.jpg?width=640&height=640&fit=bounds)


