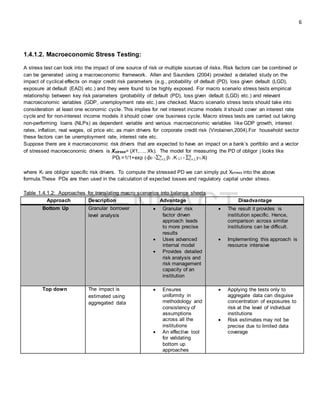
Stress testing and sensitivity analysis are important risk management tools required by regulators. Stress testing assesses the financial health of institutions under hypothetical stressful scenarios to determine if they remain solvent and liquid. It can test solvency by examining capital ratios or test liquidity by analyzing net cash flows. Sensitivity analysis varies inputs to risk models to determine the models' responses. This document discusses stress testing methods like scenario analysis and sensitivity analysis techniques and provides a case study applying these methods to a probability of default model.
The document discusses operational risk and Basel II regulations. It defines operational risk as losses from internal failures or external events. It outlines the three pillars of Basel II which establish minimum capital requirements, supervisory review, and market discipline. It describes the different approaches for calculating operational risk capital charges, including the Basic Indicator Approach, Standardized Approach, and Advanced Measurement Approach.
The document discusses various types of risks faced by financial institutions including market risk, liquidity risk, credit risk, and operational risk. It provides an overview of how to manage these risks through a generic risk management approach of identifying, prioritizing, classifying, quantifying, and mitigating risks. Dynamic hedging is discussed as a technique to manage risks from guarantees on investment products through regular adjustments of hedge positions.
The document discusses understanding and articulating an organization's risk appetite. It begins by defining risk appetite as the amount of risk an organization is willing to take on in pursuit of its strategic objectives. It then discusses how a clearly understood and articulated risk appetite statement can help align decision making with risk management. The document provides an overview of developing a risk appetite statement, including aligning the risk profile with business plans, determining risk thresholds, and getting board approval of a formal risk appetite statement. It emphasizes linking the risk appetite to performance monitoring and reporting to assess compliance with the stated risk appetite.
Designing Enhanced Supervision for the Evolving Wealth Management Ecosystemaccenture
Converging and rapidly evolving industry trends are creating a new wealth management environment demanding Wealth Managers redefine supervisory governance to best support the firm’s growth strategies while balancing strong risk management. In this new Accenture Finance & Risk presentation we explore the evolving wealth management trends and challenges and outline four key business supervision design questions to support sustainable, long-term growth.
The document discusses establishing key risk indicators (KRIs) for information technology (IT). It explains that KRIs differ from key performance indicators (KPIs) in that KRIs serve as early warning signs of increased risk exposure, while KPIs provide an overview of past performance. Selecting the right KRIs for an IT organization involves understanding organizational objectives and risks that could impact achieving those objectives. Linking objectives, strategies, and KRIs allows an organization to proactively manage strategic risks and help ensure objectives are met. IT risks in particular need to be monitored through KRIs due to IT's role in enabling business strategies and operations.
Risk Identification Process PowerPoint Presentation SlidesSlideTeam
Showcase planned methods of hazard analysis with our content ready Risk Identification Process PowerPoint Presentation Slides. The hazard awareness process PowerPoint complete deck has forty-five PPT slides like risk management introduction, types of risks, risk categories, stakeholder’s management and engagement, risk appetite and tolerance, procedure, risk management plan, risk identification, risk register, risk assessment, risk analysis, risk response plan, risk response matrix, risk control matrix, risk items tracking, tools and practices, risk impact & profitability analysis, risk mitigations strategies, plans, qualitative and quantitative risk analysis, etc. All PowerPoint templates of risk assessment steps presentation are fully editable, edit them as per your specific project needs. The same risk management presentation deck can also be used to portray topics such as risk analysis, risk appetite, business continuity, risk-based auditing, hazard analysis, risk analysis, risk assessment and so on. Download this professionally designed risk management plan presentation deck to mitigate the risk. Our Risk Identification Process PowerPoint Presentation Slides are magnetic in nature. They will draw the right people to your cause.
The Risk and Control Self Assessment (RCSA) is an integral part of most operational risk management frameworks. RCSAs provide a structured mechanism for estimating operational
exposures and the effectiveness of controls. In so doing RCSAs help organisations to prioritise risk exposures, identify control weaknesses and gaps, and monitor the actions taken to address any weaknesses or gaps.
A well designed and implemented RCSA can help to embed operational risk management across an organisation, improving management attitudes towards operational risk management and enhancing the overall risk culture. In contrast, an inefficient or unnecessarily complex RCSA can damage the reputation of the (operational) risk function and reinforce the perception that
operational risk management is a bureaucratic, compliance-focused, exercise that does not support the achievement of organisational objectives.
Learn more about Risk Management and the essentials with IRM’s level 1 certification.
https://www.theirmindia.org/level1
Level 1 qualified or risk management professionals with 2-3 years of experience can also enroll for level 2 certification.
https://www.theirmindia.org/level2
Visit: https://www.theirmindia.org/
Address: IRM India Affiliate, 907,908,909, Corporate Park II, 9th Floor, VN Puran Marg, Near Swastik Chambers, Chembur Mumbai 400071
This document discusses operational risk and key risk indicators (KRIs). It defines operational risk and provides examples of operational risk losses from past incidents. It explains that KRIs are metrics that provide information on an organization's current exposure level to a given operational risk. The document outlines the process for identifying KRIs, which involves risk and control self-assessments to identify inherent risks, controls, and residual risks and prioritize them. It also discusses setting thresholds for KRIs, collecting and reporting KRI data, and the roles involved in managing the KRI process. Examples of potential KRIs are provided for credit risk, financial markets activities, and other operational risks.
Operational Risk Management - A Gateway to managing the risk profile of your...Eneni Oduwole
This document provides an overview of operational risk management (ORM). It defines operational risk and ORM, outlines the core principles and framework of ORM. It describes the elements of ORM including people, process, system and external risks. It discusses ORM procedures such as risk and control self-assessment, key risk indicators, and loss incident reporting. It also introduces some common ORM tools and highlights the benefits of implementing ORM such as improved quality, cost savings, stability of earnings and enhanced competitive position.
This is a stock pitch for BlackBerry that was presented to faculty and investment professionals for the Cleveland Research Company Stock Pitch Competition in April 2017. My team's pitch was selected as one of the four finalist groups.
The document provides an overview of risk management fundamentals and processes. It defines risk, outlines the benefits of a risk management framework, and describes the key components of establishing and implementing an effective risk management system, including:
- Establishing the organizational context and risk criteria
- Identifying, analyzing, and evaluating risks
- Developing and implementing risk treatment plans
- Monitoring and reviewing the risk management process on an ongoing basis
operations risk management power point presentation.Miyelani Shibambo
Operational risk can result in losses from internal failures or external events. It is classified based on frequency and impact of events. Management typically focuses on low frequency/high impact events and high frequency/low impact events. The Basel Accords define three approaches to operational risk capital requirements: Basic Indicator, Standardized, and Advanced Measurement. The Standardized Approach divides business activities into eight lines and assigns a beta multiplier to each line's gross income. The Advanced Measurement Approach uses banks' internal models to calculate regulatory capital.
The document discusses operational risk and provides guidance on defining, identifying, measuring, monitoring, controlling, and mitigating operational risk according to the Basel Committee on Banking Supervision. It addresses issues with operational risk loss data and outlines principles for developing an appropriate operational risk management environment, process, and framework. The document also examines challenges with using internal and external loss data for quantifying operational risk capital requirements.
Mergers and acquisitions allow companies to grow quickly through combinations that create synergies and economies of scale. Motives for mergers and acquisitions include growth, synergies when combined operations are more effective, diversification into new industries, achieving economies of scale and scope through a larger combined business, accessing new technologies, management gains when a more effective acquirer takes over a target, and financial benefits from improved access to capital as a larger entity.
North Village Private Equity Case AnalysisJonathan Tsao
The aim of the project was to act on behalf of North Village Capital's Investment Committee and discuss the various financing options of a proposed buyout investment in "AlarmServe."
- Built a LBO Analysis to understand the impact of leverage on the investment
- Ran a covenant stress test using the LBO model to find the appropriate financing structure
- Recommended investment committee to purchase AlarmServe at moderate leverage with potential IRR of 23.4% in five years.
- Received full marks on case analysis
Having trouble with your enterprise risk management strategy? Map it.Andrew Smart
In 2016, it was estimated that 67% of well-formulated strategies failed due to poor execution and 1 in 3 business leaders rate their firm as poor or very poor at the implementation of strategy.
Like business strategy, the risk management strategy presents execution challenges for the CRO and Risk Management teams.
Paraphrasing the original article that introduced the Strategy Map, in the presentation, Ascendore CEO outlines how the Strategy Map can be used as part of an overall strategy management system to improve the execution of the risk management strategy. This presentation is based on an Ascendore customers use of the Strategy Map for Operational Risk Management.
Miami University 2016 Cleveland Research Company Stock Pitch Competition WinnerMichael T. Loffredo
Orbital ATK is an aerospace and defense company that provides products and services to government and commercial customers. The presentation recommends Orbital ATK as a buy with a 12-month price target of $110, representing 27.1% upside. Key points include Orbital ATK benefiting from international military spending increases, growth in commercial aircraft deliveries, and opportunities in satellite servicing. Risks include competition from larger players and potential issues executing innovative contracts.
Measuring DDoS Risk using FAIR (Factor Analysis of Information RiskTony Martin-Vegue
Slides from Tony Martin-Vegue presentation at FAIRcon, Charlotte, NC: October 14, 2016
"Measuring DDoS Risk with FAIR (Factor Analysis of Information Risk)"
This document discusses operational risk and provides details on its definition, measurement, and management. It defines operational risk as losses resulting from inadequate or failed internal processes, people, and systems or from external events. It describes the Basic Indicator Approach, Standardized Approach, and Advanced Measurement Approach for calculating operational risk capital charges under Basel II. It also outlines the data elements, risk categories, and tools used to measure and manage operational risk.
Enterprise Risk Management as a Core Management Processregio12
The document summarizes the key findings from a study examining best practices in enterprise risk management (ERM) across multiple organizations. The study identified 10 principal findings related to optimizing ERM structures, supporting methodologies, using ERM for decision-making, and evaluating ERM performance. Best practices included establishing executive-level ERM support, using a variety of risk assessment methods, focusing on risk-informed culture and communication, evaluating ERM through performance metrics, and ensuring ERM maturity.
This document discusses mergers and acquisitions (M&A). It defines mergers as combinations of two companies to form one new company, while acquisitions refer to purchases of a company or portion of a company. The document provides examples of different types of M&As, including horizontal (between competitors), vertical (between suppliers and customers), conglomerate (between unrelated companies), and market/product extension mergers. It also outlines common objectives of M&As such as economies of scale, cross-selling opportunities, and access to new markets/products. Challenges of M&As include communication issues, employee retention, and cultural integration.
The document summarizes several research papers related to fintech. It begins by providing background on fintech and how it uses technology to support financial activities and efficiency. It then lists the top fintech journals based on total citations and some of the most popular fintech papers on SSRN, including papers on bitcoin and cryptocurrencies, blockchain technology, and initial coin offerings. One highlighted paper finds that purchases with tether, a cryptocurrency pegged to the US dollar, are timed after market downturns and result in increased bitcoin prices, indicating tether may be used for price manipulation.
This document discusses operational risk management. It begins by defining risk management and the types of risks, including operational risk. It then discusses why operational risk management is important, highlighting some significant operational risk events. It describes tools for identifying and monitoring operational risk, such as loss data collection, risk and control self-assessments, and key risk indicators. It also discusses approaches for measuring operational risk capital requirements under Basel II and III, including the basic indicator approach, standardized approach, and advanced measurement approach. Finally, it notes some challenges in measuring operational risk and ways to mitigate and control operational risk exposures.
Here is our professional-looking Risk Assessment Step PowerPoint Presentation Slides for risk identification and prioritization. Evaluate the risk and decide on precaution with this easy to understand risk management process steps presentation deck. The risk process steps PowerPoint complete deck has forty five content ready slides like risk management introduction, types of risks, risk categories, stakeholder’s management and engagement, risk appetite and tolerance, procedure, risk management plan, risk identification, risk register, risk assessment, risk analysis, risk response plan, risk response matrix, risk control matrix, risk items tracking, tools and practices, risk impact & profitability analysis, risk mitigations strategies, plans, qualitative and quantitative risk analysis, etc. All PowerPoint templates of risk identification process presentation are easy to customize, edit them as per your specific project needs. Download easy to use risk mitigation plan PPT slides to make your business presentation more effective. Get to grapple with the actual facts due to our Risk Assessment Step PowerPoint Presentation Slides. Be able to figure out the ballgame.
The document discusses how digital technologies are converging and disrupting healthcare delivery. It outlines three potential scenarios for this disruption: transformation, evolution, and revolution. It also discusses how capital investment in digital health solutions has grown significantly in recent years. The document outlines several emerging solution archetypes and how digital technologies could significantly impact providers by enabling automation and efficiency, developing patient loyalty, increasing transparency and performance management, enabling coordinated and personalized care, and more. It provides guidelines for healthcare organizations to manage digital transformation.
This document summarizes a presentation on remaking risk management in banking. It discusses progress in improving risk culture, linking business decisions to risk appetite, challenges around data and IT investments, and the impact of Basel III on business models. Some key findings include that most firms feel they are making progress in achieving a strong risk culture but have a long way to go, expressing risk appetite and embedding it into operations are top challenges, and Basel III is leading many banks to evaluate portfolios, shift from complex instruments, and potentially exit some businesses or geographies.
This document discusses issues with using econometric models for macro stress testing of credit portfolios. Specifically:
- Econometric models have limitations like insufficient data, unstable relationships between credit risk and macroeconomic variables, and inability to capture non-linear behavior in stressed conditions.
- An analysis of Hong Kong data from 1997-2007 illustrates these limitations, as default rates did not consistently correlate with macroeconomic factors during stressed periods.
- The document proposes a simple methodology for bank supervisors to estimate history-based stressed PDs for individual banks, using the highest observed default rate for the banking sector as a whole as a benchmark. This allows supervisors to validate banks' self-reported stressed PD estimates.
This document discusses how banks can leverage stress testing to improve business planning and forecasting. Currently, business planning is done separately by each business unit without considering interactions between units or external economic factors. The document argues that enhanced stress testing can help estimate the impacts of macroeconomic shifts on business metrics and guide strategic decisions. It outlines how stress testing has evolved from a siloed risk management tool pre-financial crisis to a more rigorous supervisory process post-crisis. Still, banks are not fully utilizing stress testing's potential to inform strategic planning, funding strategies, and contingency planning. The document advocates using stress testing for these strategic purposes going forward.
1) Stress testing is a technique used to determine the impact of exceptional but plausible risk factor changes on a financial institution's assets and liabilities. It helps quantify vulnerabilities and ensure sufficient capital.
2) Bangladesh Bank has designed a stress testing framework for banks and financial institutions to proactively manage risks. The initial framework focuses on simple sensitivity and scenario analysis of interest rates, collateral values, non-performing loans, stock prices, foreign exchange rates, and liquidity.
3) Banks and financial institutions must conduct stress tests semiannually using minor, moderate and major shock scenarios for each risk factor. Results must be submitted to Bangladesh Bank for oversight of the financial system's resilience.
Dynamic Stress Test Diffusion Model Considering The Credit Score PerformanceGRATeam
After the crisis of 2008, and the important losses and shortfall in capital that it revealed, regulators conducted massive stress testing exercises in order to test the resilience of financial institutions in times of stress conditions. In this context, and considering the impact of these exercises on the banks’ capital, organization and image, this white paper proposes a methodology that diffuses dynamically the stress on the credit rating scale while considering the performance of the credit score. Consequently, the aim is to more accurately reflect the impact of the stress on the portfolio by taking into account the purity of the score and its ability to precisely rank the individuals of the portfolio.
This document provides an overview and comparison of regulatory stress testing frameworks in various countries and regions. It discusses the evolution of stress testing after the 2009 financial crisis, when regulatory bodies realized the need to better assess banks' ability to withstand adverse economic scenarios. The document then summarizes the stress testing processes used by the European Banking Authority, US Federal Reserve, and UK Prudential Regulatory Authority. Overall, it examines the development of stress testing globally and differences in approaches between regions and over time.
The document discusses two quantitative models - the Household Risk Assessment Model (HRAM) and the Macro Financial Risk Assessment Framework (MFRAF) - that the Bank of Canada has developed to better identify and measure systemic financial risks, with HRAM focusing on risks from elevated household debt and MFRAF analyzing contagion effects between banks. It also notes the challenges in modeling systemic risk and the need to continue improving these quantitative tools.
A Tale of Two Risk Measures: Economic Capital vs. Stress Testing and a Call f...Xiaoling (Sean) Yu Ph.D.
In this presentation that I gave in the 9th Annual Capital Allocation and Stress Testing Conference, I advocated for a coherent risk management framework that integrates Economic Capital and Stress Testing, after compared and contrasted the two.
This document discusses different methods for stress testing portfolios, including historical and hypothetical scenarios. It defines stress testing as quantifying potential extreme adverse outcomes in a portfolio. Historical stress testing replays the impacts of actual historical events on a portfolio, while hypothetical stress testing involves invented scenarios. The document explores two historical and two hypothetical approaches, discussing their advantages and disadvantages. It emphasizes the importance of senior management support and stakeholder involvement in selecting stress testing scenarios.
In spring 2016, PwC investigated the current state and
future direction of stress testing. We surveyed 55 insurers
operating in the US about their stress testing framework and
the specific stresses that they test. We also engaged in more
detailed dialogue with a number of insurers in the US and
globally, as well as with some North American insurance
regulators.
Final Stress Test paper for Federal ReserveJoe Barber
This document analyzes stress tests and capital adequacy measurements for banks in the Dallas FDIC region. It discusses previous research on stress tests and their ability to predict financial institution stability. The study aims to use historical data from a sample of banks to predict future financial performance and default risk. It focuses on smaller banks under the Dallas FDIC office to determine what factors influence the accuracy of capital adequacy measurements, finding that institutions with initially higher capital levels tended to experience greater decreases during adverse conditions.
Dynamic Stress Test diffusion model and scoring performanceZiad Fares
This document proposes a methodology for dynamically diffusing stress across a credit rating scale when performing stress tests on credit portfolios. It recognizes that existing stress testing practices often do not accurately reflect portfolio behavior under stress. The proposed approach considers how credit score performance impacts default rates across rating classes under stress conditions. It involves using a beta distribution to model default rates pre-and post-stress, then establishing a relationship between credit score metrics like the Gini index and the level of stress applied to each rating class. The approach is demonstrated on a real SME loan portfolio to show how it can more accurately reflect portfolio risks under stress compared to uniform stress diffusion methods typically used.
Ch cie gra - stress-test-diffusion-model-and-scoring-performanceC Louiza
The 2008 crisis has demonstrated the importance of conducting stress tests to prevent banking failure. This exercise has also a significant impact on banks’ capital, organization and image.
This paper aims to provide a methodology that diffuses the stress applied on a credit portfolio while taking into account risk and performance for each rating category.
The content is structured in three parts:
The importance of stress testing and the impacts on reputation
Methodology for a dynamic stress diffusion model
Study on a real SME portfolio showing that the model designed in this paper captures relationship between Gini index and the stress diffusion
Mercer Capital's Community Bank Stress Testing: What You Need to KnowMercer Capital
While there is no legal requirement for community banks to perform stress tests, recent regulatory commentary suggests that community banks should be developing and implementing some form of stress testing on at least an annual basis.
Whether you are considering performing the test in-house or with outside assistance, this webinar will be of interest to you. This webinar: covers the basics of community bank stress testing; reviews the economic scenarios published by the Federal Reserve; provides detail on the key steps to developing a sound community bank stress test; and discusses how to analyze and act upon the outputs of your stress tests.
Stress Testing Commercial Real Estate Loans – No Time Like the PresentCBIZ, Inc.
A well-planned stress testing process should help management ensure that it has a defensible, forward-looking, capital planning process. It can also help banks get a jump start on the new credit loss impairment accounting model, which takes effect in 2020 for public companies.
This thesis examines the impact of the three main quantitative easing announcements by the US Federal Reserve on the equity value of US financial intermediaries. An event study is conducted on 51 US banks to analyze abnormal and cumulative returns around the announcement dates. Additionally, a cross-sectional regression is performed to determine if the impact differed based on banks' financial characteristics as measured by the CAMEL model. The results provide evidence that the initial QE announcement had a strong positive impact on financial intermediaries, while the second and third announcements showed mixed evidence. Additional findings indicate the QE program benefited financially weaker banks more.
Crimson Publishers-The Risk Level of Viet Nam Listed Medical and Human Resou...CrimsonPublishers-SBB
The Risk Level of Viet Nam Listed Medical and Human
Resource Company Groups After the Global Crisis
2009-2011 by Dinh Tran Ngoc Huy in Significances of Bioengineering & Biosciences
This document discusses two new exchanges that plan to trade securities futures - OneChicago and Nasdaq Liffe. OneChicago is a partnership between the CBOE, CME, and CBOT exchanges, with the goal of taking advantage of their combined resources to trade securities futures. Nasdaq Liffe is a joint venture between Nasdaq and Liffe that will leverage Nasdaq's technology and experience in the cash equities market and Liffe's derivatives expertise. Both exchanges received regulatory approval in 2002 and are preparing to launch securities futures trading to capitalize on new opportunities allowed under recent deregulation.
The document summarizes key changes in the Basel Committee's revised market risk framework, known as Fundamental Review of the Trading Book (FRTB). It introduces more complex capital calculations under the internal models approach, with requirements for multiple scenario analyses and risk factor combinations that significantly increase processing needs. It also requires clearer position classification and metadata for regulatory capital calculations. Banks will need enhanced data management and risk aggregation capabilities to integrate information across business units. The substantial technology impacts suggest a long-term, flexible implementation approach rather than short-term minimum compliance.
This document discusses portfolio stress testing as a tool to help trustees address concerns about the impact of extreme market events on portfolios. It defines portfolio stress testing as quantifying potential adverse outcomes under stressful market conditions to identify weaknesses. The summary describes the key aspects of implementing stress testing, including:
1) Involving trustees and managers to define plausible stressed scenarios reflecting concerns.
2) Executing the stress test scenarios to derive portfolio values.
3) Analyzing results and using outcomes to potentially restructure portfolios to limit downside risks from extreme events.
Basel 1 and Basel 2 promote banking safety and soundness. Basel 1 introduced risk-based capital requirements but had weaknesses. Basel 2 builds on Basel 1 with three pillars: minimum capital requirements calculated based on credit, market and operational risk; supervisory review of risk management; and market discipline through disclosure. It utilizes internal ratings-based and standardized approaches to determine capital requirements in a more risk-sensitive manner.
Similar to Stress testing & sensitivity Analysis -Requirements and methods (20)
Stress testing & sensitivity Analysis -Requirements and methods
1. Stress Testing and Sensitivity Analysis:
Requirements and Methods
Name: Ananya Bhattacharyya
Designation: Business Analyst, Genpact Analytics & Research
Business Vertical: Financial Services Analytics
E-Mail: ananya.bhattachryya@genpact.com
Date: 31st December 2015
Genpact Analytics & Research
2. 2
Table of Contents
StressTesting 4
Why Stress testing is required:Regulatory guidelines 4
Howstress testing helps to assessthe financialhealth of an Institution 4
Solvency Test 4
Liquidity Test 5
Methodsof StressTesting 5
Scenario Analysis 5
MacroeconomicStressTesting 6
Approachesof MacroeconomicStressTesting 6
PPNRasa stress testing tool 7
SensitivityAnalysis 7
Regulatory Guidelines 8
VariousMethodsforSensitivityAnalysis 9-11
Differentmethodsfortheinput variation 11
CaseStudy 11-16
Result Interpretation & Conclusion 16
References
3. 3
Abstract
The global financial crisis has brought the spotlight on stress testing both as a regulatory requirement and as an internal
risk management tool. This paper depicts the evolution of stress testing as a regulatory requirement and finds out why it
is being considered very important as a supervisory tool. The first part of the paper attempts to discuss different types of
stress testing based on the ultimate objective it serves and the various approaches followed by the regulators for
carrying out this exercise. It also throws light on the regulators’ changing focus towards making the entire exercise
dynamic by including pre-provision net revenue (PPNR) for capturing the variability in projected loss. It has made an
attempt to discuss a few mostly used quantitative methods for sensitivity analysis and their major advantages and
disadvantages. The second part applies a logistic regression based model for estimating default probabilities on
consumer loan portfolio. A few approaches of sensitivity analysis and stress testing have been applied on this model to
check how the model is performing under stress scenarios and the results have been interpreted.
Key Words
Stress Testing, Sensitivity Analysis, Probability of Default model, Risk, Regulations
Paper Type
Technical
4. 4
1. Stress Testing:
Stress testing has been conceived as a key component of the Financial Sector Assessment Program (FSAP) and
presently it is being used as an analytical tool in Global Financial Stability Reports (GFSRs). Stress testing measures
the vulnerability of a financial institution or an entire system under different hypothetical scenarios and helps to chalk out
proactive measures that can act as a future shock absorber.
1.2. Why Stress testing is required: Regulatory guidelines
Stress testing has become a regulatory requirement only after passing of the Dodd-Frank Wall Street Reform and
Consumer Protection Act (Dodd-Frank Act or DFA) of 2010, motivated by the widely perceived success of the Federal
Reserve's Supervisory Capital Assessment Program (SCAP) of 2009. Practical implementation of banks' stress testing
(Dodd-Frank Act stress testing or DFAST) began in early 2011 with the release of the Comprehensive Capital Analysis
and Review (CCAR) stress scenarios by the Federal Reserve. As defined in Fed’s website “CCAR is an annual exercise
by the Federal Reserve to assess whether the largest bank holding companies(BHCs) operating in the United States
have sufficient capital to continue operations throughout times of economic and financial stress and that they have
robust, forward-looking capital-planning processes that account for their unique risks.” The 2011 CCAR contained only
one stress scenario with nine domestic variables and was more limited in scope than its successors. The 2012 CCAR
expanded the number of domestic variables, added international variables and provided the series for both baseline and
stressed scenarios. Now the standard format includes baseline, adverse and severely adverse scenarios. DFAST is a
complementary exercise to CCAR conducted by the Fed to assess whether institutions have sufficient capital to absorb
losses and support operations during adverse economic conditions.
Table1.2.1: Evolution of stress testing as a regulatory requirement
To validate the capital calculation Basel Committee on Banking Supervision, 2005 states that stress testing will be
employed to verify that the minimum capital computed under Basel II is sufficient to protect against macroeconomic
downturns. In the Basel II framework (BCBS 2006), stress testing is part of Pillar I and Pillar II whereby banks are asked
to analyze possible future scenarios that may threaten their solvency.
Based on the regulatory guidelines provided in section 1.2, stress testing evaluates an institution’s performance along
two lines- solvency and liquidity.
Timeline: Regulatory guidelines
2009 2010 2011 2012 2013
CCAR: $10
BILLION &
ABOVE
CCAR:
$50
BILLION
&
ABOVE
CCAR:
TOP 19
BHCS
DODD
FRANK
REFORM
SCAP
5. 5
1.3. How stress testing helps to assess the financial health of an Institution
1.3.1. Solvency Test:
A solvency test assesses whether a financial institution will be sufficiently solvent (value of its asset is larger than debt
ensuring a positive equity capital) when put into a hypothetically challenging situation by studying changes in its balance
sheet variables. Solvency is measured by the capital adequacy ratio, debt to equity ratio or capital shortfall (i.e, the
amount of capital needed to maintain a certain capital ratio) defined by regulatory requirement. A financial institute will
pass the solvency test if its capital ratio is above the “hurdle rate” (set on minimum regulatory requirement).
1.3.2 Liquidity Test:
Liquidity tests examine the resilience of the financial institution or system under shocks. If under adverse economic
scenario huge amount of deposits is withdrawn suddenly and the banks do not have enough cash inflows or liquid
assets then they face liquidity crisis. The bank can withstand this crisis if it starts selling its liquid assets or by using
repos but it can also happen that the value of the collaterals fall during an adverse economic situation. In this case the
liquidity crisis may actually turn into a solvency crisis. Hurdle rate in case of a liquidity stress test can be fixed by tak ing
into consideration the net cash flow position of the bank or the stressed liquidity ratio.
1.4. Methods of Stress Testing
Stress tests can be divided into two categories: scenario analysis and sensitivity tests.
1.4.1. Scenario analysis:
The scenarios are based either on
1. Portfolio-driven approach
Or
2. Event-driven approach
Table 1.4.1: Approaches towards scenario analysis
Portfolio driven Event driven
Risk drivers of a given portfolio are identified and then
plausible scenarios are designed under which those
factors are stressed.
This approach is based on plausible events and how
these events might affect the relevant risk factors for a
bank or a given portfolio.
Under each approach scenarios can be developed either based on historical events (past crisis) or hypothetically (that
have not yet happened).
Based on the ultimate objective stress tests can be of four types-
Table 1.4.1.1: Types of Stress Testing depending on the objective
Type Internal Risk Management Crisis Management Macro prudential Micro prudential
Objective Financial institutions use
stress testing to measure and
manage risk with their
investment. It serves as an
input for business planning
After the financial
crisis supervisory
authorities use stress
testing to check
whether the key
institutions need to be
recapitalized
Ensures system wide
monitoring and
analyze the system
wide risk
This entails
supervisory
assessment of the
financial health of
individual institutions
6. 6
1.4.1.2. Macroeconomic Stress Testing:
A stress test can look into the impact of one source of risk or multiple sources of risks. Risk factors can be combined or
can be generated using a macroeconomic framework. Allen and Saunders (2004) provided a detailed study on the
impact of cyclical effects on major credit risk parameters (e.g., probability of default (PD), loss given default (LGD),
exposure at default (EAD) etc.) and they were found to be highly exposed. For macro scenario stress tests empirical
relationship between key risk parameters (probability of default (PD), loss given default (LGD) etc.) and relevant
macroeconomic variables (GDP, unemployment rate etc.) are checked. Macro scenario stress tests should take into
consideration at least one economic cycle. This implies for net interest income models it should cover an interest rate
cycle and for non-interest income models it should cover one business cycle. Macro stress tests are carried out taking
non-performing loans (NLPs) as dependent variable and various macroeconomic variables like GDP growth, interest
rates, inflation, real wages, oil price etc. as main drivers for corporate credit risk (Virolainen,2004).For household sector
these factors can be unemployment rate, interest rate etc.
Suppose there are k macroeconomic risk drivers that are expected to have an impact on a bank’s portfolio and a vector
of stressed macroeconomic drivers is Xstress= (X1,…, Xk). The model for measuring the PD of obligor j looks like
PDj =1/1+exp (-β0 -∑ β𝑛
𝑖=1 i .K j,I - ∑ 𝛾𝑘
𝑙=1 l.Xl)
where Ki are obligor specific risk drivers. To compute the stressed PD we can simply put Xstress into the above
formula.These PDs are then used in the calculation of expected losses and regulatory capital under stress.
Table 1.4.1.2: Approaches for translating macro scenarios into balance sheets
Approach Description Advantage Disadvantage
Bottom Up Granular borrower
level analysis
Granular risk
factor driven
approach leads
to more precise
results
Uses advanced
internal model
Provides detailed
risk analysis and
risk management
capacity of an
institution
The result it provides is
institution specific. Hence,
comparison across similar
institutions can be difficult.
Implementing this approach is
resource intensive
Top down The impact is
estimated using
aggregated data
Ensures
uniformity in
methodology and
consistency of
assumptions
across all the
institutions
An effective tool
for validating
bottom up
approaches
Applying the tests only to
aggregate data can disguise
concentration of exposures to
risk at the level of individual
institutions
Risk estimates may not be
precise due to limited data
coverage
7. 7
Both of these approaches are used as complements rather than as substitutes by the regulators to extract the
advantages of both the approaches and minimize their challenges. Liquidity tests are mostly conducted as bottom- up
exercise because they require granular individual level analysis.
1.4.1.3. PPNR as a Stress Testing Tool:
During the initial years of evolution of stress testing as a regulatory measure major thrust was given on ensuring that
banks should understand the potential impact of credit losses on capital. Gradually, when the banks achieved an
improved state in their credit risk modeling competency regulators found PPNR estimation more meaningful because it
covers more variations on credit losses. Traditionally stress testing methods mainly focused on loss calculation only but
for a complete assessment of capital adequacy under stressed scenarios both the balance sheet and the income
statement must be taken into consideration. SCAP changed the traditional method of stress testing and included
profitability (pre- provision net revenue) to make the exercise dynamic. Historical relationship between the
macroeconomic variables and the revenue components is estimated and projected into the future for BHCs.
Pre-provision net revenue (PPNR) = net interest income+ non-interest income- non-interest expense
Table 1.4.1.3: An overview of PPNR Modeling
Data Requirement Advantages Challenges
10 years of monthly
balance and fee data
Portfolio level balance
histories
Records of management
actions(e. g, marketing or
pricing strategies)
It helps to understand the
variability in projected loss –
thus helping in a more
transparent capital
management and allocation
PPNR modeling enhances
firm’s ability to foresee and
identify extreme but possible
risk at various levels.
It serves as an important tool
for liquidity management by
looking at enterprise wide
stress tests results.
Model granularity: If the
institution models on each
balance sheet or P&L item it
would become cumbersome and
the model would reflect little
macro sensitivity.
Data availability: Most BHCs do
not have detailed revenue
related time series data of at
least 8-10 years required for
PPNR modeling due to changes
in internal strategy, business
structure or unavailability of a
robust data management
system. Back testing of model is
quite hard due to limited data.
So it is difficult to check the
consistency of the results.
1.4.2. Sensitivity Analysis:
One of the very important requirements for a model is that the modeler provides an evaluation of the confidence in the
model. Hence along with the quantification of uncertainty in any model, an evaluation of how much each input is
contributing in the uncertainty of the output is equally important and that is where sensitivity comes into play. Generally,
sensitivity analyses are conducted by: (a) defining the model and its independent and dependent variables (b) assigning
probability density functions to each input parameter, (c) generating an input matrix through an appropriate random
8. 8
sampling method,(d) calculating an output vector, and (e) assessing the influences and. It helps reducing model
uncertainty and therefore improves model robustness with regard to:
Magnitude of sensitivity
Output uncertainty reduction
Model simplification (by removing unnecessary parameters)
Enhancing model transparency
Evaluation of model confidence
Excerpt from Regulatory guidelines:
According to SR Letter 11-7 guidelines, “Banks should employ sensitivity analysis in model development and validation
to check the impact of small changes in inputs and parameter values on model outputs to make sure they fall within an
expected range. Unexpectedly large changes in outputs in response to small changes in inputs can indicate an unstable
model. Varying several inputs simultaneously as part of sensitivity analysis can provide evidence of unexpected
interactions, particularly if the interactions are complex and not intuitively clear.” To be specific, sensitivity analysis i s a
technique used to determine how change in the values of an independent variable can impact a particular dependent
variable under a given set of assumptions. It is a way to predict the outcome of a decision if the situation turns out to be
different from the one used for key prediction(s).
In sensitivity tests, risk factors are moved instantaneously by a unit amount and the source of the shock is not identified.
Moreover, the time horizon for sensitivity tests is generally shorter in comparison with scenarios.
Fig. 1.4.2.: Sensitivity analysis: A diagrammatic representation
Portfolio disaggregation PD/LGD/EAD shock calibration Result interpretation
Loan
Portfolio
Asset
type A
Asset
type B
Asset
type C
PD/LGD/EAD
shock
Stressed
portfolio
Sensitivity Analysis Diagram
Profit
effect
Solvency
effect
9. 9
1.4.2.1. Various methods for Sensitivity Analysis:
Table 1.4.2.1: Different types of sensitivity analysis and their advantages and disadvantages
Method Procedure Advantage Disadvantage
One factor at a
time (OFAT)
sensitivity
measure /
partial
sensitivity
analysis
Repeatedly varying one parameter at a
time while holding the other inputs fixed
and then monitoring changes in the
output
It is the most simple
and common
approach best
suited for linear
model.
They examine only
small perturbations
and do not explore
full input space. It
does not work well
with non-linear
models since it
ignores interaction
with other inputs.
Multiple factor
at a time
sensitivity
measure
Examine the relationship between two
or more simultaneously changing inputs
and the model output. The variation
could be
1. Percentage change
2. Standard deviation
3. Best or worst “possible” values
(extreme values) of inputs etc.
The outputs can be
presented as
scatterplots, tornado
diagrams etc. Such
presentations help
assess the rank
order of key inputs
or key drivers. It
considers aggregate
impact of multiple
inputs, hence more
accurate.
It is typically limited
to two inputs since it
is difficult to assess
the impact for three
or more inputs
Regression
Analysis
It typically involves fitting a relationship
between inputs and an output. The
effect of inputs on the output can be
studied using regression coefficients,
standard error of regression coefficients
and the level of significance of the
regression coefficients.
It allows evaluation
of sensitivity of
individual model
inputs taking into
account the
simultaneous impact
of other model
inputs on the result.
Possible lack of
robustness if key
assumptions of
regression are not
met
Difference in
Log-Odds
Ratio (DLOR)
The odds ratio of an event is a ratio of
the probability that the event occurs to
the probability that the event does not
occur. DLOR is used to examine the
difference between the outputs when
the input changes and when it is at its
baseline value.
It can be used when
the output is a
probability
It cannot be used for
non-linear models
Response
Surface
It is used to represent the relation
between a response variable (output)
and one or more explanatory inputs
It helps to reduce
the model in such a
Most RS studies are
based on fewer
inputs compared to
10. 10
Method (RSM) using a sequence of designed
experiments to obtain optimal response.
It can be thought of as “model of a
model” (Frey et al., 2005).To develop a
response surface least squares
regression is used to fit a first or second
order equation to the original data. After
developing, the sensitivity of the model
output to the inputs can be determined
by either employing regression analysis
or other sensitivity analysis to the
response surface (Frey et al., 2005).
form so that
computation can be
much faster. It can
also be used when
the output is a
probability.
original model.
Therefore the effect
of all original inputs
on the sensitivities
cannot be evaluated.
Fourier
Amplitude
Sensitivity
Test (FAST)
It is used to estimate the expected
value and variance of the output and
the contribution of individual inputs to
the variance of the output. For example,
a relatively large conditional variance of
expected value of model output Y given
a set of parameters xi (i.e, V (E(y| xi))
will indicate that a relatively large
proportion of model output variance is
contributed by parameter xi. The ratio of
the contribution of each input to the
output variance and the total variance of
the output gives the first order
sensitivity index.
It is better than
OFAT as it can
apportion the output
variance to the
variance in the
inputs. First order
sensitivity indices
are used to rank the
inputs (Saltelli et al.,
2000).
First order indices
cannot capture the
interaction among
the inputs. Saltelli et
al (1999) developed
the extended FAST
method which can
address this
limitation but it is a
complex procedure
to carry.
Mutual
Information
Index
It is a conditional probability analysis. It
provides a measure of the information
about the output that is provided by a
particular input. The magnitude of the
measure can be compared for different
inputs to determine which input
provides useful information about the
output. It involves three general steps:
(1) generating an overall confidence
measure of the output value which is
estimated from the CDF of the output;
(2) obtaining a conditional confidence
measure for a given value of an input by
holding an input constant at some value
and varying all other inputs; and (3)
calculating sensitivity indices (Critchfield
and Willard, 1986):
IaXY = ∑x ∑y PX PY|Xlogn (PY | X / PY)
where,PY|X = conditional confidence;
PY = overall confidence;
PX = probability distribution for the input;
and n = 2, to indicate binary output.IaXY
is always positive. If IaXY is large, then
X provides a great deal of information
about Y. If X and Y are statistically
independent, then it is zero.
MII includes the joint
effects of all the
inputs when
evaluating
sensitivities of an
input. Correlation
coefficient of two
random variables
examines the
degree of linear
relatedness of the
variables. MII is a
more informative
method.
Calculation of the
MII by Monte Carlo
techniques suffers
from computational
complexity
11. 11
Scatter Plot
It is used for visual
assessment of the influence of
individual inputs on an output
It is the first step in
sensitivity analysis
to identify the nature
of association
among variables.
It is tedious to
generate if there are
large number of
inputs and outputs.
1.4.2.2 Different methods for the input variation considering the type of model and the data
available:
1. Choosing a percentage range:
It is possible to select the variation range as a percentage and then change the input consequently. For
example, the input variable may be varied by -20% and +20% and then the impact on the model performance is
observed.
2. Choosing a standard deviation factor:
The main limitation with the previous method is that it only addresses sensitivity relative to a chosen point and
not for the entire parameter distribution. Here each parameter is individually increased by a factor of its
standard deviation.
3. Choosing the extremes:
An alternative method is to calculate the sensitivity index (SI) by checking the change in the output level under
ceteris paribus condition by taking the minimum and maximum values of each input.
The process is in 3 steps:
First, the corresponding outputs coming from the calculation with the minimum and maximum of the selected
input are computed
Second, the corresponding 𝑂𝑢𝑡 𝑚𝑖𝑛 and 𝑂𝑢𝑡 𝑚𝑎𝑥 values resulting of the previous step are figured out
Third, the %change is calculated:
%𝑐ℎ𝑎𝑛𝑔𝑒 =
𝑂𝑢𝑡 𝑚𝑎𝑥−𝑂𝑢𝑡 𝑚𝑖𝑛
𝑂𝑢𝑡 𝑚𝑎𝑥
2. Case Study:
Let us look at a probability of default (PD) model used on commercial loan portfolio. The model is a logistic regression
based model using separate dummy variables for companies belonging to different industries. An initial model is
defined, based on which different scenarios were considered for the purpose of quantifying their impact on probability of
default. We studied operating revenue for the year 2010, company age, number of employees, dummies for different
industries and their impact on default rate. The dependent variable (default rate) is restricted to the values of zero or
one, where one indicates bad loan and zero indicates good loan. After performing regression analysis, we consider only
those independent variables that are significantly related to the dependent variable. Once the model is developed, the
signs of the parameter estimates associated with each variable are analyzed. Each sign suggests the relationship
(positive/negative) of an independent variable with the dependent variable.
12. 12
Table 2.1: Final variables and their relation with default rate
Variable Sign
Operating revenue(2010) Negative
Number of employees(WOE) Negative
Company age Positive
Dummy for companies belonging to consumer industries Positive
Dummy for companies belonging to hotel industries Positive
A convincing negative relation with the default rate and operating revenue was found. The relation with number of
employees is also significant. Positive relation with the company age for the sector Consumer industries and hotel
industries were found. It can be concluded that if any economic downturn affects the companies and operating revenue
falls, it will significantly impact default rate.
Fig 2.1: Portfolio distribution industry wise
0
5
10
15
20
25
Distribution(%)
Portfoliodistributionby industry
Samplesize
13. 13
Fig 2.2: Industry wise Default rate
After model development sensitivity analysis has been conducted to see how the model is performing based on
Kolmogorov-Smirnov Statistic (KS statistic), a model discriminatory measure and Somers’ D to check the accuracy in
the prediction.
• KS is the measure of maximum separation between good and bad distribution. Higher value of the KS statistic
reflects the higher quality of the scorecard.
• Somers′ D =
Number of pairs that are concordant – Number of pairs that are discordant
Total Number of pairs.
• The % of pairs for which the predicted probability of the event given the occurrence of the event is greater than
predicted probability of the event given the non-occurrence of the event is called percentage concordant and
vice-versa. Theoretically Somers’ D ranges from -1 to +1. For an accurate model, higher value of Somers’ D is
preferred.
For our original model KS was reported as 32.3 and Somers’ D as 0.387.Now let us check after adopting a few
approaches of Sensitivity Analysis how the model is performing in terms of KS and Somers’ D.
2.1. Sensitivity Analysis:
2.1.1. One factor at a time:
Mean, Standard Deviation, maximum and minimum values for all the variables were noted. To check how the default
rate is sensitive to each parameter we replaced the variables with their mean values and checked the movement of KS
and Somers’ D. Table 2.1.1.1 displays the results.
0%
5%
10%
15%
20%
25%
30%
35%
Distribution(%)
Industry wise Default rate
Default rate
14. 14
Table 2.1.1.1: Impact of changing one factor at a time on KS and Somers’ D
The model was rebuilt taking into consideration only consumer industry and OFAT was applied and how the model
discriminatory power was varying was noted. Table 2.1.1.2. shows the result.
Table 2.1.1.2: Impact of changing one factor at a time on KS and Somers’ D considering Consumer industry
Again, the model was redeveloped taking into consideration only hotel services industry and same procedure was
applied.
Table 2.1.1.3: Impact of changing one factor at a time on KS and Somers’ D considering Hotel industry
Parameter KS Somers’ D
Company age replaced with mean 32 0.384
Operating revenue replaced with
mean
17.7 0.243
WOE value of number of employees
replaced with minimum WOE
30.2 0.383
Parameter KS Somers’ D
Original model taking only consumer
industry
35.9 0.389
Company age replaced with mean 34.7 0.388
Operating revenue replaced with
mean
13.9 0.202
WOE value of number of employees
replaced with minimum WOE
33.8 0.385
Parameter KS Somers’ D
Original model taking only hotel
industry
34 0.382
Company age replaced with mean 33.3 0.381
Operating revenue replaced with
mean
15.5 0.225
WOE value of number of employees
replaced with minimum WOE
30 0.381
15. 15
2.1.2 Multiple factor at a time:
Two inputs were simultaneously changed and the model performance was checked.
Table 2.1.1.4: Impact of changing two factors simultaneously on KS and Somers’ D
It can be concluded from the above methods of Sensitivity Analysis that the variable operating revenue is highly
impacting model’s discriminatory power and accuracy level of prediction. So it is the key parameter to check the
institution’s financial health.
2.2 Stress Testing:
Since we do not have any macroeconomic variable in our dataset and data is available for only one year (2010) it was
neither possible to do macroeconomic stress testing nor to check the performance period. So, we simply increased the
default rate of the population creating hypothetical stressed scenarios and checked the model performance in terms of
KS and Somers’ D.
Default rate of the original data was 2.1% and average estimated probability of default for the model was 0.021. KS for
our original model was reported as 32.3 and Somers’ D as 0.387.This represents the base scenario. For stress testing
the default rate of the model was gradually increased and consequently stressed PDs were calculated. Table 2.2 and
figure 2.2 show the behaviour of KS and Somers’ D of the respective models resulting from the following stress
scenarios.
Table 2.2.: Model’s performance against various stress scenarios
Stress scenario Stressed PD KS Somers’ D
Default rate=2.9% 0.029 32.2 0.395
Default rate=3.5% 0.035 31.5 0.376
Default rate=4.4% 0.044 31.3 0.376
Default rate=5.3% 0.053 31.4 0.373
Parameter KS Somers’
D
Company age replaced with mean + Operating revenue replaced with mean 18.2 0.223
Company age replaced with mean + WOE value of number of employees
replaced with maximum WOE
30.2 0.373
Operating rev. replaced with mean + WOE value of number of employees
replaced with maximum WOE
11.3 0.171
16. 16
Default rate=7.7% 0.1 31.7 0.368
Fig 2.2.: Somers’ D against various stress scenarios
2.2.1. Result Interpretation & Conclusion:
From table2.2 and figure 2.2, it can be concluded that model’s accuracy level to predict the probability of default slightly
falls as we increased the default rate. So, under stressed scenarios the model is performing moderately well, implying
that the model is robust and with sufficient accuracy it predicts the probability of default even during stress periods.
From the above analysis it can be concluded that arbitrarily varying a model variable will reveal how sensitive the
portfolio is to that parameter but cannot infer anything about the likelihood of such a stress or how the portfolio might
perform in an economic downturn.
From this case study it can be concluded that no one method is clearly best for risk assessment models. In general,
combining two or more methods may be needed to increase confidence in the model and for ranking the key inputs.
Through this paper due to data limitation exploring all the techniques discussed in the first part of the paper was not
possible. If it was possible to incorporate some macroeconomic variables into the model it would have been possible to
check how the model’s stressed PD is varying against the macroeconomic stressed scenarios and calculate the
associated risk. This paper recommends a future study for exploring all the techniques empirically.
0.395
0.376 0.376
0.373
0.368
0.35
0.36
0.37
0.38
0.39
0.4
Default rate=2.9%Default rate=3.5%Default rate=4.4%Default rate=5.3%Default rate=7.7%
Somers’ D
Somers’ D
17. 17
References:
1. Dietske Simons and Ferdinand Rolwes (Feb,2008),Macroeconomic Default Modelling and stress testing
2. D M Hamby, A review of Techniques for Parameter Sensitivity: Analysis of Environmental Models
3. Christopher Frey, Sumeet Patil (2005), Identification and Review of Sensitivity Analysis Methods
4. IMF(2012), Macro financial Stress Testing: Principles and Practices
5. IMF Working Paper, Designing Effective Macro prudential Stress Tests: Progress So Far and the Way
Forward
6. IMF Working Paper, A Framework for Macro prudential Bank Solvency Stress Testing: Application to S-25
and Other G-20 Country FSAPs
7. Antonella Foglia (Bank of Italy), Stress Testing Credit Risk: A Survey of Authorities’ Approaches
8. Dodd Frank Act Stress Test 2015:Supervisory Stress TEST Methodology and Results March 2015 (Board of
Governors of the Federal Reserve System)
9. BIS (2005), An Explanatory Note on the Basel II IRB Risk weight Functions
10. CCAR submissions- GENPACT internal training material
11. DFAST – GENPACT internal training material
12. PD Modelling – GENPACT internal training material
13. PPNR Modelling - GENPACT internal training material