Download as PDF, PPTX


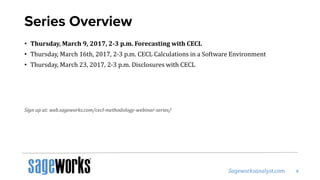

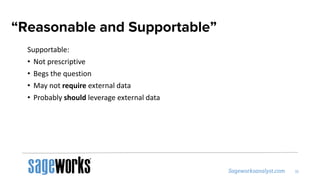
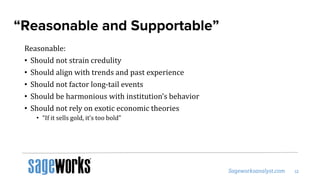


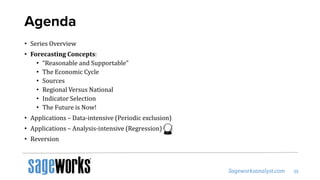


The document outlines a webinar series on the CECL (Current Expected Credit Loss) methodology, covering topics such as forecasting concepts, the economic cycle, and application of data in financial institutions. It emphasizes the importance of using reasonable and supportable forecasts and discusses various indicators and sources for economic forecasting. The presentation also includes disclaimers regarding forward-looking statements and the potential risks involved in forecasting.