Download as PDF, PPTX


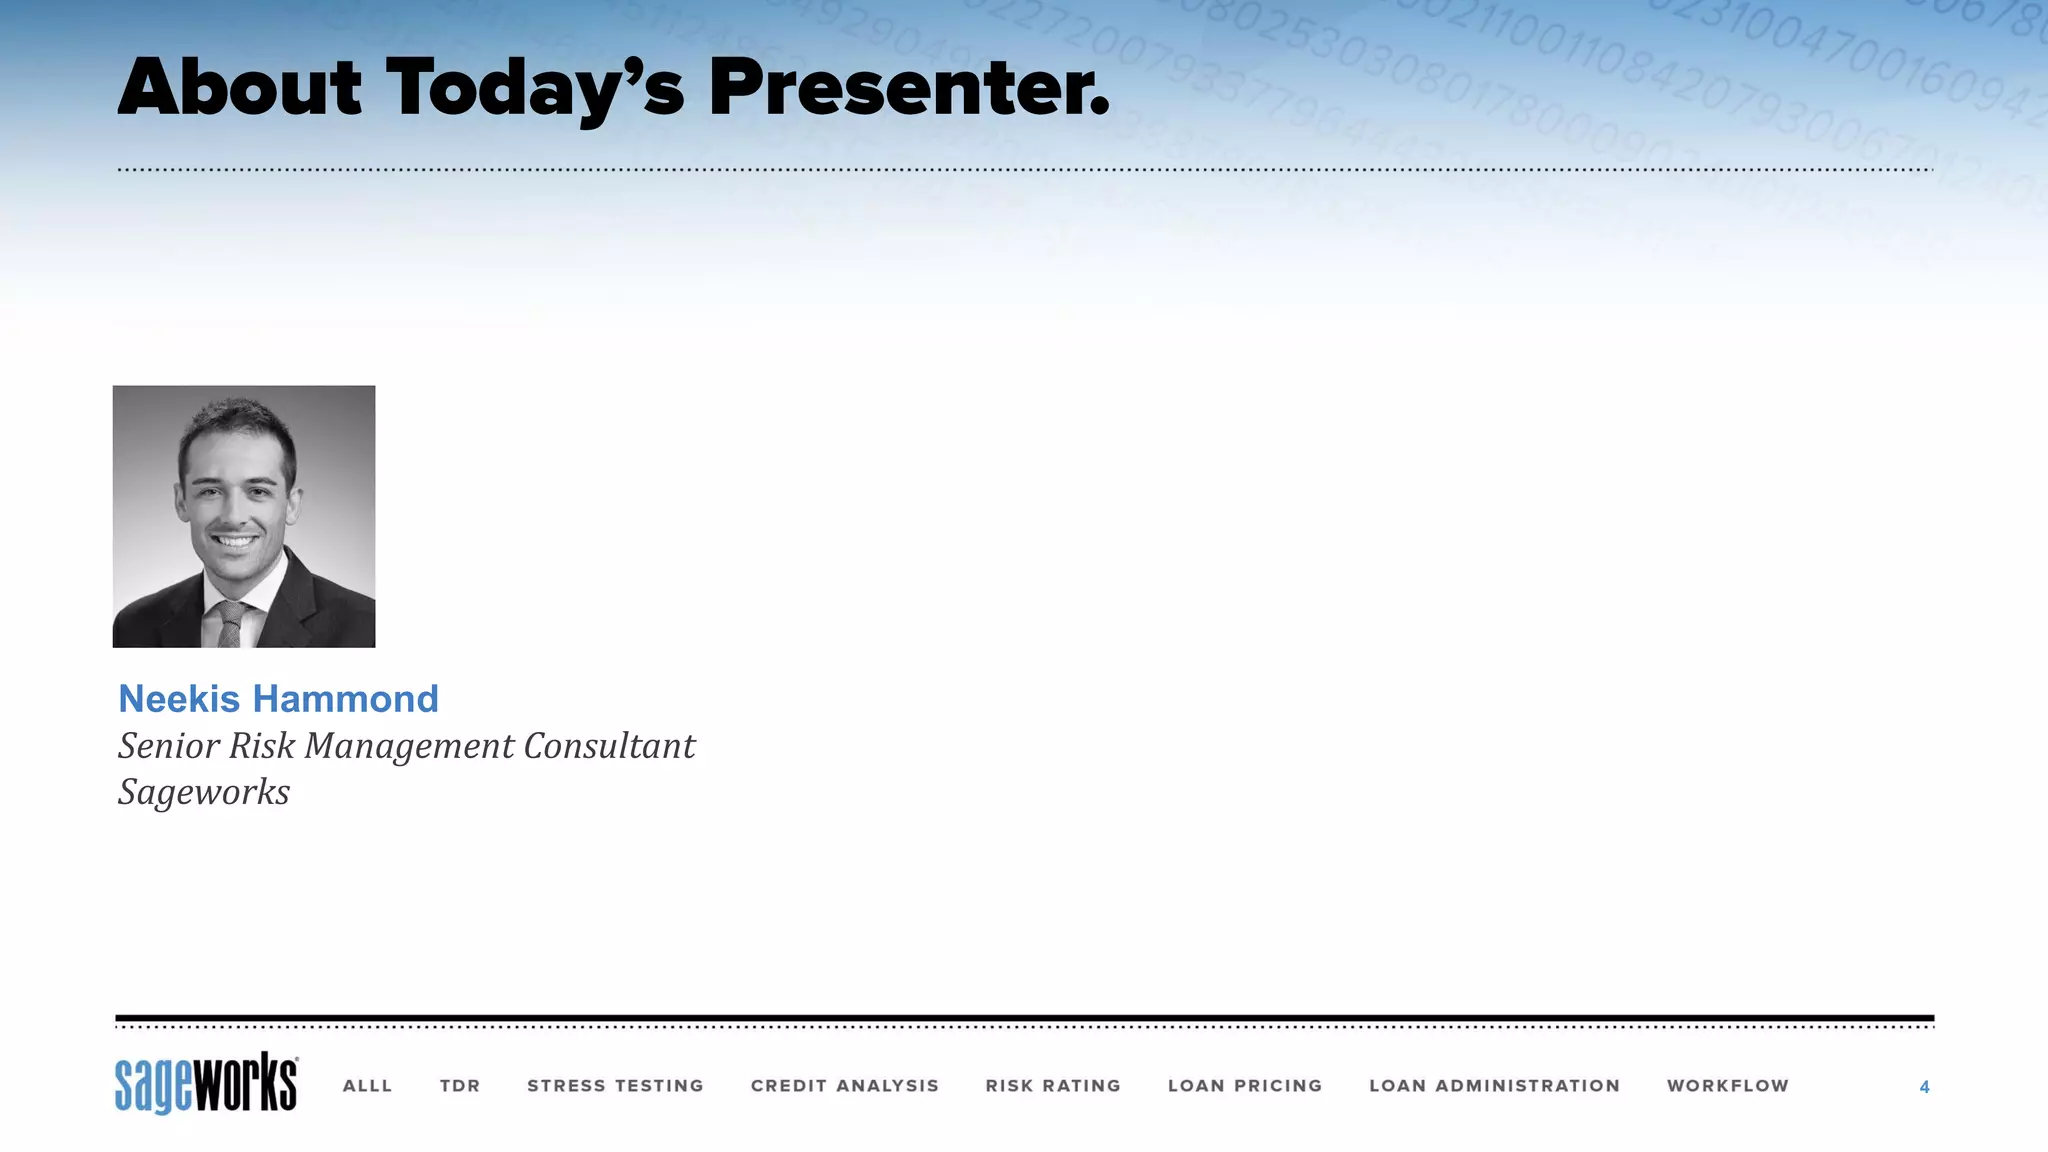

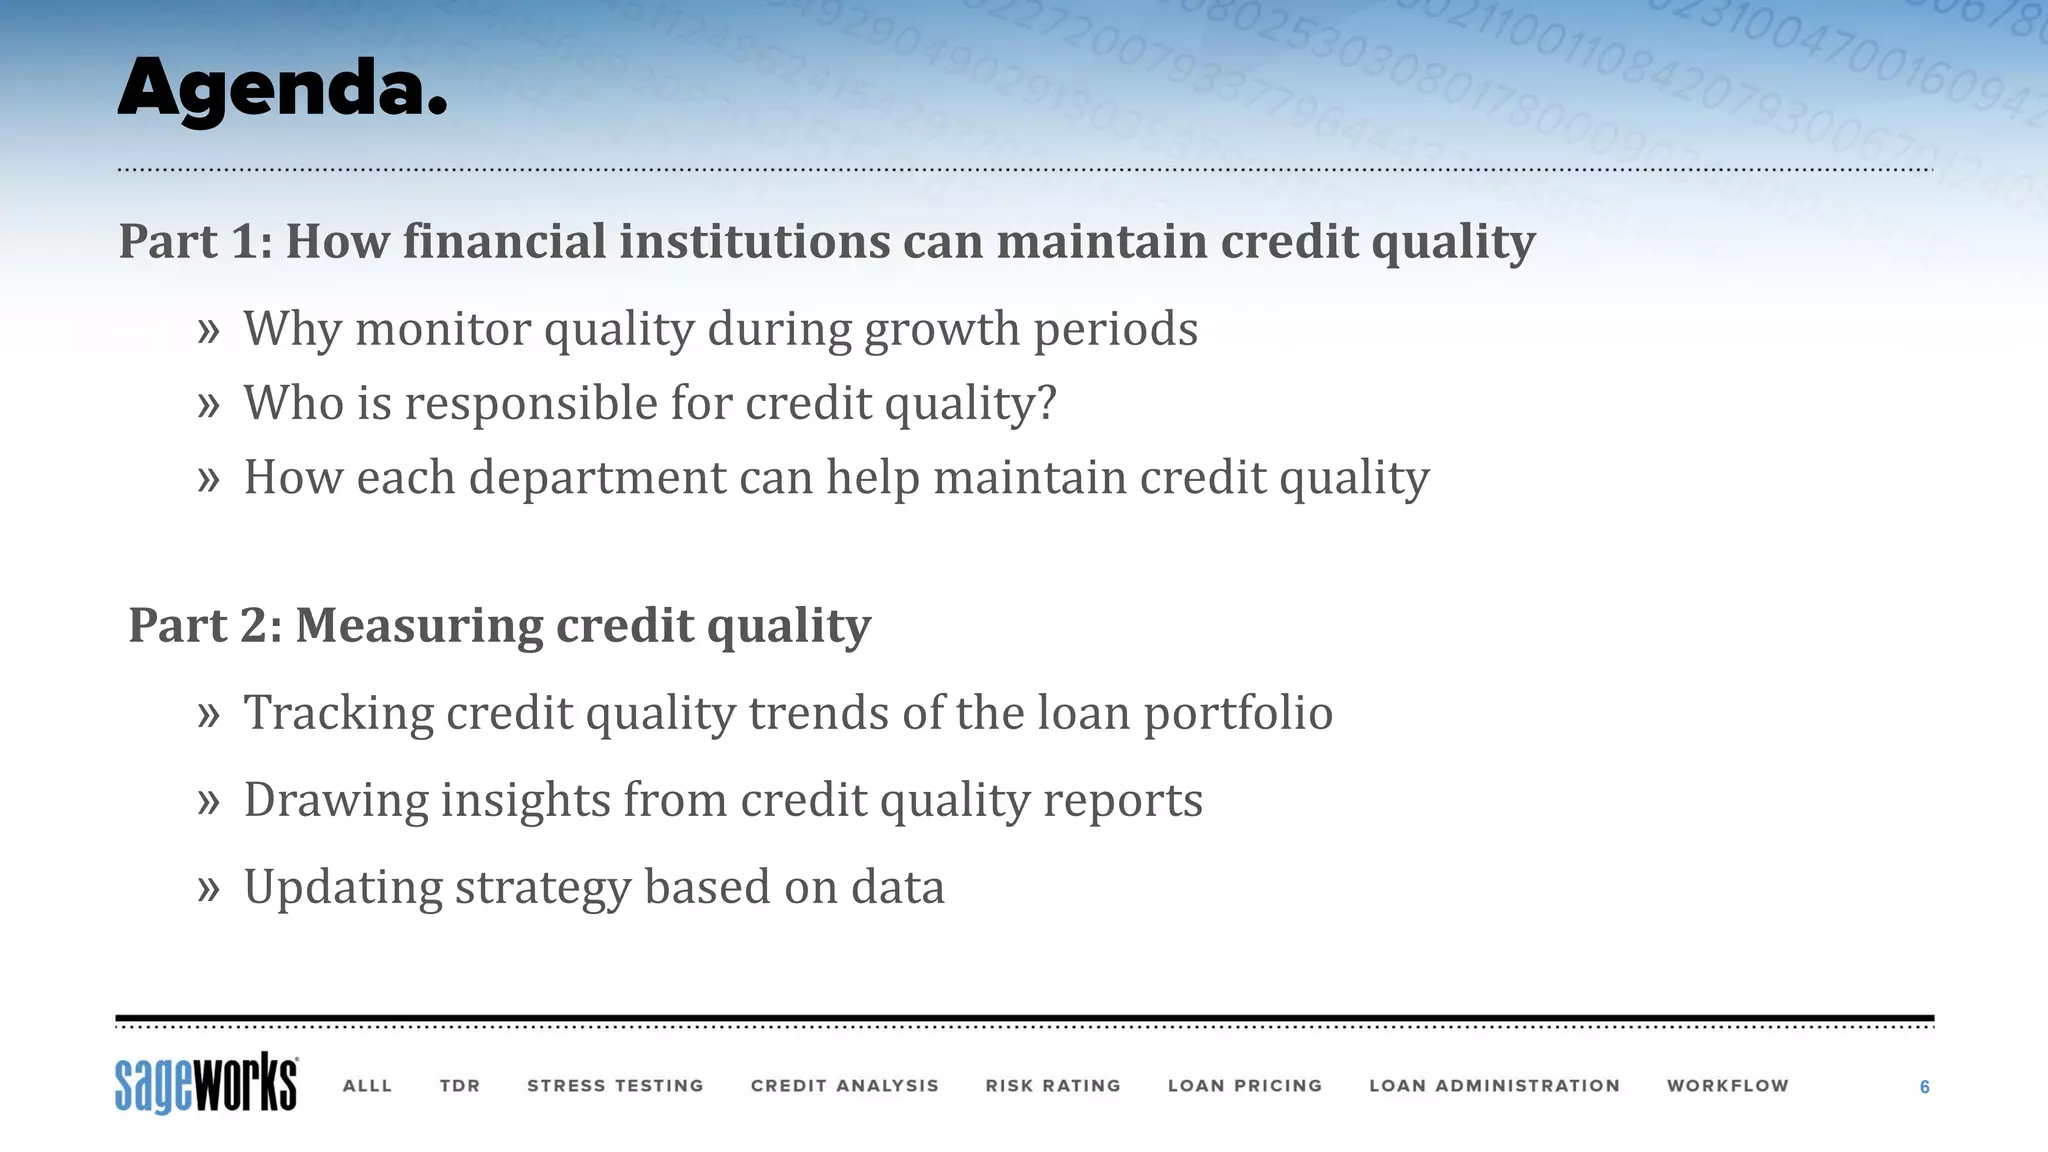


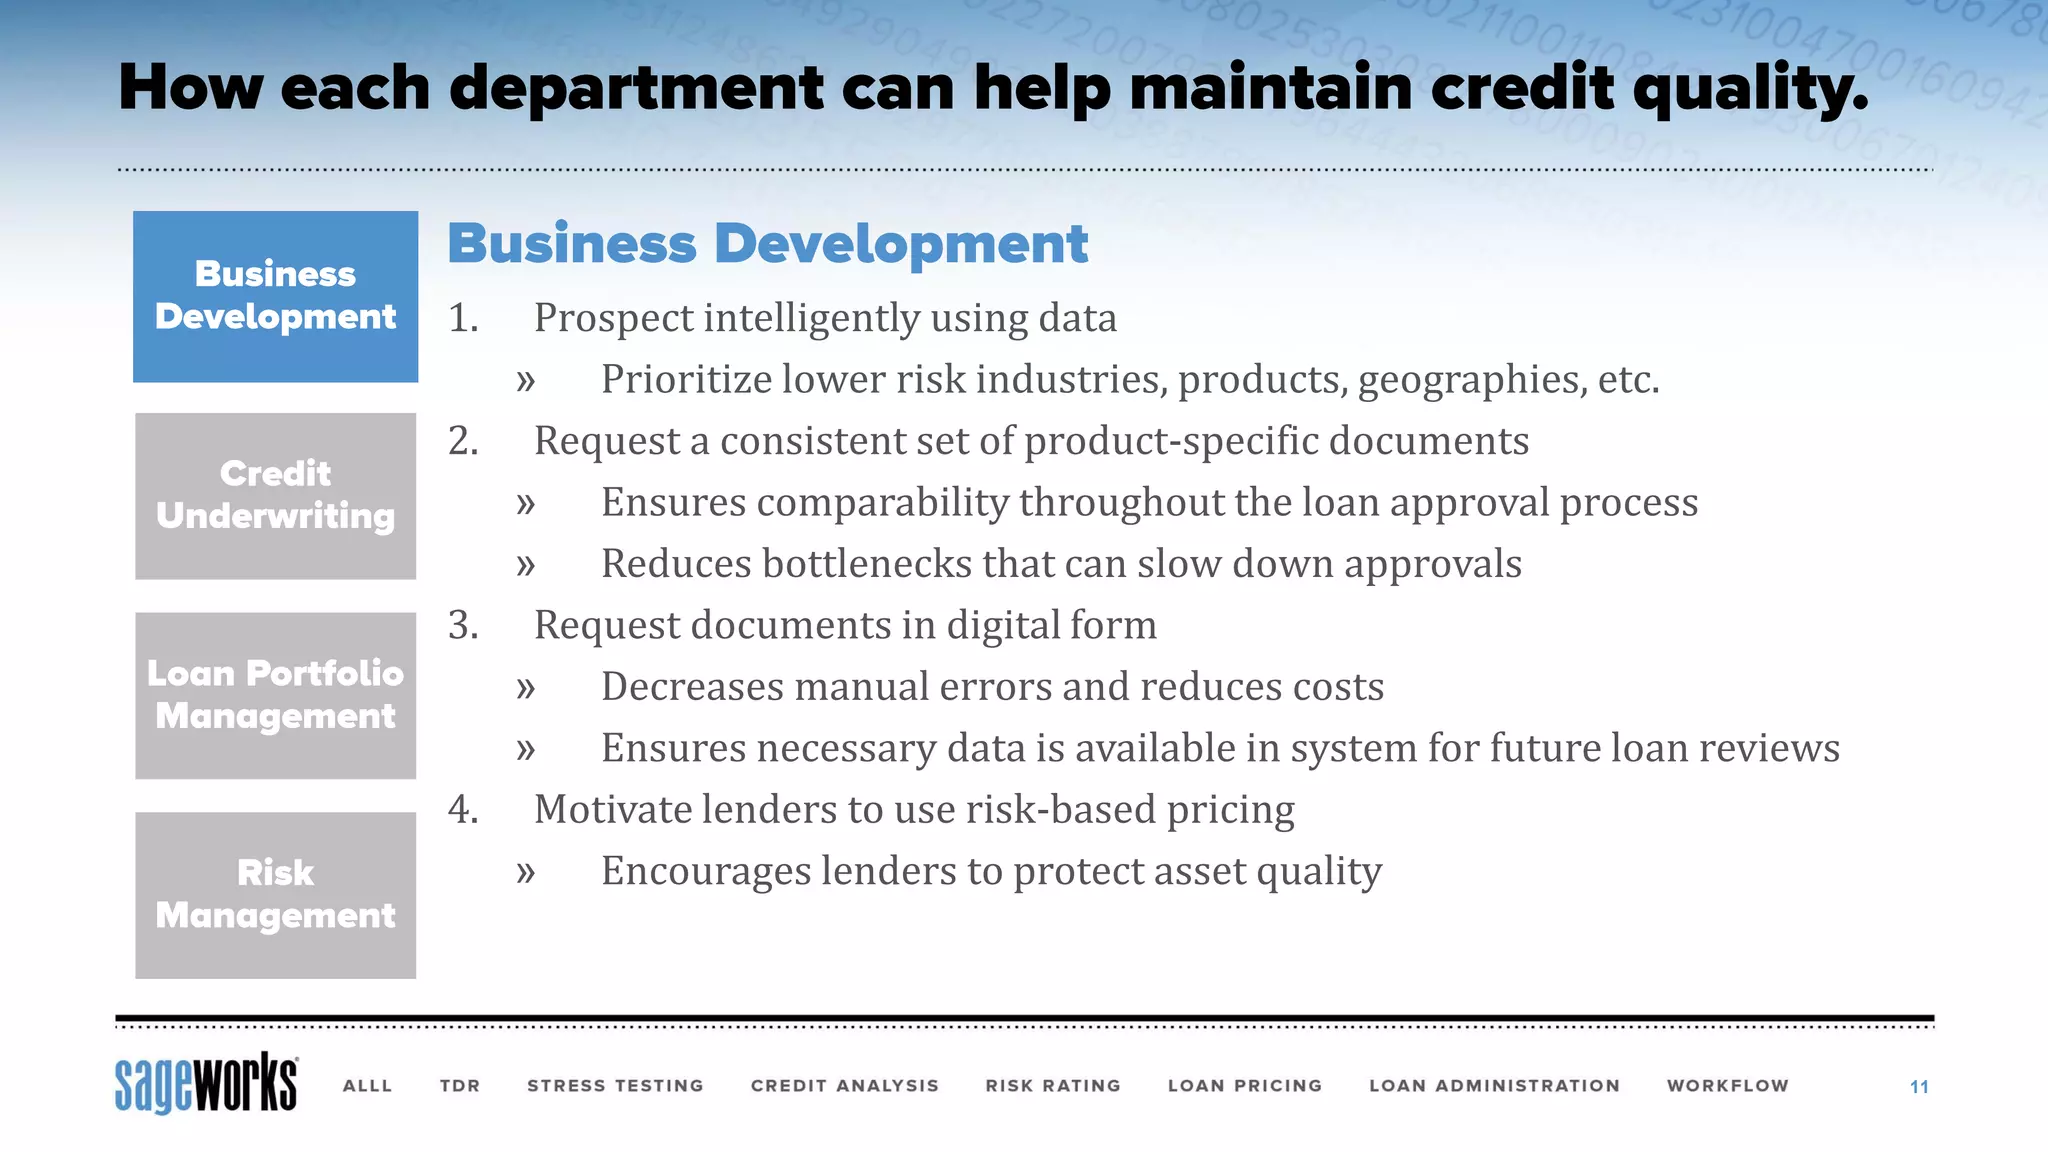


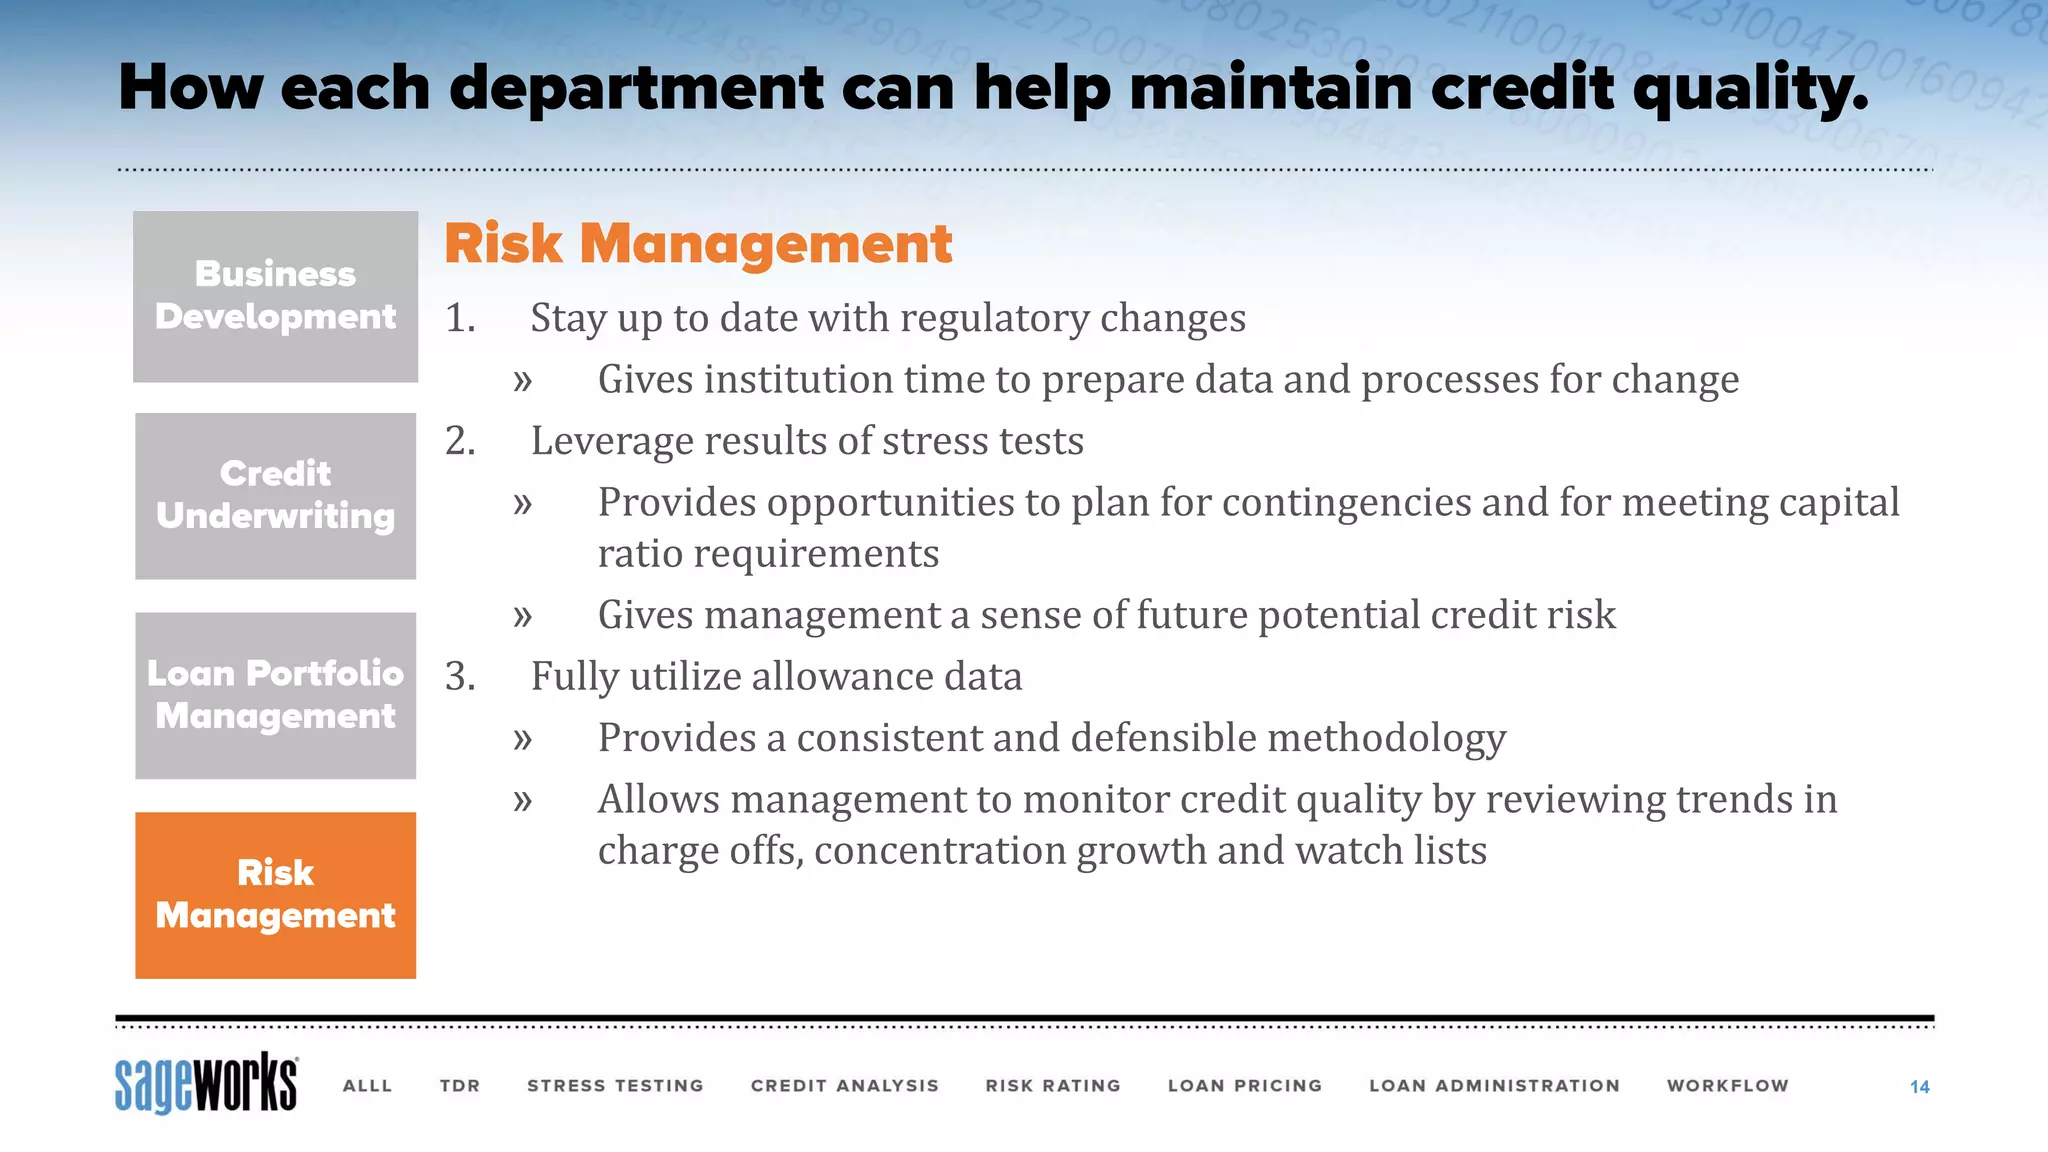


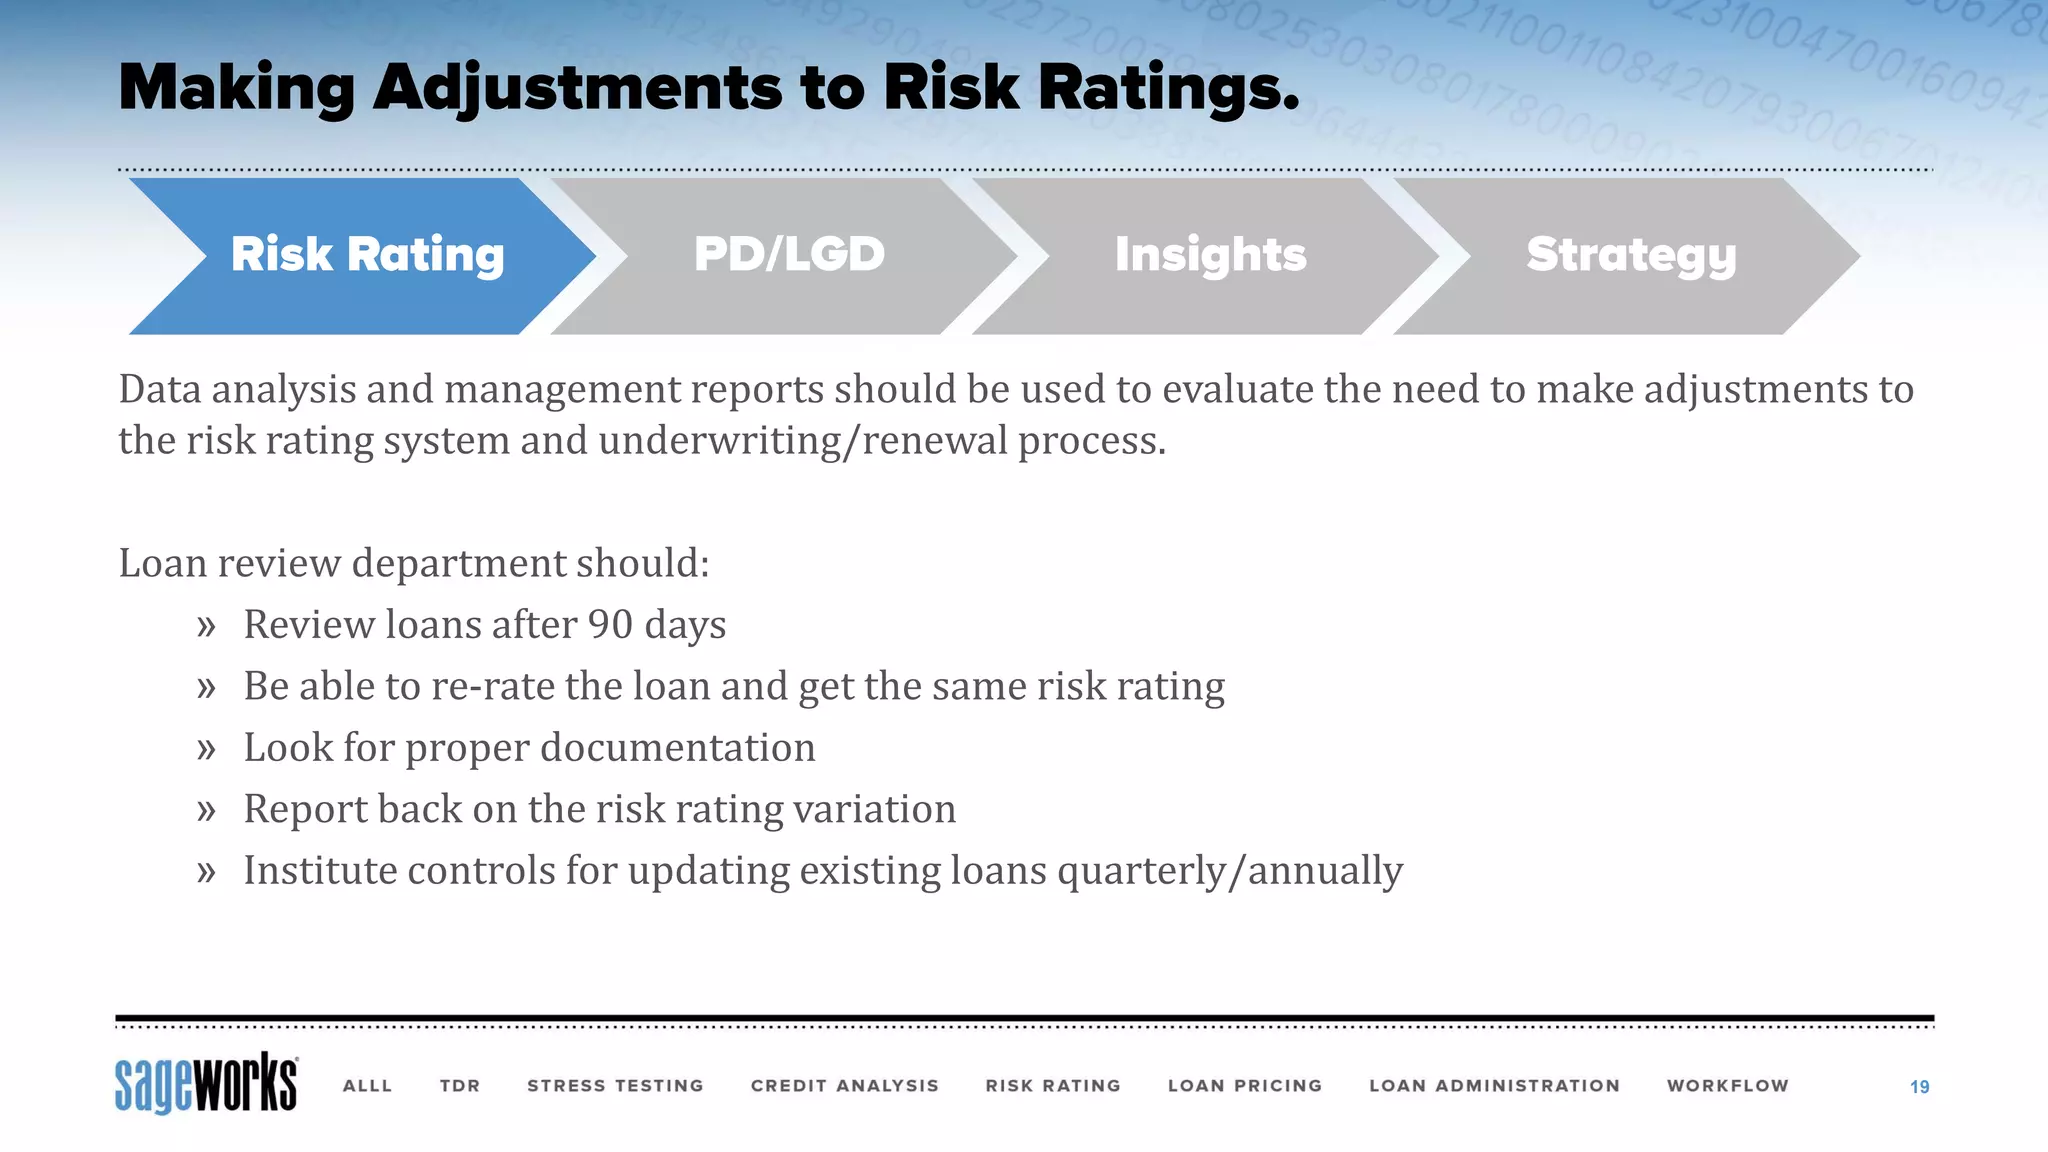


The document summarizes a presentation by Neekis Hammond, a senior risk management consultant at Sageworks, focused on best practices for financial institutions to maintain and measure credit quality. It emphasizes the importance of consistent documentation, data-driven risk assessment, and the use of automated systems to enhance efficiency and accuracy in loan approval processes. The presentation also highlights the need for institutions to stay informed about regulatory changes and to utilize stress testing and credit quality trends to make informed strategic decisions.