Download as PDF, PPTX
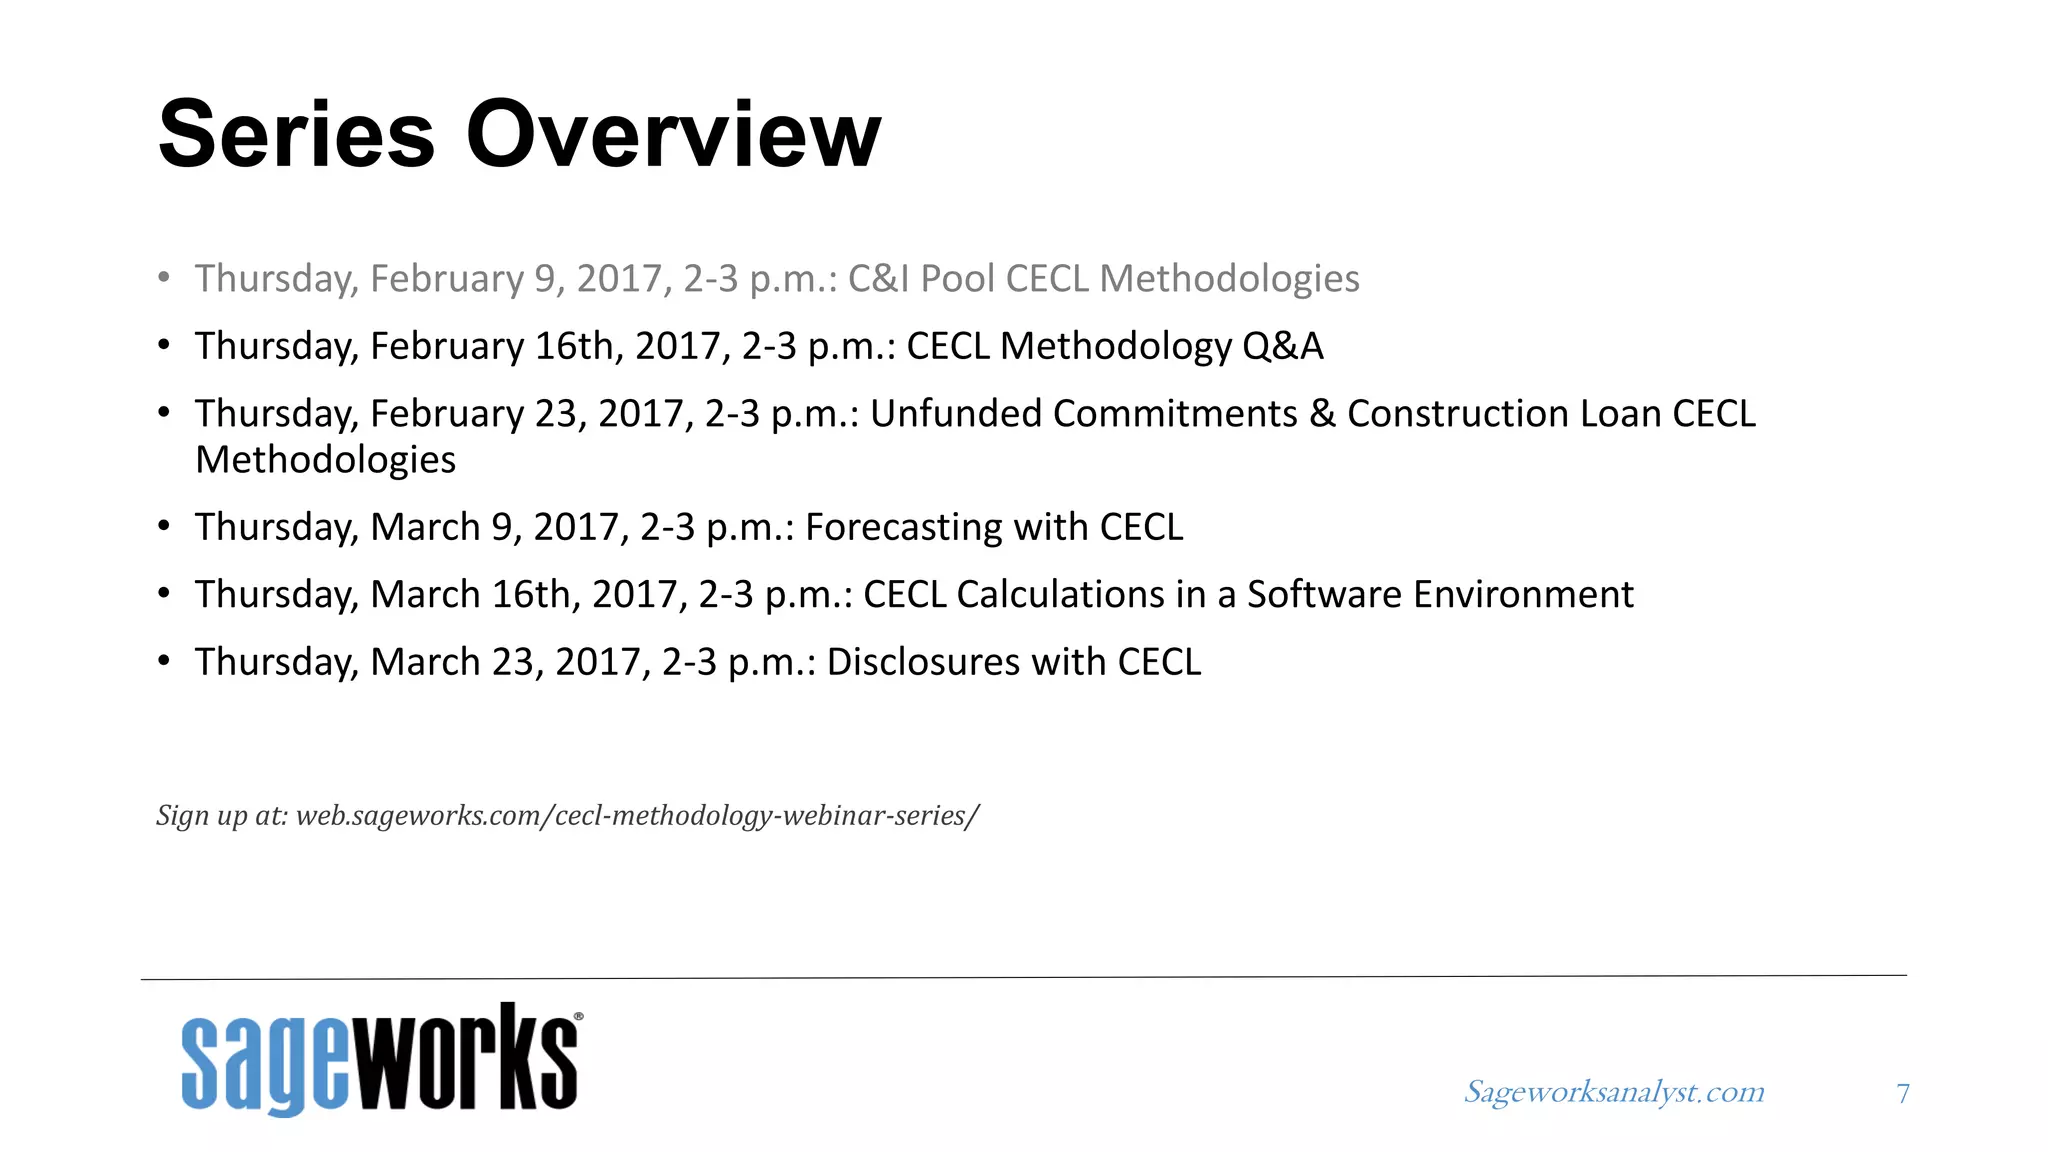

The document provides an overview of a webinar series on the CECL (Current Expected Credit Loss) methodology for commercial and industrial (C&I) loans, presented by Garver Moore and Neekis Hammond of Sageworks. It includes details on the agenda, topics such as segmentation principles and methodologies, as well as implications and considerations for financial institutions. The series aims to enhance understanding of credit loss estimation and risk management specific to C&I loans.


