Summer lecture 2
•Download as PPTX, PDF•
0 likes•252 views

This slide is about stem and leaf display

Recommended
More Related Content
What's hot
What's hot (8)
Viewers also liked
Viewers also liked (20)
Similar to Summer lecture 2
Similar to Summer lecture 2 (20)
More from Zahida Pervaiz
More from Zahida Pervaiz (20)
Recently uploaded
Recently uploaded (20)
Summer lecture 2
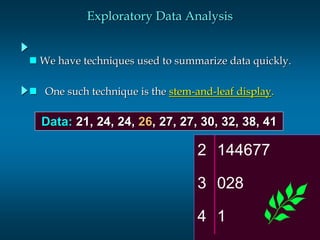
- 1. Slide 1 Exploratory Data Analysis We have techniques used to summarize data quickly. One such technique is the stem-and-leaf display. Data: 21, 24, 24, 26, 27, 27, 30, 32, 38, 41 2 144677 3 028 4 1
- 2. A stem-and-leaf display shows both the rank order and shape of the distribution of the data. It is similar to a histogram on its side, but it has the advantage of showing the actual data values. The first digits of each data item are arranged to the left of a vertical line. digit for each item in rank order--when the leaf unit is not shown, it is assumed to equal 1. Slide 2 Stem-and-Leaf Display To the right of the vertical line we record the next Each line in the display is referred to as a stem. Each digit on a stem is a leaf.
- 3. Slide 3 Example: Hudson Auto Repair The manager of Hudson Auto would like to have a better understanding of the cost of parts used in the engine tune-ups performed in the shop. She examines 50 customer invoices for tune-ups. The costs of parts, rounded to the nearest dollar, are listed on the next slide.
- 4. Slide 4 Example: Hudson Auto Repair Sample of Parts Cost for 50 Tune-ups 91 78 93 57 75 52 99 80 97 62 71 69 72 89 66 75 79 75 72 76 104 74 62 68 97 105 77 65 80 109 85 97 88 68 83 68 71 69 67 74 62 82 98 101 79 105 79 69 62 73 First step is to rearrange these data in rank order. See next slide.
- 5. Slide 5 Solution: Stem-and-Leaf Display 5 6 7 8 9 10 2 7 2 2 2 2 5 6 7 8 8 8 9 9 9 1 1 2 2 3 4 4 5 5 5 6 7 8 9 9 9 0 0 2 3 5 8 9 1 3 7 7 7 8 9 1 4 5 5 9 a stem a leaf So What? Explain! •When the leaf unit is not shown, it is assumed to equal 1.
- 6. Slide 6 Solution: Hudson Auto Repair Sample of Parts Cost for 50 Tune-ups 52 57 62 62 62 62 65 66 67 68 68 68 69 69 69 71 71 72 72 73 74 74 75 75 75 76 77 78 79 79 79 80 80 82 83 85 88 89 91 93 97 97 97 98 99 101 104 105 105 109 Data are rearranged in rank order.
- 7. Slide 7 Tabular and Graphical Procedures Qualitative Data Quantitative Data Tabular Methods Tabular Methods Graphical Methods Graphical Methods •Frequency Distribution •Rel. Freq. Dist. •Percent Freq. Distribution •Bar Graph •Pie Chart •Frequency Distribution •Rel. Freq. Dist. •Cum. Freq. Dist. •Cum. Rel. Freq. Distribution •Stem-and-Leaf Display •Crosstabulation (Contingency Table) •Dot Plot •Histogram •Scatter Diagram Data