Downloaded 40 times
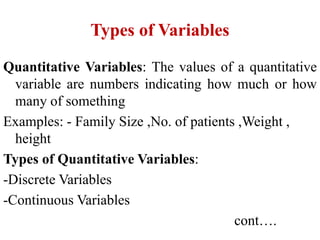
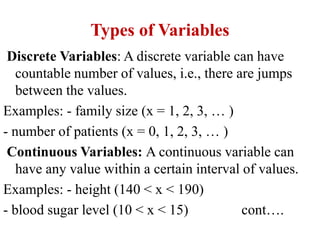
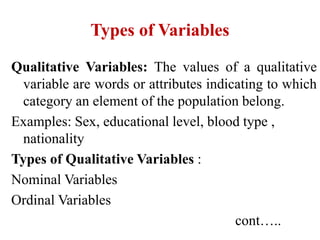
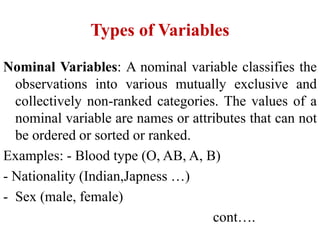
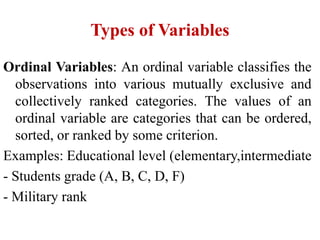

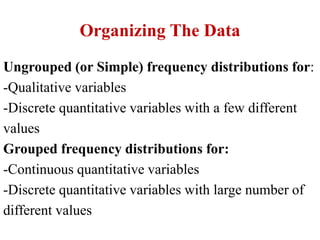
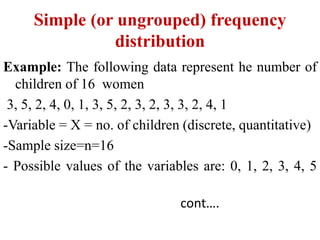
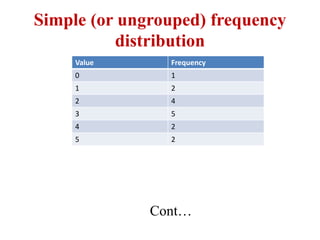
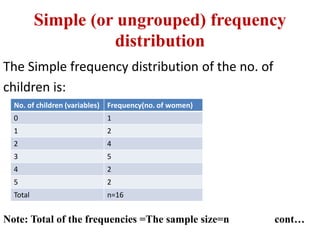
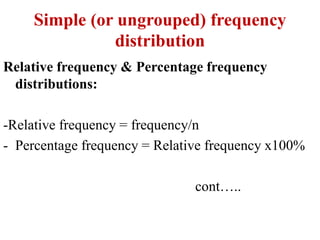
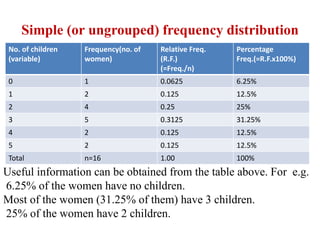
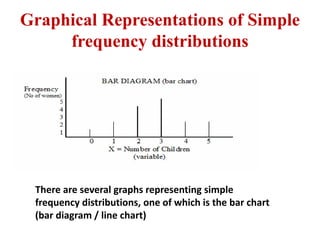

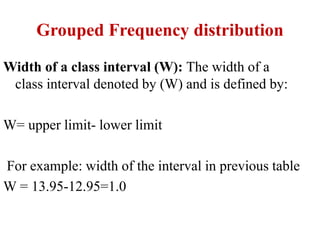
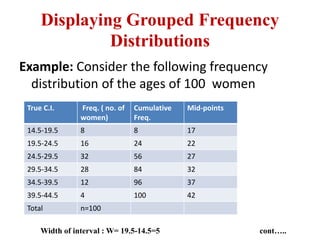
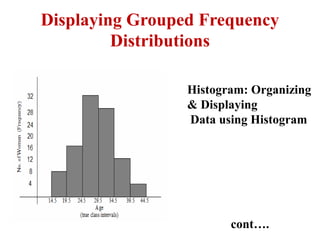
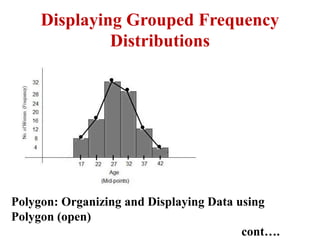
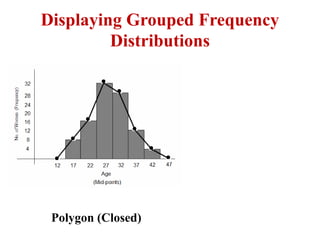


This document discusses organizing and displaying data through statistics. It defines key terms like populations, samples, variables, and different types of variables. It then covers creating simple and grouped frequency distributions to organize raw data through tables. These distributions can be displayed visually through bar charts, histograms, and polygons to summarize the frequency of values within intervals or categories.