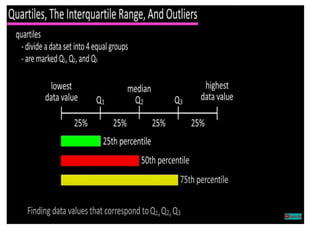
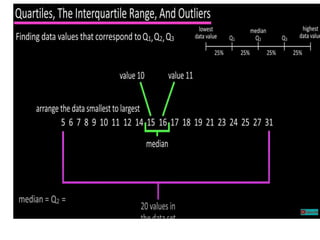
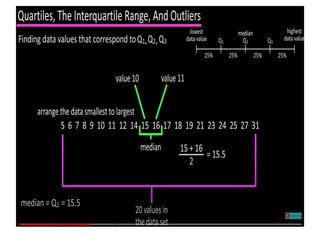
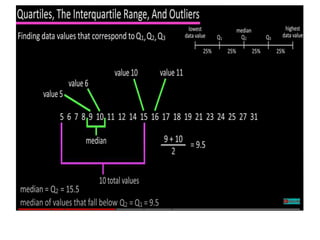
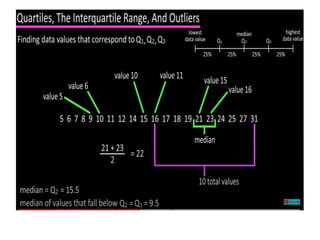
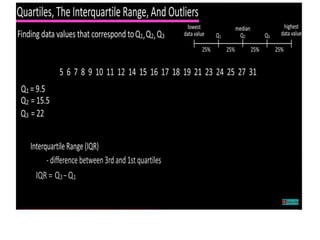
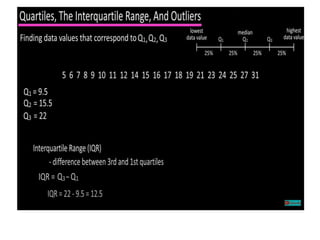
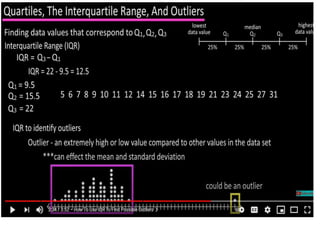
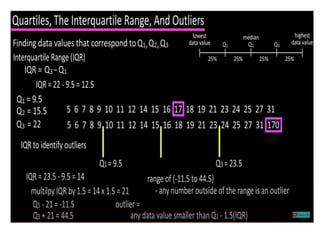
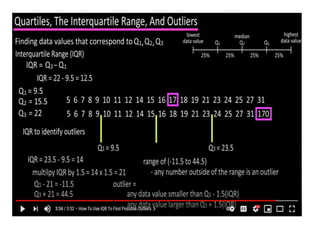
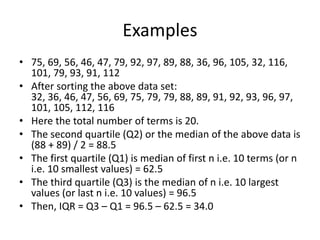
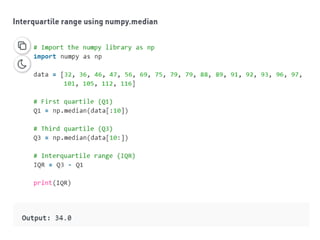
The document discusses the concepts of range, quartiles, and interquartile range (IQR) in data analysis, providing examples of calculation from a given data set. It explains how to determine the median, first quartile, and third quartile, and how the IQR is used for creating box plots and identifying outliers. Additionally, a comparison of interquartile ranges in different data sets is presented, emphasizing that a lower IQR indicates preferable data variability.