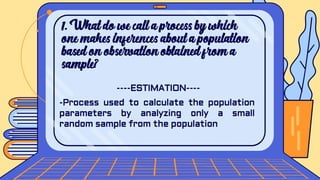
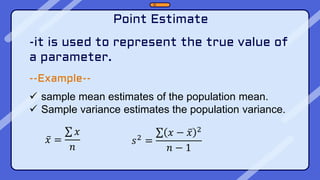
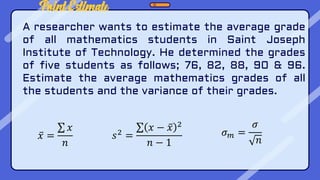
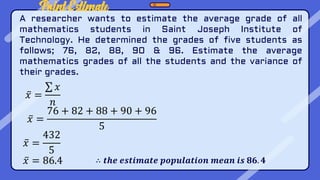
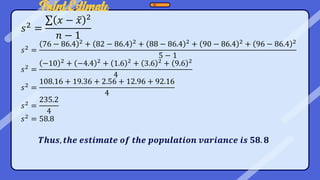
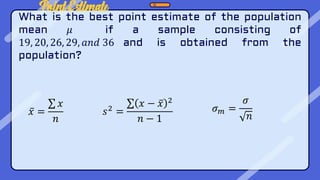
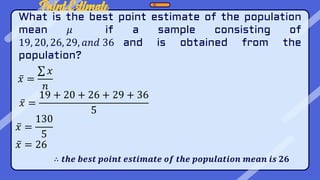
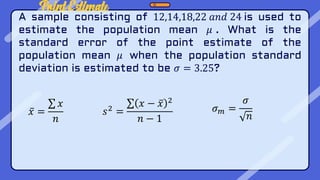
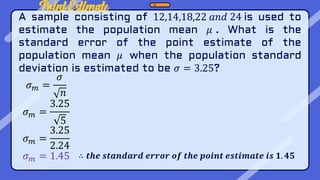
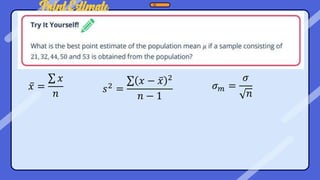
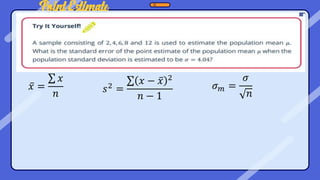
Estimation of Parameters
Statistics and Probability
Descripted measures computed from a sample.
Statistic
Parameters
Descripted measures computed from a population.
Questions
1. What do we call a process by which
one makes inferences about a population
based on observation obtained from a
sample?
2. What do we call the value or range of
values used to approximate a parameter?
3. What are the types of population
Estimate?
1. What do we call a process by which
one makes inferences about a population
based on observation obtained from a
sample?
----ESTIMATION----
-Process used to calculate the population
parameters by analyzing only a small
random sample from the population
2. What do we call the value or range of
values used to approximate a parameter?
----ESTIMATE----
3. What are the types of population Estimate?
A. Point Estimate
B. Interval Estimate
3. What are the types of population Estimate?
A. Point Estimate
-a point estimate of a population parameter
is a single value of a statistics
3. What are the types of population Estimate?
B. Interval Estimate
-range of values within which the parameter
values possibly falls.
Point Estimate
-it is used to represent the true value of
a parameter.
--Example--
 sample mean estimates of the population mean.
 Sample variance estimates the population variance.
𝑥 =
𝑥
𝑛
𝑠2
=
𝑥 − 𝑥 2
𝑛 − 1
Point Estimate
A researcher wants to estimate the average grade
of all mathematics students in Saint Joseph
Institute of Technology. He determined the grades
of five students as follows; 76, 82, 88, 90 & 96.
Estimate the average mathematics grades of all
the students and the variance of their grades.
𝑥 =
𝑥
𝑛
𝑠2
=
𝑥 − 𝑥 2
𝑛 − 1
𝜎𝑚 =
𝜎
𝑛
Point Estimate
A researcher wants to estimate the average grade of all
mathematics students in Saint Joseph Institute of
Technology. He determined the grades of five students as
follows; 76, 82, 88, 90 & 96. Estimate the average
mathematics grades of all the students and the variance of
their grades.
𝑥 =
𝑥
𝑛
𝑥 =
76 + 82 + 88 + 90 + 96
5
𝑥 =
432
5
𝑥 = 86.4 ∴ 𝒕𝒉𝒆 𝒆𝒔𝒕𝒊𝒎𝒂𝒕𝒆 𝒑𝒐𝒑𝒖𝒍𝒂𝒕𝒊𝒐𝒏 𝒎𝒆𝒂𝒏 𝒊𝒔 𝟖𝟔. 𝟒
Point Estimate
𝑠2 =
𝑥 − 𝑥 2
𝑛 − 1
𝑠2
=
76 − 86.4 2
+ 82 − 86.4 2
+ 88 − 86.4 2
+ 90 − 86.4 2
+ 96 − 86.4 2
5 − 1
𝑠2
=
−10 2
+ −4.4 2
+ 1.6 2
+ 3.6 2
+ 9.6 2
4
𝑠2 =
108.16 + 19.36 + 2.56 + 12.96 + 92.16
4
𝑠2 =
235.2
4
𝑠2
= 58.8
𝑻𝒉𝒖𝒔, 𝒕𝒉𝒆 𝒆𝒔𝒕𝒊𝒎𝒂𝒕𝒆 𝒐𝒇 𝒕𝒉𝒆 𝒑𝒐𝒑𝒖𝒍𝒂𝒕𝒊𝒐𝒏 𝒗𝒂𝒓𝒊𝒂𝒏𝒄𝒆 𝒊𝒔 𝟓𝟖. 𝟖
Point Estimate
What is the best point estimate of the population
mean 𝜇 if a sample consisting of
19, 20, 26, 29, 𝑎𝑛𝑑 36 and is obtained from the
population?
𝑥 =
𝑥
𝑛
𝑠2 =
𝑥 − 𝑥 2
𝑛 − 1
𝜎𝑚 =
𝜎
𝑛
Point Estimate
What is the best point estimate of the population
mean 𝜇 if a sample consisting of
19, 20, 26, 29, 𝑎𝑛𝑑 36 and is obtained from the
population?
𝑥 =
𝑥
𝑛
𝑥 =
19 + 20 + 26 + 29 + 36
5
𝑥 =
130
5
𝑥 = 26
∴ 𝒕𝒉𝒆 𝒃𝒆𝒔𝒕 𝒑𝒐𝒊𝒏𝒕 𝒆𝒔𝒕𝒊𝒎𝒂𝒕𝒆 𝒐𝒇 𝒕𝒉𝒆 𝒑𝒐𝒑𝒖𝒍𝒂𝒕𝒊𝒐𝒏 𝒎𝒆𝒂𝒏 𝒊𝒔 𝟐𝟔
Point Estimate
A sample consisting of 12,14,18,22 𝑎𝑛𝑑 24 is used to
estimate the population mean 𝜇 . What is the
standard error of the point estimate of the
population mean 𝜇 when the population standard
deviation is estimated to be 𝜎 = 3.25?
𝑥 =
𝑥
𝑛
𝑠2 =
𝑥 − 𝑥 2
𝑛 − 1
𝜎𝑚 =
𝜎
𝑛
Point Estimate
A sample consisting of 12,14,18,22 𝑎𝑛𝑑 24 is used to
estimate the population mean 𝜇 . What is the
standard error of the point estimate of the
population mean 𝜇 when the population standard
deviation is estimated to be 𝜎 = 3.25?
𝜎𝑚 =
𝜎
𝑛
𝜎𝑚 =
3.25
5
𝜎𝑚 =
3.25
2.24
𝜎𝑚 = 1.45 ∴ 𝒕𝒉𝒆 𝒔𝒕𝒂𝒏𝒅𝒂𝒓𝒅 𝒆𝒓𝒓𝒐𝒓 𝒐𝒇 𝒕𝒉𝒆 𝒑𝒐𝒊𝒏𝒕 𝒆𝒔𝒕𝒊𝒎𝒂𝒕𝒆 𝒊𝒔 𝟏. 𝟒𝟓
Point Estimate
𝑥 =
𝑥
𝑛 𝑠2 =
𝑥 − 𝑥 2
𝑛 − 1
𝜎𝑚 =
𝜎
𝑛
Point Estimate
𝑥 =
𝑥
𝑛 𝑠2 =
𝑥 − 𝑥 2
𝑛 − 1
𝜎𝑚 =
𝜎
𝑛
CREDITS: This presentation template was
created by Slidesgo, including icons by
Flaticon, infographics & images by Freepik
Thank You for Listening
& God bless
Do you have any questions?
Email: roqui.gonzaga22@gmail.com
+63 927 439 6946
Statistics and Probability Estimation of Parameters pptx

Statistics and Probability Estimation of Parameters pptx

  • 1.
  • 2.
    Descripted measures computedfrom a sample. Statistic Parameters Descripted measures computed from a population.
  • 3.
  • 4.
    1. What dowe call a process by which one makes inferences about a population based on observation obtained from a sample?
  • 5.
    2. What dowe call the value or range of values used to approximate a parameter?
  • 6.
    3. What arethe types of population Estimate?
  • 7.
    1. What dowe call a process by which one makes inferences about a population based on observation obtained from a sample? ----ESTIMATION---- -Process used to calculate the population parameters by analyzing only a small random sample from the population
  • 8.
    2. What dowe call the value or range of values used to approximate a parameter? ----ESTIMATE----
  • 9.
    3. What arethe types of population Estimate? A. Point Estimate B. Interval Estimate
  • 10.
    3. What arethe types of population Estimate? A. Point Estimate -a point estimate of a population parameter is a single value of a statistics
  • 11.
    3. What arethe types of population Estimate? B. Interval Estimate -range of values within which the parameter values possibly falls.
  • 12.
    Point Estimate -it isused to represent the true value of a parameter. --Example--  sample mean estimates of the population mean.  Sample variance estimates the population variance. 𝑥 = 𝑥 𝑛 𝑠2 = 𝑥 − 𝑥 2 𝑛 − 1
  • 13.
    Point Estimate A researcherwants to estimate the average grade of all mathematics students in Saint Joseph Institute of Technology. He determined the grades of five students as follows; 76, 82, 88, 90 & 96. Estimate the average mathematics grades of all the students and the variance of their grades. 𝑥 = 𝑥 𝑛 𝑠2 = 𝑥 − 𝑥 2 𝑛 − 1 𝜎𝑚 = 𝜎 𝑛
  • 14.
    Point Estimate A researcherwants to estimate the average grade of all mathematics students in Saint Joseph Institute of Technology. He determined the grades of five students as follows; 76, 82, 88, 90 & 96. Estimate the average mathematics grades of all the students and the variance of their grades. 𝑥 = 𝑥 𝑛 𝑥 = 76 + 82 + 88 + 90 + 96 5 𝑥 = 432 5 𝑥 = 86.4 ∴ 𝒕𝒉𝒆 𝒆𝒔𝒕𝒊𝒎𝒂𝒕𝒆 𝒑𝒐𝒑𝒖𝒍𝒂𝒕𝒊𝒐𝒏 𝒎𝒆𝒂𝒏 𝒊𝒔 𝟖𝟔. 𝟒
  • 15.
    Point Estimate 𝑠2 = 𝑥− 𝑥 2 𝑛 − 1 𝑠2 = 76 − 86.4 2 + 82 − 86.4 2 + 88 − 86.4 2 + 90 − 86.4 2 + 96 − 86.4 2 5 − 1 𝑠2 = −10 2 + −4.4 2 + 1.6 2 + 3.6 2 + 9.6 2 4 𝑠2 = 108.16 + 19.36 + 2.56 + 12.96 + 92.16 4 𝑠2 = 235.2 4 𝑠2 = 58.8 𝑻𝒉𝒖𝒔, 𝒕𝒉𝒆 𝒆𝒔𝒕𝒊𝒎𝒂𝒕𝒆 𝒐𝒇 𝒕𝒉𝒆 𝒑𝒐𝒑𝒖𝒍𝒂𝒕𝒊𝒐𝒏 𝒗𝒂𝒓𝒊𝒂𝒏𝒄𝒆 𝒊𝒔 𝟓𝟖. 𝟖
  • 16.
    Point Estimate What isthe best point estimate of the population mean 𝜇 if a sample consisting of 19, 20, 26, 29, 𝑎𝑛𝑑 36 and is obtained from the population? 𝑥 = 𝑥 𝑛 𝑠2 = 𝑥 − 𝑥 2 𝑛 − 1 𝜎𝑚 = 𝜎 𝑛
  • 17.
    Point Estimate What isthe best point estimate of the population mean 𝜇 if a sample consisting of 19, 20, 26, 29, 𝑎𝑛𝑑 36 and is obtained from the population? 𝑥 = 𝑥 𝑛 𝑥 = 19 + 20 + 26 + 29 + 36 5 𝑥 = 130 5 𝑥 = 26 ∴ 𝒕𝒉𝒆 𝒃𝒆𝒔𝒕 𝒑𝒐𝒊𝒏𝒕 𝒆𝒔𝒕𝒊𝒎𝒂𝒕𝒆 𝒐𝒇 𝒕𝒉𝒆 𝒑𝒐𝒑𝒖𝒍𝒂𝒕𝒊𝒐𝒏 𝒎𝒆𝒂𝒏 𝒊𝒔 𝟐𝟔
  • 18.
    Point Estimate A sampleconsisting of 12,14,18,22 𝑎𝑛𝑑 24 is used to estimate the population mean 𝜇 . What is the standard error of the point estimate of the population mean 𝜇 when the population standard deviation is estimated to be 𝜎 = 3.25? 𝑥 = 𝑥 𝑛 𝑠2 = 𝑥 − 𝑥 2 𝑛 − 1 𝜎𝑚 = 𝜎 𝑛
  • 19.
    Point Estimate A sampleconsisting of 12,14,18,22 𝑎𝑛𝑑 24 is used to estimate the population mean 𝜇 . What is the standard error of the point estimate of the population mean 𝜇 when the population standard deviation is estimated to be 𝜎 = 3.25? 𝜎𝑚 = 𝜎 𝑛 𝜎𝑚 = 3.25 5 𝜎𝑚 = 3.25 2.24 𝜎𝑚 = 1.45 ∴ 𝒕𝒉𝒆 𝒔𝒕𝒂𝒏𝒅𝒂𝒓𝒅 𝒆𝒓𝒓𝒐𝒓 𝒐𝒇 𝒕𝒉𝒆 𝒑𝒐𝒊𝒏𝒕 𝒆𝒔𝒕𝒊𝒎𝒂𝒕𝒆 𝒊𝒔 𝟏. 𝟒𝟓
  • 20.
    Point Estimate 𝑥 = 𝑥 𝑛𝑠2 = 𝑥 − 𝑥 2 𝑛 − 1 𝜎𝑚 = 𝜎 𝑛
  • 21.
    Point Estimate 𝑥 = 𝑥 𝑛𝑠2 = 𝑥 − 𝑥 2 𝑛 − 1 𝜎𝑚 = 𝜎 𝑛
  • 22.
    CREDITS: This presentationtemplate was created by Slidesgo, including icons by Flaticon, infographics & images by Freepik Thank You for Listening & God bless Do you have any questions? Email: roqui.gonzaga22@gmail.com +63 927 439 6946