Downloaded 1,164 times


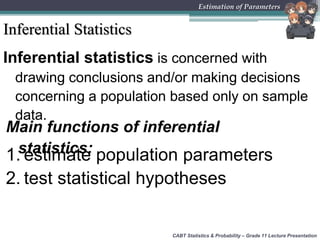
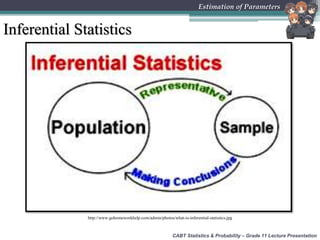
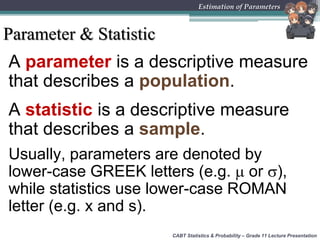
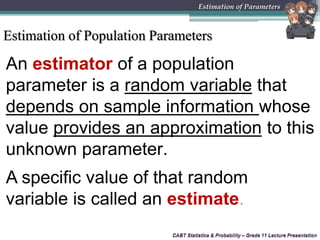
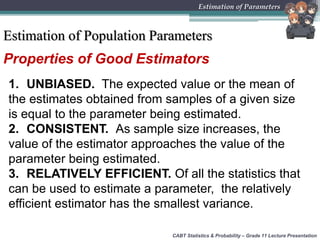
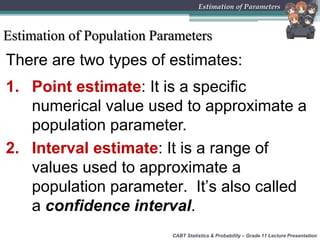

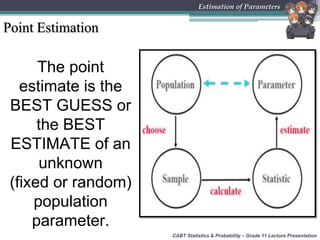
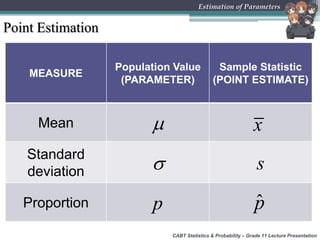
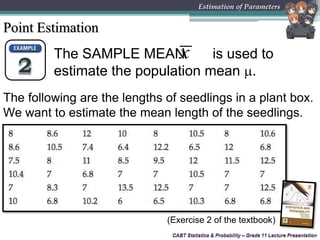
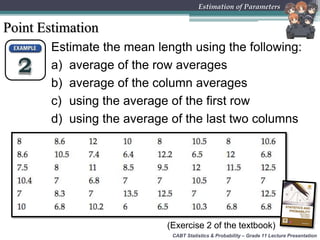
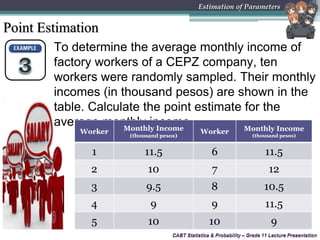


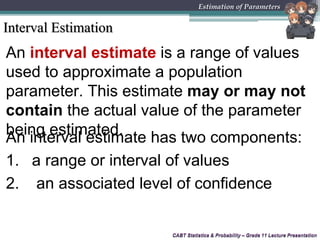

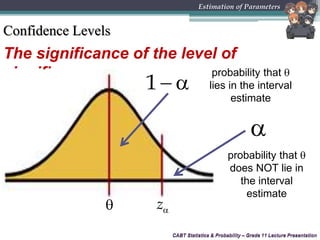
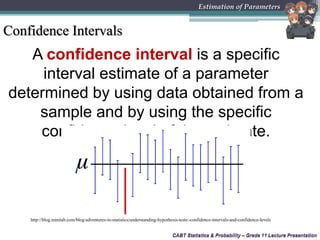
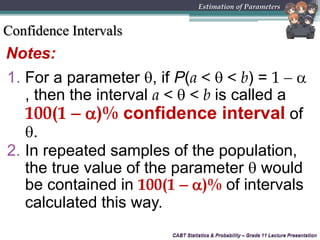
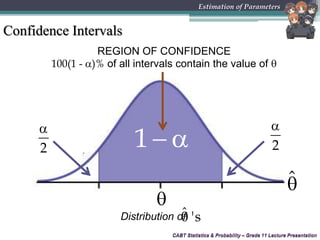
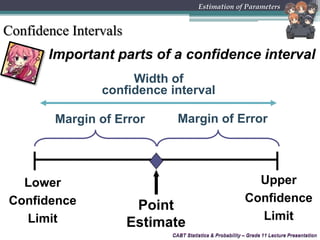
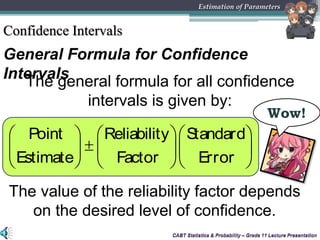
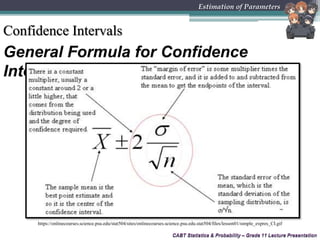
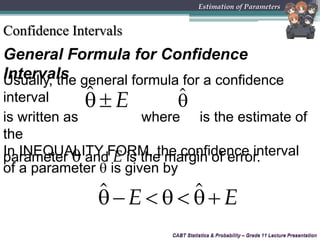
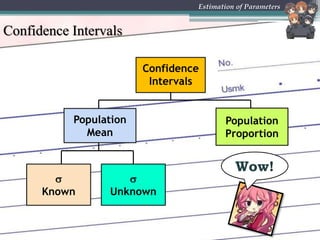

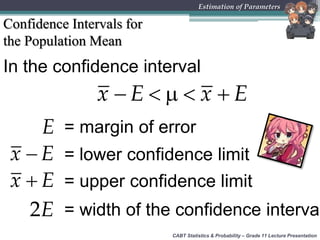
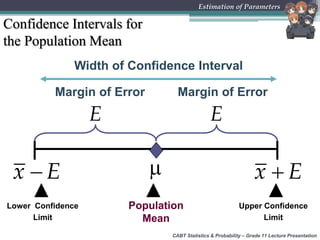
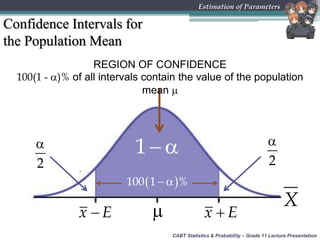
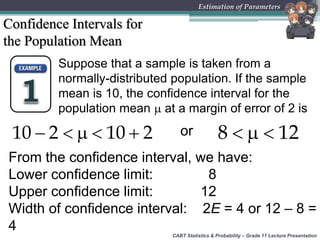
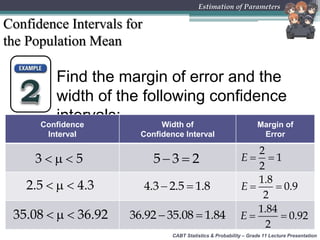
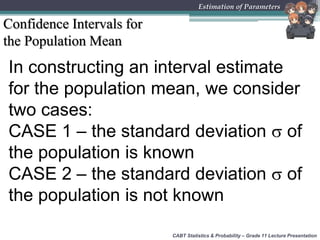
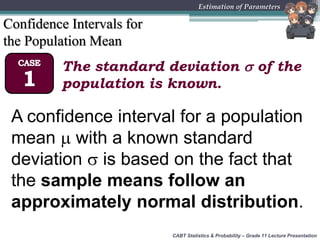
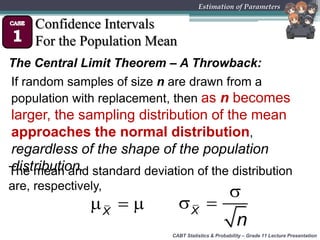
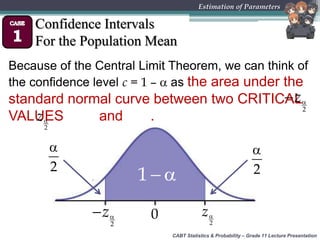
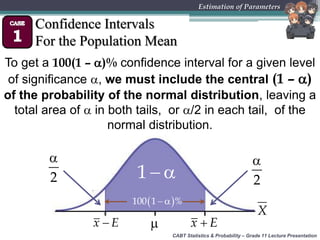
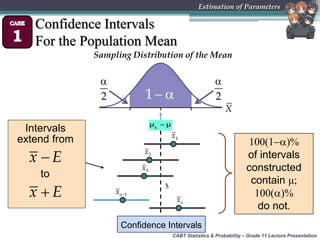
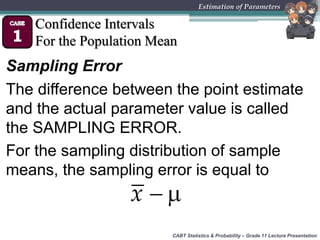
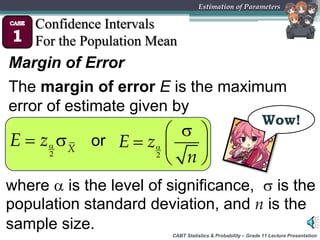
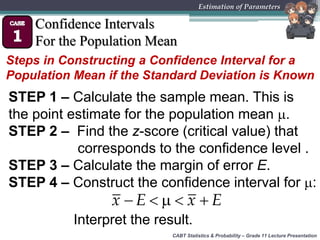
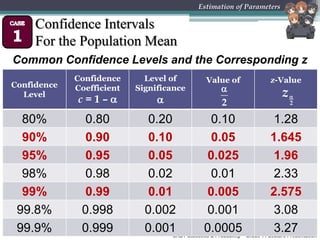
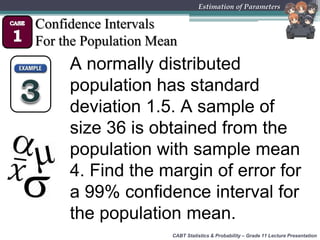
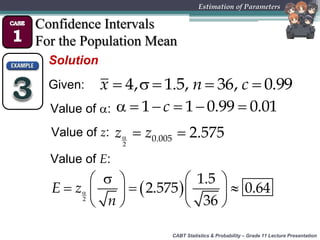

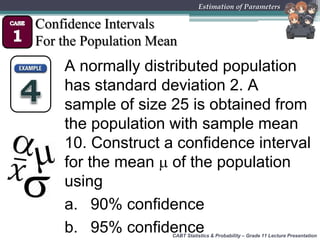
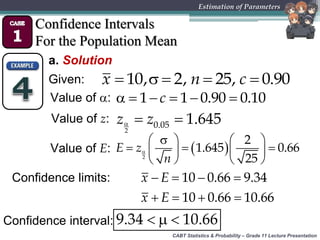

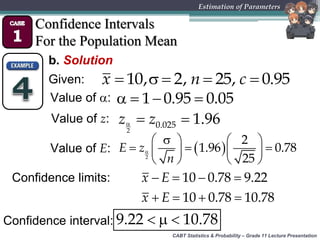
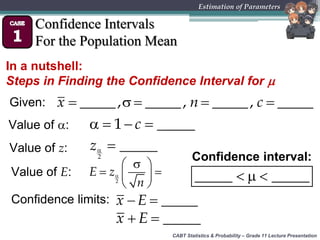

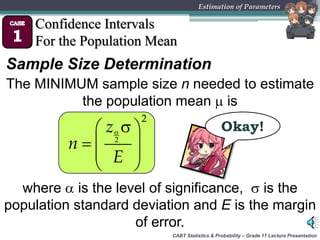


This document provides an overview of inferential statistics and parameter estimation through a lecture presentation. It discusses point estimation and interval estimation to approximate population parameters from sample data. Point estimates are specific numerical values while interval estimates provide a range of values with an associated confidence level. Common point estimators include the sample mean, proportion, and standard deviation. Interval estimates use a confidence level to express the probability that the true population parameter falls within the calculated interval. Formulas are provided for constructing confidence intervals for the population mean with both known and unknown variances.