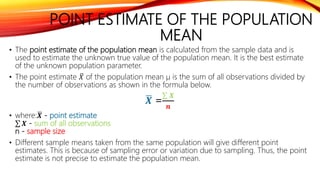
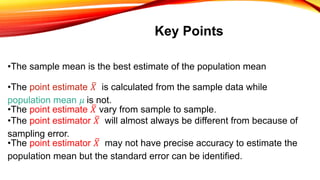
COMPUTE FOR THE POINT
ESTIMATE OF THE POPULATION
MEAN.
M11/12SP-IIIF-4
OBJECTIVES
At the end of this lesson, you should be able to
DETERMINE and COMPUTE the point estimate of the
population mean ACCURATELY
WHAT IS MEAN?
HOW DO WE DETERMINE THE MEAN?
WHAT IS THE OTHER NAME OF THE MEAN?
ACTIVITY: TRUCK BAN
MR DOMINGO CONDUCTED A SURVEY AMONG TEN RANDOM
SAMPLES OF PEOPLE WHO ARE IN FAVOR OF TRUCK BAN IN A
SELECTION OF THE METRO POLITAN AREA. HE DETERMINED THE
PERCENTAGE OF THOSE WHO ARE IN FAVOR OF THE BAN.
ASSUMING THAT THE ONLY ERROR PRESENT IS THE SAMPLING
ERROR. HE WANTS TO DETERMINE THE POINT ESTIMATE OF THE
POPULATION MEAN PERCENTAGE.
70 67 58 60 69 62 70
69 59 77 59 52 79 59
80 42 60 59 68 40 68
56 66 60 40 57 57 70
WHAT IS THE MEAN OF
THE DATA?
POINT ESTIMATE OF THE POPULATION
MEAN
• The point estimate of the population mean is calculated from the sample data and is
used to estimate the unknown true value of the population mean. It is the best estimate
of the unknown population parameter.
• The point estimate 𝑋 of the population mean μ is the sum of all observations divided by
the number of observations as shown in the formula below.
𝑿 =
𝑿
𝒏
• where: 𝑿 - point estimate
𝑿 - sum of all observations
n - sample size
• Different sample means taken from the same population will give different point
estimates. This is because of sampling error or variation due to sampling. Thus, the point
estimate is not precise to estimate the population mean.
EXAMPLE
• Suppose a researcher wants to estimate the mean height of all volleyball
players in a collegiate tournament. He took a random sample of 20
volleyball players and their height (in centimeters). Their height were
recorded as follows:
What is the mean height of the volleyball players in the collegiate
tournament?
EXAMPLE 2
• A music producer wants to estimate the mean age of fans at a K-pop
concert. She took a random sample of 30 fans from the concert and listed
their ages as follows.
What is the mean age of the fans in the concert?
Key Points
•The sample mean is the best estimate of the population mean
•The point estimate 𝑋 is calculated from the sample data while
population mean 𝜇 is not.
•The point estimate 𝑋 vary from sample to sample.
•The point estimator 𝑋 will almost always be different from because of
sampling error.
•The point estimator 𝑋 may not have precise accuracy to estimate the
population mean but the standard error can be identified.
EVALUATION
1. A survey was conducted to estimate the average waiting time for a customer to
be served in a fast food restaurant. The following time (in minutes) was gathered:
5, 10, 9, 20, 13, 11, 17, 26, 3, 8, 11, 14. What is the average waiting time?
2. A researcher wants to estimate the typing speed of the students who are taking
computer class as an elective. He selected 20 samples and tested how long it
took time to finish typing a 500-word text. The following time (in minutes) were
gathered: 12, 8, 14, 20, 25, 11, 7, 5, 6, 10, 15, 13, 12, 16, 9, 8, 6, 15, 21, 16. What is
the best estimate typing speed of the students who are taking computer class?
3. A meteorologist wants to determine the estimated temperature of the Philippines
during summer months. He randomly selected days when he recorded the
temperature. These temperatures (in degrees) were 39, 40, 41, 35, 36, 38, 37, 39,
46, 42, 44, 38, 39, 35 and 40. What is the best estimate of the temperatures of
the Philippines during summer months?
QUESTIONS 4 AND 5
4. A meteorologist wants to determine the estimated temperature
of the Philippines during summer months. He randomly selected
days when he recorded the temperature. These temperatures (in
degrees) were 39, 40, 41, 35, 36, 38, 37, 39, 46, 42, 44, 38, 39, 35
and 40. What is the best estimate of the temperatures of the
Philippines during summer months?
5. The school principal is interested to know the mean number of
students in a class. She took a random sample of 20 classes. The
number of students per class were 35, 31, 34, 40, 45, 25, 32, 39,
37, 41, 42, 29, 30, 32, 26, 40, 43, 42, 41, and 37. What is the point
estimate of the population mean?

Compute for the point estimate

  • 1.
    COMPUTE FOR THEPOINT ESTIMATE OF THE POPULATION MEAN. M11/12SP-IIIF-4 OBJECTIVES At the end of this lesson, you should be able to DETERMINE and COMPUTE the point estimate of the population mean ACCURATELY
  • 2.
    WHAT IS MEAN? HOWDO WE DETERMINE THE MEAN? WHAT IS THE OTHER NAME OF THE MEAN?
  • 3.
    ACTIVITY: TRUCK BAN MRDOMINGO CONDUCTED A SURVEY AMONG TEN RANDOM SAMPLES OF PEOPLE WHO ARE IN FAVOR OF TRUCK BAN IN A SELECTION OF THE METRO POLITAN AREA. HE DETERMINED THE PERCENTAGE OF THOSE WHO ARE IN FAVOR OF THE BAN. ASSUMING THAT THE ONLY ERROR PRESENT IS THE SAMPLING ERROR. HE WANTS TO DETERMINE THE POINT ESTIMATE OF THE POPULATION MEAN PERCENTAGE. 70 67 58 60 69 62 70 69 59 77 59 52 79 59 80 42 60 59 68 40 68 56 66 60 40 57 57 70
  • 4.
    WHAT IS THEMEAN OF THE DATA?
  • 5.
    POINT ESTIMATE OFTHE POPULATION MEAN • The point estimate of the population mean is calculated from the sample data and is used to estimate the unknown true value of the population mean. It is the best estimate of the unknown population parameter. • The point estimate 𝑋 of the population mean μ is the sum of all observations divided by the number of observations as shown in the formula below. 𝑿 = 𝑿 𝒏 • where: 𝑿 - point estimate 𝑿 - sum of all observations n - sample size • Different sample means taken from the same population will give different point estimates. This is because of sampling error or variation due to sampling. Thus, the point estimate is not precise to estimate the population mean.
  • 6.
    EXAMPLE • Suppose aresearcher wants to estimate the mean height of all volleyball players in a collegiate tournament. He took a random sample of 20 volleyball players and their height (in centimeters). Their height were recorded as follows: What is the mean height of the volleyball players in the collegiate tournament?
  • 7.
    EXAMPLE 2 • Amusic producer wants to estimate the mean age of fans at a K-pop concert. She took a random sample of 30 fans from the concert and listed their ages as follows. What is the mean age of the fans in the concert?
  • 8.
    Key Points •The samplemean is the best estimate of the population mean •The point estimate 𝑋 is calculated from the sample data while population mean 𝜇 is not. •The point estimate 𝑋 vary from sample to sample. •The point estimator 𝑋 will almost always be different from because of sampling error. •The point estimator 𝑋 may not have precise accuracy to estimate the population mean but the standard error can be identified.
  • 9.
    EVALUATION 1. A surveywas conducted to estimate the average waiting time for a customer to be served in a fast food restaurant. The following time (in minutes) was gathered: 5, 10, 9, 20, 13, 11, 17, 26, 3, 8, 11, 14. What is the average waiting time? 2. A researcher wants to estimate the typing speed of the students who are taking computer class as an elective. He selected 20 samples and tested how long it took time to finish typing a 500-word text. The following time (in minutes) were gathered: 12, 8, 14, 20, 25, 11, 7, 5, 6, 10, 15, 13, 12, 16, 9, 8, 6, 15, 21, 16. What is the best estimate typing speed of the students who are taking computer class? 3. A meteorologist wants to determine the estimated temperature of the Philippines during summer months. He randomly selected days when he recorded the temperature. These temperatures (in degrees) were 39, 40, 41, 35, 36, 38, 37, 39, 46, 42, 44, 38, 39, 35 and 40. What is the best estimate of the temperatures of the Philippines during summer months?
  • 10.
    QUESTIONS 4 AND5 4. A meteorologist wants to determine the estimated temperature of the Philippines during summer months. He randomly selected days when he recorded the temperature. These temperatures (in degrees) were 39, 40, 41, 35, 36, 38, 37, 39, 46, 42, 44, 38, 39, 35 and 40. What is the best estimate of the temperatures of the Philippines during summer months? 5. The school principal is interested to know the mean number of students in a class. She took a random sample of 20 classes. The number of students per class were 35, 31, 34, 40, 45, 25, 32, 39, 37, 41, 42, 29, 30, 32, 26, 40, 43, 42, 41, and 37. What is the point estimate of the population mean?