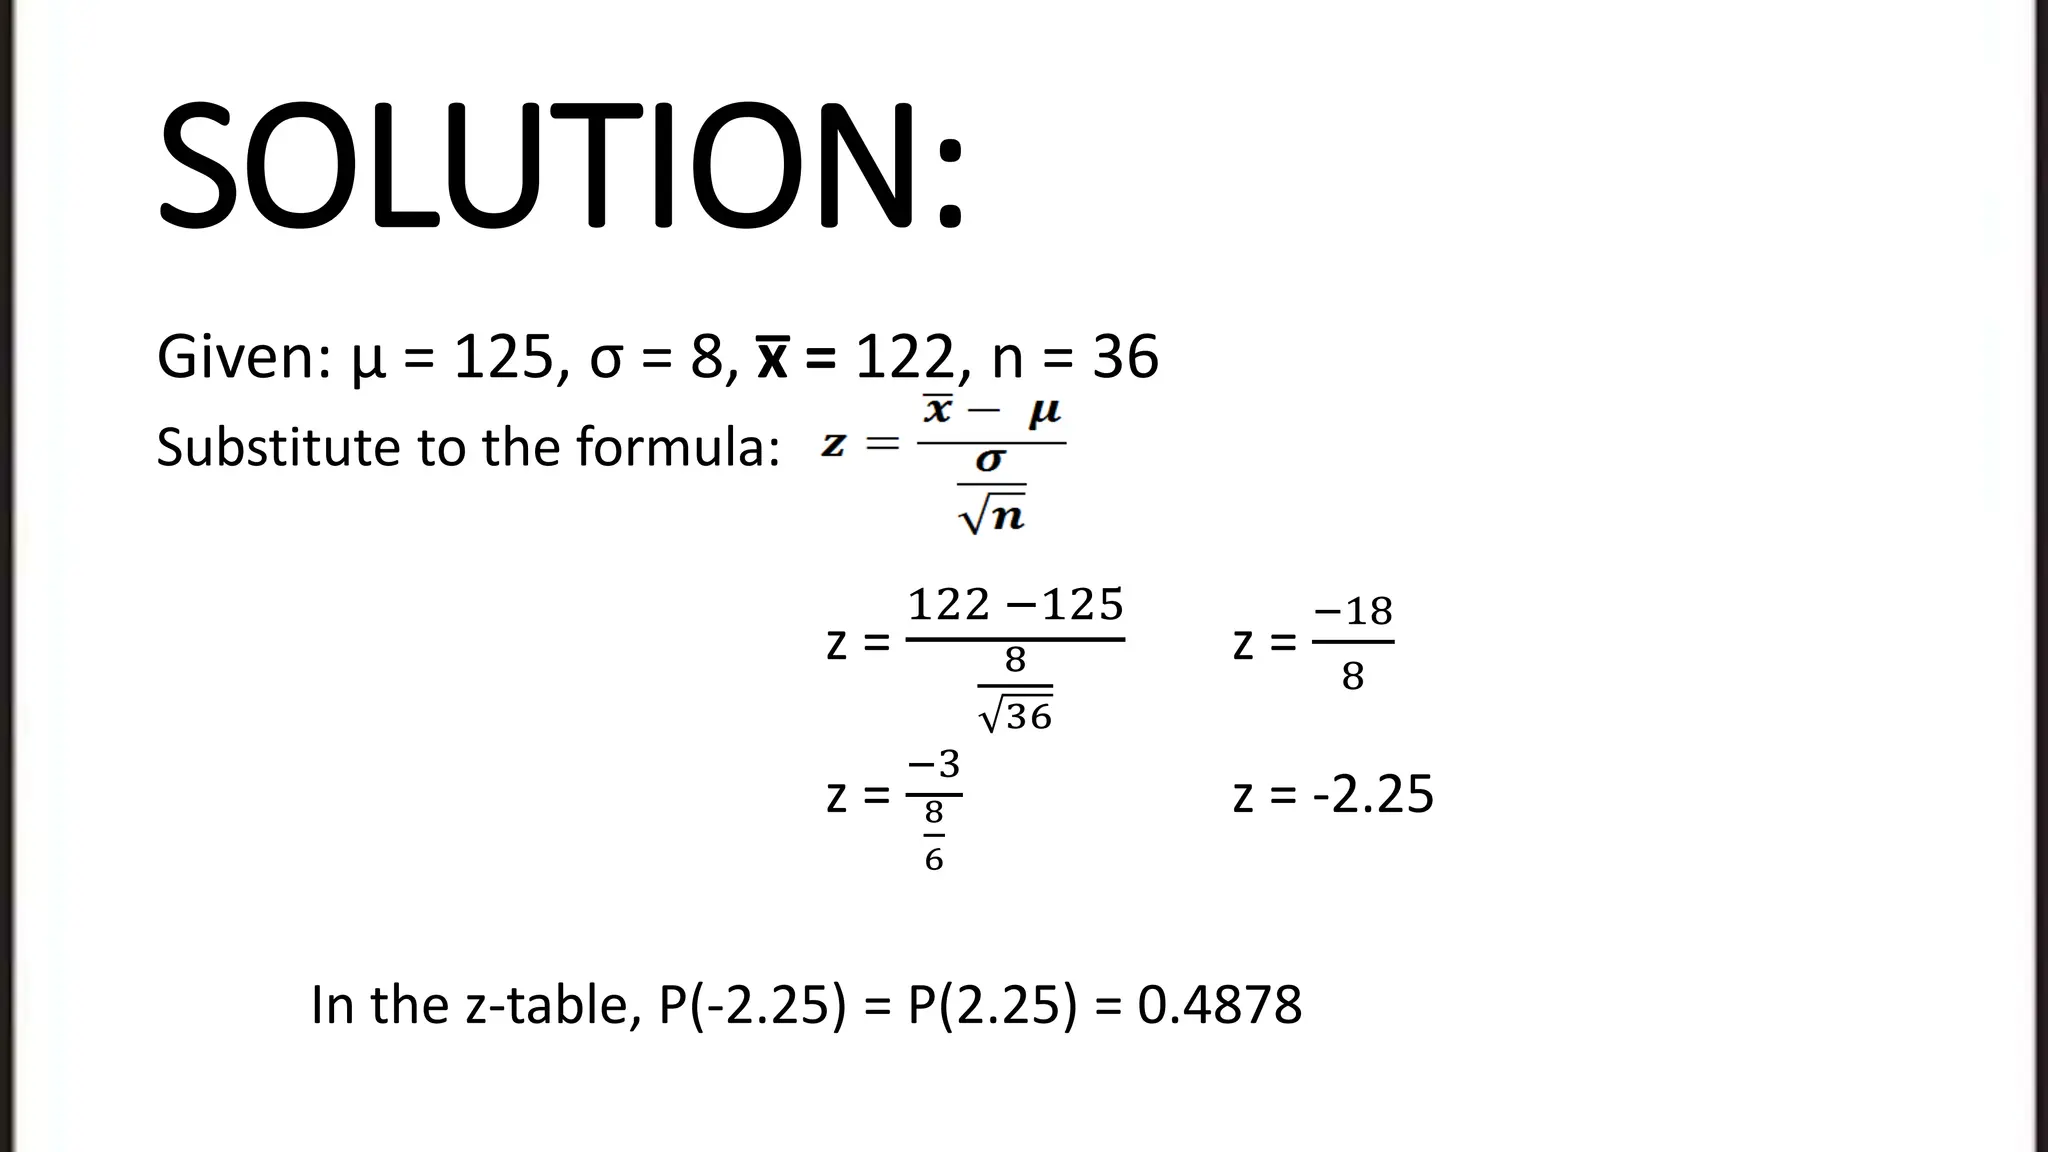
SlideShare a Scribd company logo
1 of 28
THE SAMPLING
DISTRIBUTION OF
THE SAMPLE MEANS
OBJECTIVES:
• Finds the mean and variance of the sampling distribution of the
sample mean. M11/12SP-IIId-5 5.
• Defines the sampling distribution of the sample mean for normal
population when the variance is: (a) known (b) unknown
M11/12SP-IIIe-1 6.
• Illustrates the Central Limit Theorem. M11/12SP-IIIe-2 7.
• Defines the sampling distribution of the sample mean using the
Central Limit Theorem. M11/12SP-III-3 8.
• Solves problems involving sampling distributions of the sample mean.
M11SP-IIIe-f-1
Suppose that all possible samples with size n are drawn from a
population with mean μ and standard deviation σ. Then, the
means obtained from all these possible samples will make up
a sampling distribution of the sample means exhibiting the
following properties:
1. The mean of the sample means is the same as the
population mean μ.
2. The standard error of the sample mean σ is equal to the
population standard deviation δ divided by the square root
of the sample size, thus, σ =
σ
𝑛
.
Mean and Standard Error of the Sampling
Distribution of Sample Means
EXAMPLE 1:
• Random samples with size 4 are drawn from the population
containing the values 14, 19, 26, 31, 48, and 53. Find the mean
and standard error of the sample means.
•Solution:
μ =
14+19+26+31+48+53
6
μ =
191
6
μ = 31.83
•To get the standard error, compute first the population
standard deviation:
•Thus, the standard error of the mean is
EXAMPLE 2:
•A school has 900 junior high school
students. The average height of these
students is 68 in with a standard deviation
of 6 in. Suppose you draw a random sample
of 50 students. Find the mean, standard
deviation, and a variance of the distribution
of all sample means that can be derived
from the samples.
Solution:
a. The mean of the distribution of the sample means is the same as
the population mean. Thus
b. The standard error (or standard deviation) of the sample means is
equal to
c. The variance is the square of the standard deviation.
PRACTICE SET:
• Compute the mean, variance, and standard error of the sampling
distribution of the sample means given the sample size n taken
from the population and with mean μ and standard deviation σ.
1. n= 15 , μ = 18 , σ = 3
2. n= 8, μ = 24 , σ = 8
3. n= 35, μ = 54 , σ = 9
4. n= 20, μ = 3.25 , σ = 0.72
5. n= 30, μ = 8.12 , σ = 2.7
DISTRIBUTION OF
THE SAMPLE MEAN
OF A NORMAL
VARIABLE
•Suppose a random variable X is given and
the population distribution of X is known
to be normal with mean μ and the
variance σ2. Then, it follows that the
sampling distribution of the mean of all
samples of size n selected from X is
normal with mean μ = and the
variance
• Knowing the normality of the sampling distribution of the
sample mean allows you to compute probabilities involving
means of samples using the standard normal distribution.
Any score from a normal distribution can be converted into
its equivalent standard normal score using the formula
• Now, since in a sampling distribution of the sample mean,
the random variable gives the statistic x̅ with mean μ and
standard deviation , the formula is derived as
EXAMPLE 1:
•Suppose that the systolic blood pressures of
a certain population are normally
distributed with mean μ = 125 and σ = 8 and
a sample size 36 is taken from this
population. What is the probability that a
single sample will have a mean blood
pressure of less than 122?
SOLUTION:
Given: μ = 125, σ = 8, x̅ = 122, n = 36
Substitute to the formula:
z =
122 −125
8
36
z =
−18
8
z =
−3
8
6
z = -2.25
In the z-table, P(-2.25) = P(2.25) = 0.4878
Continuation:
Thus,
P(x̅ < 122) = 0.5 – 0.4878
= 0.0122 or 1.22%
Conclusion: This means that the probability that a randomly
chosen sample from the population will have mean systolic
blood pressure less than 122 is 1.22%.
EXAMPLE 2:
• The average time that a person spends in a museum
follows a normal distribution with μ = 88 minutes and
a variance of 16 minutes. These parameters are taken
from a survey conducted to the visitors of the
museum in a particular day. Suppose a sample
consisting of 9 visitors is selected, what is the
probability that the average time these visitors spent
in the museum is between 87 and 92 minutes?
SOLUTION:
Given: μ = 88, σ = 16, x̅ = 87 and 92, n = 9
Substitute to the formula:
P(87 < x̅ < 92) = P(
87 −88
4
3
< Z <
92 −88
4
3
)
= P(-0.75 < Z < 3)
= P(0.75) + P(3)
= 0.2734 + 0.4987
P(87 < x̅ < 92) = 0.7721 or 77.21%
The probability that the mean time of 9 visitors falls between 87 and
92min is 77.21%.
CENTRAL LIMIT
THEOREM
CENTRAL LIMIT THEOREM
• Recall that when samples with any size n are taken from a
normally distributed population, then the distribution of all
sample means also follows a normal distribution. But what if
the population from which samples are taken is not normally
distributed? Can you conclude that the sampling distribution
of the sample mean will be normal? The answer to this
question is “YES” provided that the sample size is large
enough. This can be explained using the CENTRAL LIMIT
THEOREM.
CENTRAL LIMIT THEOREM
•Given a random variable X with mean μ and
variance σ², then, regardless whether the
population distribution of X is normally
distributed or not, as the sample size n gets
larger, the shape of the distribution of the
sample means taken from the population
approaches a normal distribution, with mean μ
and standard deviation
σ
𝑛
.
CENTRAL LIMIT THEOREM
•Note that the emphasis of the central limit
theorem is on the phrase “as the sample size
gets larger”. You can only assume the sampling
distribution to be normal when the sample is
large enough. Mostly, n ≥ 30 is sufficient to
approximate the normality of the sampling
distribution of the sample mean.
EXAMPLE 1:
•The average age of teachers in a certain
town is 34 with a standard deviation of
4. If the principal of ABC College
employs 100 teachers, find the
probability that the average age of these
teachers is less than 35.
SOLUTION:
• It is not given that the population is normally distributed but
since n > 30, then you can assume that the sampling
distribution of the mean ages of 100 teachers is normal
according to the CLT.
z =
35−34
4
100
z =
10
4
z =
1
4
10
z = 2.5
SOLUTION:
• Then,
P(X < 35) = P(Z < 2.5)
P(X < 35) = 0.5 + P(2.5)
P(X < 35) = 0.5 + 0.4938
P(X < 35) = 0.9938 or 99.38%
Therefore, the probability that the average age of
the teachers is less than 35 is 99.38%.
EXAMPLE 2:
•A random sample with size 16 is
selected from a normally distributed
population with a mean of 16 and a
standard deviation of 3.2. What is the
probability that the mean of the sample
falls between 14 and 16?
SOLUTION:
Given: μ = 16, σ = 3.2, x̅ = 14 and 16, n = 16
Substitute to the formula:
P(14 < x̅ < 16) = P(
14 −16
3.2
4
< Z <
16 −16
3.2
4
)
= P(-2.5 < Z < 0 )
= P(2.5) + P(0)
= 0.4938 + 0
P(87 < x̅ < 92) = 0.4938 or 49.38%
The probability that the mean of the sample falls between 14 and 16 is
49.38%.
QUESTION???
PRACTICE SET:
1. A population has a mean age of 34 with a standard
deviation of 10. What is the probability that the mean age
of the sample with size 9 falls between 32 and 35,
considering that the given population follows a normal
distribution?
2. The heights of the students in a certain college are
normally distributed with an average height of 6.2 ft and a
standard deviation of 0.8 ft. If a random sample of 36
students is chosen, what is the probability that their height
fall between 6.6ft and 6.7ft?

More Related Content

What's hot

Confidence interval & probability statements
Confidence interval & probability statements Confidence interval & probability statements
Confidence interval & probability statements DrZahid Khan
 
Standard deviation
Standard deviationStandard deviation
Standard deviationKen Plummer
 
Central Tendency Presentation
Central Tendency PresentationCentral Tendency Presentation
Central Tendency Presentationshafiqrimon
 
Variance and standard deviation
Variance and standard deviationVariance and standard deviation
Variance and standard deviationAmrit Swaroop
 
Measures of Dispersion - Thiyagu
Measures of Dispersion - ThiyaguMeasures of Dispersion - Thiyagu
Measures of Dispersion - ThiyaguThiyagu K
 
3 measures of central dendency
3  measures of central dendency3  measures of central dendency
3 measures of central dendencyDr. Nazar Jaf
 
Random variable,Discrete and Continuous
Random variable,Discrete and ContinuousRandom variable,Discrete and Continuous
Random variable,Discrete and ContinuousBharath kumar Karanam
 
Review & Hypothesis Testing
Review & Hypothesis TestingReview & Hypothesis Testing
Review & Hypothesis TestingSr Edith Bogue
 
Random variable
Random variableRandom variable
Random variableJalilAlih
 
Ppt for 1.1 introduction to statistical inference
Ppt for 1.1 introduction to statistical inferencePpt for 1.1 introduction to statistical inference
Ppt for 1.1 introduction to statistical inferencevasu Chemistry
 
Range, quartiles, and interquartile range
Range, quartiles, and interquartile rangeRange, quartiles, and interquartile range
Range, quartiles, and interquartile rangeswarna sudha
 
MUESTREO
MUESTREOMUESTREO
MUESTREOUNEFA
 
Probability distribution
Probability distributionProbability distribution
Probability distributionPunit Raut
 
Introduction to Probability and Probability Distributions
Introduction to Probability and Probability DistributionsIntroduction to Probability and Probability Distributions
Introduction to Probability and Probability DistributionsJezhabeth Villegas
 
Types of Sampling .pptx
Types of Sampling .pptxTypes of Sampling .pptx
Types of Sampling .pptxtanya88715
 

What's hot (20)

Confidence interval & probability statements
Confidence interval & probability statements Confidence interval & probability statements
Confidence interval & probability statements
 
Point Estimation
Point EstimationPoint Estimation
Point Estimation
 
Standard deviation
Standard deviationStandard deviation
Standard deviation
 
Central Tendency Presentation
Central Tendency PresentationCentral Tendency Presentation
Central Tendency Presentation
 
Variance and standard deviation
Variance and standard deviationVariance and standard deviation
Variance and standard deviation
 
Measures of Dispersion - Thiyagu
Measures of Dispersion - ThiyaguMeasures of Dispersion - Thiyagu
Measures of Dispersion - Thiyagu
 
3 measures of central dendency
3  measures of central dendency3  measures of central dendency
3 measures of central dendency
 
Random variable,Discrete and Continuous
Random variable,Discrete and ContinuousRandom variable,Discrete and Continuous
Random variable,Discrete and Continuous
 
Review & Hypothesis Testing
Review & Hypothesis TestingReview & Hypothesis Testing
Review & Hypothesis Testing
 
Cumulative distribution
Cumulative distributionCumulative distribution
Cumulative distribution
 
Measures of Variation
Measures of VariationMeasures of Variation
Measures of Variation
 
Random variable
Random variableRandom variable
Random variable
 
Ppt for 1.1 introduction to statistical inference
Ppt for 1.1 introduction to statistical inferencePpt for 1.1 introduction to statistical inference
Ppt for 1.1 introduction to statistical inference
 
Range, quartiles, and interquartile range
Range, quartiles, and interquartile rangeRange, quartiles, and interquartile range
Range, quartiles, and interquartile range
 
MUESTREO
MUESTREOMUESTREO
MUESTREO
 
8 random variable
8 random variable8 random variable
8 random variable
 
Probability distribution
Probability distributionProbability distribution
Probability distribution
 
Introduction to Probability and Probability Distributions
Introduction to Probability and Probability DistributionsIntroduction to Probability and Probability Distributions
Introduction to Probability and Probability Distributions
 
Types of Sampling .pptx
Types of Sampling .pptxTypes of Sampling .pptx
Types of Sampling .pptx
 
The Central Limit Theorem
The Central Limit TheoremThe Central Limit Theorem
The Central Limit Theorem
 

Similar to 7-THE-SAMPLING-DISTRIBUTION-OF-SAMPLE-MEANS-CLT.pptx

Sampling distribution.pptx
Sampling distribution.pptxSampling distribution.pptx
Sampling distribution.pptxssusera0e0e9
 
Chapter one on sampling distributions.ppt
Chapter one on sampling distributions.pptChapter one on sampling distributions.ppt
Chapter one on sampling distributions.pptFekaduAman
 
Sample sample distribution
Sample sample distributionSample sample distribution
Sample sample distributionNur Suaidah
 
raghu veera stats.ppt
raghu veera stats.pptraghu veera stats.ppt
raghu veera stats.pptDevarajuBn
 
Sqqs1013 ch6-a122
Sqqs1013 ch6-a122Sqqs1013 ch6-a122
Sqqs1013 ch6-a122kim rae KI
 
Fundamentals of Sampling Distribution and Data Descriptions
Fundamentals of Sampling Distribution and Data DescriptionsFundamentals of Sampling Distribution and Data Descriptions
Fundamentals of Sampling Distribution and Data Descriptionsemonfahim11
 
Chapter 7 2022.pdf
Chapter 7 2022.pdfChapter 7 2022.pdf
Chapter 7 2022.pdfMohamed Ali
 
Statistik Chapter 6
Statistik Chapter 6Statistik Chapter 6
Statistik Chapter 6WanBK Leo
 
Chp11 - Research Methods for Business By Authors Uma Sekaran and Roger Bougie
Chp11  - Research Methods for Business By Authors Uma Sekaran and Roger BougieChp11  - Research Methods for Business By Authors Uma Sekaran and Roger Bougie
Chp11 - Research Methods for Business By Authors Uma Sekaran and Roger BougieHassan Usman
 
Lect w2 measures_of_location_and_spread
Lect w2 measures_of_location_and_spreadLect w2 measures_of_location_and_spread
Lect w2 measures_of_location_and_spreadRione Drevale
 
Sampling Distribution -I
Sampling Distribution -ISampling Distribution -I
Sampling Distribution -ISadam Hussen
 
6.5 central limit
6.5 central limit6.5 central limit
6.5 central limitleblance
 
Chapter 3 sampling and sampling distribution
Chapter 3   sampling and sampling distributionChapter 3   sampling and sampling distribution
Chapter 3 sampling and sampling distributionAntonio F. Balatar Jr.
 

Similar to 7-THE-SAMPLING-DISTRIBUTION-OF-SAMPLE-MEANS-CLT.pptx (20)

Sampling distribution.pptx
Sampling distribution.pptxSampling distribution.pptx
Sampling distribution.pptx
 
Chap 6
Chap 6Chap 6
Chap 6
 
Chapter one on sampling distributions.ppt
Chapter one on sampling distributions.pptChapter one on sampling distributions.ppt
Chapter one on sampling distributions.ppt
 
Sample sample distribution
Sample sample distributionSample sample distribution
Sample sample distribution
 
estimation
estimationestimation
estimation
 
Estimation
EstimationEstimation
Estimation
 
raghu veera stats.ppt
raghu veera stats.pptraghu veera stats.ppt
raghu veera stats.ppt
 
Sqqs1013 ch6-a122
Sqqs1013 ch6-a122Sqqs1013 ch6-a122
Sqqs1013 ch6-a122
 
Fundamentals of Sampling Distribution and Data Descriptions
Fundamentals of Sampling Distribution and Data DescriptionsFundamentals of Sampling Distribution and Data Descriptions
Fundamentals of Sampling Distribution and Data Descriptions
 
Estimating a Population Mean
Estimating a Population MeanEstimating a Population Mean
Estimating a Population Mean
 
U unit8 ksb
U unit8 ksbU unit8 ksb
U unit8 ksb
 
Chapter 7 2022.pdf
Chapter 7 2022.pdfChapter 7 2022.pdf
Chapter 7 2022.pdf
 
Statistik Chapter 6
Statistik Chapter 6Statistik Chapter 6
Statistik Chapter 6
 
Chp11 - Research Methods for Business By Authors Uma Sekaran and Roger Bougie
Chp11  - Research Methods for Business By Authors Uma Sekaran and Roger BougieChp11  - Research Methods for Business By Authors Uma Sekaran and Roger Bougie
Chp11 - Research Methods for Business By Authors Uma Sekaran and Roger Bougie
 
Lect w2 measures_of_location_and_spread
Lect w2 measures_of_location_and_spreadLect w2 measures_of_location_and_spread
Lect w2 measures_of_location_and_spread
 
Chapter08
Chapter08Chapter08
Chapter08
 
Normal as Approximation to Binomial
Normal as Approximation to Binomial  Normal as Approximation to Binomial
Normal as Approximation to Binomial
 
Sampling Distribution -I
Sampling Distribution -ISampling Distribution -I
Sampling Distribution -I
 
6.5 central limit
6.5 central limit6.5 central limit
6.5 central limit
 
Chapter 3 sampling and sampling distribution
Chapter 3   sampling and sampling distributionChapter 3   sampling and sampling distribution
Chapter 3 sampling and sampling distribution
 

Recently uploaded

Lucknow 💋 Virgin Call Girls Lucknow | Book 8923113531 Extreme Naughty Call Gi...
Lucknow 💋 Virgin Call Girls Lucknow | Book 8923113531 Extreme Naughty Call Gi...Lucknow 💋 Virgin Call Girls Lucknow | Book 8923113531 Extreme Naughty Call Gi...
Lucknow 💋 Virgin Call Girls Lucknow | Book 8923113531 Extreme Naughty Call Gi...anilsa9823
 
Mandi House Call Girls : ☎ 8527673949, Low rate Call Girls
Mandi House Call Girls : ☎ 8527673949, Low rate Call GirlsMandi House Call Girls : ☎ 8527673949, Low rate Call Girls
Mandi House Call Girls : ☎ 8527673949, Low rate Call Girlsashishs7044
 
Downtown Call Girls O5O91O128O Pakistani Call Girls in Downtown
Downtown Call Girls O5O91O128O Pakistani Call Girls in DowntownDowntown Call Girls O5O91O128O Pakistani Call Girls in Downtown
Downtown Call Girls O5O91O128O Pakistani Call Girls in Downtowndajasot375
 
FULL ENJOY - 9953040155 Call Girls in Noida | Delhi
FULL ENJOY - 9953040155 Call Girls in Noida | DelhiFULL ENJOY - 9953040155 Call Girls in Noida | Delhi
FULL ENJOY - 9953040155 Call Girls in Noida | DelhiMalviyaNagarCallGirl
 
Alex and Chloe by Daniel Johnson Storyboard
Alex and Chloe by Daniel Johnson StoryboardAlex and Chloe by Daniel Johnson Storyboard
Alex and Chloe by Daniel Johnson Storyboardthephillipta
 
9654467111 Call Girls In Noida Sector 62 Short 1500 Night 6000
9654467111 Call Girls In Noida Sector 62 Short 1500 Night 60009654467111 Call Girls In Noida Sector 62 Short 1500 Night 6000
9654467111 Call Girls In Noida Sector 62 Short 1500 Night 6000Sapana Sha
 
Call Girls in Islamabad | 03274100048 | Call Girl Service
Call Girls in Islamabad | 03274100048 | Call Girl ServiceCall Girls in Islamabad | 03274100048 | Call Girl Service
Call Girls in Islamabad | 03274100048 | Call Girl ServiceAyesha Khan
 
Greater Noida Call Girls : ☎ 8527673949, Low rate Call Girls
Greater Noida Call Girls : ☎ 8527673949, Low rate Call GirlsGreater Noida Call Girls : ☎ 8527673949, Low rate Call Girls
Greater Noida Call Girls : ☎ 8527673949, Low rate Call Girlsashishs7044
 
How Can You Get Dubai Call Girls +971564860409 Call Girls Dubai?
How Can You Get Dubai Call Girls +971564860409 Call Girls Dubai?How Can You Get Dubai Call Girls +971564860409 Call Girls Dubai?
How Can You Get Dubai Call Girls +971564860409 Call Girls Dubai?kexey39068
 
Hazratganj ] (Call Girls) in Lucknow - 450+ Call Girl Cash Payment 🧄 89231135...
Hazratganj ] (Call Girls) in Lucknow - 450+ Call Girl Cash Payment 🧄 89231135...Hazratganj ] (Call Girls) in Lucknow - 450+ Call Girl Cash Payment 🧄 89231135...
Hazratganj ] (Call Girls) in Lucknow - 450+ Call Girl Cash Payment 🧄 89231135...akbard9823
 
Russian⚡ Call Girls In Sector 104 Noida✨8375860717⚡Escorts Service
Russian⚡ Call Girls In Sector 104 Noida✨8375860717⚡Escorts ServiceRussian⚡ Call Girls In Sector 104 Noida✨8375860717⚡Escorts Service
Russian⚡ Call Girls In Sector 104 Noida✨8375860717⚡Escorts Servicedoor45step
 
Faridabad Call Girls : ☎ 8527673949, Low rate Call Girls
Faridabad Call Girls : ☎ 8527673949, Low rate Call GirlsFaridabad Call Girls : ☎ 8527673949, Low rate Call Girls
Faridabad Call Girls : ☎ 8527673949, Low rate Call Girlsashishs7044
 
FULL ENJOY - 9953040155 Call Girls in New Ashok Nagar | Delhi
FULL ENJOY - 9953040155 Call Girls in New Ashok Nagar | DelhiFULL ENJOY - 9953040155 Call Girls in New Ashok Nagar | Delhi
FULL ENJOY - 9953040155 Call Girls in New Ashok Nagar | DelhiMalviyaNagarCallGirl
 
Kishangarh Call Girls : ☎ 8527673949, Low rate Call Girls
Kishangarh Call Girls : ☎ 8527673949, Low rate Call GirlsKishangarh Call Girls : ☎ 8527673949, Low rate Call Girls
Kishangarh Call Girls : ☎ 8527673949, Low rate Call Girlsashishs7044
 
Olivia Cox. intertextual references.pptx
Olivia Cox. intertextual references.pptxOlivia Cox. intertextual references.pptx
Olivia Cox. intertextual references.pptxLauraFagan6
 
Akola Call Girls #9907093804 Contact Number Escorts Service Akola
Akola Call Girls #9907093804 Contact Number Escorts Service AkolaAkola Call Girls #9907093804 Contact Number Escorts Service Akola
Akola Call Girls #9907093804 Contact Number Escorts Service Akolasrsj9000
 
9654467111 Full Enjoy @24/7 Call Girls In Saket Delhi Ncr
9654467111 Full Enjoy @24/7 Call Girls In Saket Delhi Ncr9654467111 Full Enjoy @24/7 Call Girls In Saket Delhi Ncr
9654467111 Full Enjoy @24/7 Call Girls In Saket Delhi NcrSapana Sha
 
FULL ENJOY - 9953040155 Call Girls in Uttam Nagar | Delhi
FULL ENJOY - 9953040155 Call Girls in Uttam Nagar | DelhiFULL ENJOY - 9953040155 Call Girls in Uttam Nagar | Delhi
FULL ENJOY - 9953040155 Call Girls in Uttam Nagar | DelhiMalviyaNagarCallGirl
 
FULL ENJOY - 9953040155 Call Girls in Gandhi Vihar | Delhi
FULL ENJOY - 9953040155 Call Girls in Gandhi Vihar | DelhiFULL ENJOY - 9953040155 Call Girls in Gandhi Vihar | Delhi
FULL ENJOY - 9953040155 Call Girls in Gandhi Vihar | DelhiMalviyaNagarCallGirl
 
Low Rate Call Girls in Laxmi Nagar Delhi Call 9990771857
Low Rate Call Girls in Laxmi Nagar Delhi Call 9990771857Low Rate Call Girls in Laxmi Nagar Delhi Call 9990771857
Low Rate Call Girls in Laxmi Nagar Delhi Call 9990771857delhimodel235
 

Recently uploaded (20)

Lucknow 💋 Virgin Call Girls Lucknow | Book 8923113531 Extreme Naughty Call Gi...
Lucknow 💋 Virgin Call Girls Lucknow | Book 8923113531 Extreme Naughty Call Gi...Lucknow 💋 Virgin Call Girls Lucknow | Book 8923113531 Extreme Naughty Call Gi...
Lucknow 💋 Virgin Call Girls Lucknow | Book 8923113531 Extreme Naughty Call Gi...
 
Mandi House Call Girls : ☎ 8527673949, Low rate Call Girls
Mandi House Call Girls : ☎ 8527673949, Low rate Call GirlsMandi House Call Girls : ☎ 8527673949, Low rate Call Girls
Mandi House Call Girls : ☎ 8527673949, Low rate Call Girls
 
Downtown Call Girls O5O91O128O Pakistani Call Girls in Downtown
Downtown Call Girls O5O91O128O Pakistani Call Girls in DowntownDowntown Call Girls O5O91O128O Pakistani Call Girls in Downtown
Downtown Call Girls O5O91O128O Pakistani Call Girls in Downtown
 
FULL ENJOY - 9953040155 Call Girls in Noida | Delhi
FULL ENJOY - 9953040155 Call Girls in Noida | DelhiFULL ENJOY - 9953040155 Call Girls in Noida | Delhi
FULL ENJOY - 9953040155 Call Girls in Noida | Delhi
 
Alex and Chloe by Daniel Johnson Storyboard
Alex and Chloe by Daniel Johnson StoryboardAlex and Chloe by Daniel Johnson Storyboard
Alex and Chloe by Daniel Johnson Storyboard
 
9654467111 Call Girls In Noida Sector 62 Short 1500 Night 6000
9654467111 Call Girls In Noida Sector 62 Short 1500 Night 60009654467111 Call Girls In Noida Sector 62 Short 1500 Night 6000
9654467111 Call Girls In Noida Sector 62 Short 1500 Night 6000
 
Call Girls in Islamabad | 03274100048 | Call Girl Service
Call Girls in Islamabad | 03274100048 | Call Girl ServiceCall Girls in Islamabad | 03274100048 | Call Girl Service
Call Girls in Islamabad | 03274100048 | Call Girl Service
 
Greater Noida Call Girls : ☎ 8527673949, Low rate Call Girls
Greater Noida Call Girls : ☎ 8527673949, Low rate Call GirlsGreater Noida Call Girls : ☎ 8527673949, Low rate Call Girls
Greater Noida Call Girls : ☎ 8527673949, Low rate Call Girls
 
How Can You Get Dubai Call Girls +971564860409 Call Girls Dubai?
How Can You Get Dubai Call Girls +971564860409 Call Girls Dubai?How Can You Get Dubai Call Girls +971564860409 Call Girls Dubai?
How Can You Get Dubai Call Girls +971564860409 Call Girls Dubai?
 
Hazratganj ] (Call Girls) in Lucknow - 450+ Call Girl Cash Payment 🧄 89231135...
Hazratganj ] (Call Girls) in Lucknow - 450+ Call Girl Cash Payment 🧄 89231135...Hazratganj ] (Call Girls) in Lucknow - 450+ Call Girl Cash Payment 🧄 89231135...
Hazratganj ] (Call Girls) in Lucknow - 450+ Call Girl Cash Payment 🧄 89231135...
 
Russian⚡ Call Girls In Sector 104 Noida✨8375860717⚡Escorts Service
Russian⚡ Call Girls In Sector 104 Noida✨8375860717⚡Escorts ServiceRussian⚡ Call Girls In Sector 104 Noida✨8375860717⚡Escorts Service
Russian⚡ Call Girls In Sector 104 Noida✨8375860717⚡Escorts Service
 
Faridabad Call Girls : ☎ 8527673949, Low rate Call Girls
Faridabad Call Girls : ☎ 8527673949, Low rate Call GirlsFaridabad Call Girls : ☎ 8527673949, Low rate Call Girls
Faridabad Call Girls : ☎ 8527673949, Low rate Call Girls
 
FULL ENJOY - 9953040155 Call Girls in New Ashok Nagar | Delhi
FULL ENJOY - 9953040155 Call Girls in New Ashok Nagar | DelhiFULL ENJOY - 9953040155 Call Girls in New Ashok Nagar | Delhi
FULL ENJOY - 9953040155 Call Girls in New Ashok Nagar | Delhi
 
Kishangarh Call Girls : ☎ 8527673949, Low rate Call Girls
Kishangarh Call Girls : ☎ 8527673949, Low rate Call GirlsKishangarh Call Girls : ☎ 8527673949, Low rate Call Girls
Kishangarh Call Girls : ☎ 8527673949, Low rate Call Girls
 
Olivia Cox. intertextual references.pptx
Olivia Cox. intertextual references.pptxOlivia Cox. intertextual references.pptx
Olivia Cox. intertextual references.pptx
 
Akola Call Girls #9907093804 Contact Number Escorts Service Akola
Akola Call Girls #9907093804 Contact Number Escorts Service AkolaAkola Call Girls #9907093804 Contact Number Escorts Service Akola
Akola Call Girls #9907093804 Contact Number Escorts Service Akola
 
9654467111 Full Enjoy @24/7 Call Girls In Saket Delhi Ncr
9654467111 Full Enjoy @24/7 Call Girls In Saket Delhi Ncr9654467111 Full Enjoy @24/7 Call Girls In Saket Delhi Ncr
9654467111 Full Enjoy @24/7 Call Girls In Saket Delhi Ncr
 
FULL ENJOY - 9953040155 Call Girls in Uttam Nagar | Delhi
FULL ENJOY - 9953040155 Call Girls in Uttam Nagar | DelhiFULL ENJOY - 9953040155 Call Girls in Uttam Nagar | Delhi
FULL ENJOY - 9953040155 Call Girls in Uttam Nagar | Delhi
 
FULL ENJOY - 9953040155 Call Girls in Gandhi Vihar | Delhi
FULL ENJOY - 9953040155 Call Girls in Gandhi Vihar | DelhiFULL ENJOY - 9953040155 Call Girls in Gandhi Vihar | Delhi
FULL ENJOY - 9953040155 Call Girls in Gandhi Vihar | Delhi
 
Low Rate Call Girls in Laxmi Nagar Delhi Call 9990771857
Low Rate Call Girls in Laxmi Nagar Delhi Call 9990771857Low Rate Call Girls in Laxmi Nagar Delhi Call 9990771857
Low Rate Call Girls in Laxmi Nagar Delhi Call 9990771857
 

7-THE-SAMPLING-DISTRIBUTION-OF-SAMPLE-MEANS-CLT.pptx

  • 2. OBJECTIVES: • Finds the mean and variance of the sampling distribution of the sample mean. M11/12SP-IIId-5 5. • Defines the sampling distribution of the sample mean for normal population when the variance is: (a) known (b) unknown M11/12SP-IIIe-1 6. • Illustrates the Central Limit Theorem. M11/12SP-IIIe-2 7. • Defines the sampling distribution of the sample mean using the Central Limit Theorem. M11/12SP-III-3 8. • Solves problems involving sampling distributions of the sample mean. M11SP-IIIe-f-1
  • 3. Suppose that all possible samples with size n are drawn from a population with mean μ and standard deviation σ. Then, the means obtained from all these possible samples will make up a sampling distribution of the sample means exhibiting the following properties: 1. The mean of the sample means is the same as the population mean μ. 2. The standard error of the sample mean σ is equal to the population standard deviation δ divided by the square root of the sample size, thus, σ = σ 𝑛 .
  • 4. Mean and Standard Error of the Sampling Distribution of Sample Means
  • 5. EXAMPLE 1: • Random samples with size 4 are drawn from the population containing the values 14, 19, 26, 31, 48, and 53. Find the mean and standard error of the sample means. •Solution: μ = 14+19+26+31+48+53 6 μ = 191 6 μ = 31.83
  • 6. •To get the standard error, compute first the population standard deviation: •Thus, the standard error of the mean is
  • 7. EXAMPLE 2: •A school has 900 junior high school students. The average height of these students is 68 in with a standard deviation of 6 in. Suppose you draw a random sample of 50 students. Find the mean, standard deviation, and a variance of the distribution of all sample means that can be derived from the samples.
  • 8. Solution: a. The mean of the distribution of the sample means is the same as the population mean. Thus b. The standard error (or standard deviation) of the sample means is equal to c. The variance is the square of the standard deviation.
  • 9. PRACTICE SET: • Compute the mean, variance, and standard error of the sampling distribution of the sample means given the sample size n taken from the population and with mean μ and standard deviation σ. 1. n= 15 , μ = 18 , σ = 3 2. n= 8, μ = 24 , σ = 8 3. n= 35, μ = 54 , σ = 9 4. n= 20, μ = 3.25 , σ = 0.72 5. n= 30, μ = 8.12 , σ = 2.7
  • 10. DISTRIBUTION OF THE SAMPLE MEAN OF A NORMAL VARIABLE
  • 11. •Suppose a random variable X is given and the population distribution of X is known to be normal with mean μ and the variance σ2. Then, it follows that the sampling distribution of the mean of all samples of size n selected from X is normal with mean μ = and the variance
  • 12. • Knowing the normality of the sampling distribution of the sample mean allows you to compute probabilities involving means of samples using the standard normal distribution. Any score from a normal distribution can be converted into its equivalent standard normal score using the formula • Now, since in a sampling distribution of the sample mean, the random variable gives the statistic x̅ with mean μ and standard deviation , the formula is derived as
  • 13. EXAMPLE 1: •Suppose that the systolic blood pressures of a certain population are normally distributed with mean μ = 125 and σ = 8 and a sample size 36 is taken from this population. What is the probability that a single sample will have a mean blood pressure of less than 122?
  • 14. SOLUTION: Given: μ = 125, σ = 8, x̅ = 122, n = 36 Substitute to the formula: z = 122 −125 8 36 z = −18 8 z = −3 8 6 z = -2.25 In the z-table, P(-2.25) = P(2.25) = 0.4878
  • 15. Continuation: Thus, P(x̅ < 122) = 0.5 – 0.4878 = 0.0122 or 1.22% Conclusion: This means that the probability that a randomly chosen sample from the population will have mean systolic blood pressure less than 122 is 1.22%.
  • 16. EXAMPLE 2: • The average time that a person spends in a museum follows a normal distribution with μ = 88 minutes and a variance of 16 minutes. These parameters are taken from a survey conducted to the visitors of the museum in a particular day. Suppose a sample consisting of 9 visitors is selected, what is the probability that the average time these visitors spent in the museum is between 87 and 92 minutes?
  • 17. SOLUTION: Given: μ = 88, σ = 16, x̅ = 87 and 92, n = 9 Substitute to the formula: P(87 < x̅ < 92) = P( 87 −88 4 3 < Z < 92 −88 4 3 ) = P(-0.75 < Z < 3) = P(0.75) + P(3) = 0.2734 + 0.4987 P(87 < x̅ < 92) = 0.7721 or 77.21% The probability that the mean time of 9 visitors falls between 87 and 92min is 77.21%.
  • 19. CENTRAL LIMIT THEOREM • Recall that when samples with any size n are taken from a normally distributed population, then the distribution of all sample means also follows a normal distribution. But what if the population from which samples are taken is not normally distributed? Can you conclude that the sampling distribution of the sample mean will be normal? The answer to this question is “YES” provided that the sample size is large enough. This can be explained using the CENTRAL LIMIT THEOREM.
  • 20. CENTRAL LIMIT THEOREM •Given a random variable X with mean μ and variance σ², then, regardless whether the population distribution of X is normally distributed or not, as the sample size n gets larger, the shape of the distribution of the sample means taken from the population approaches a normal distribution, with mean μ and standard deviation σ 𝑛 .
  • 21. CENTRAL LIMIT THEOREM •Note that the emphasis of the central limit theorem is on the phrase “as the sample size gets larger”. You can only assume the sampling distribution to be normal when the sample is large enough. Mostly, n ≥ 30 is sufficient to approximate the normality of the sampling distribution of the sample mean.
  • 22. EXAMPLE 1: •The average age of teachers in a certain town is 34 with a standard deviation of 4. If the principal of ABC College employs 100 teachers, find the probability that the average age of these teachers is less than 35.
  • 23. SOLUTION: • It is not given that the population is normally distributed but since n > 30, then you can assume that the sampling distribution of the mean ages of 100 teachers is normal according to the CLT. z = 35−34 4 100 z = 10 4 z = 1 4 10 z = 2.5
  • 24. SOLUTION: • Then, P(X < 35) = P(Z < 2.5) P(X < 35) = 0.5 + P(2.5) P(X < 35) = 0.5 + 0.4938 P(X < 35) = 0.9938 or 99.38% Therefore, the probability that the average age of the teachers is less than 35 is 99.38%.
  • 25. EXAMPLE 2: •A random sample with size 16 is selected from a normally distributed population with a mean of 16 and a standard deviation of 3.2. What is the probability that the mean of the sample falls between 14 and 16?
  • 26. SOLUTION: Given: μ = 16, σ = 3.2, x̅ = 14 and 16, n = 16 Substitute to the formula: P(14 < x̅ < 16) = P( 14 −16 3.2 4 < Z < 16 −16 3.2 4 ) = P(-2.5 < Z < 0 ) = P(2.5) + P(0) = 0.4938 + 0 P(87 < x̅ < 92) = 0.4938 or 49.38% The probability that the mean of the sample falls between 14 and 16 is 49.38%.
  • 28. PRACTICE SET: 1. A population has a mean age of 34 with a standard deviation of 10. What is the probability that the mean age of the sample with size 9 falls between 32 and 35, considering that the given population follows a normal distribution? 2. The heights of the students in a certain college are normally distributed with an average height of 6.2 ft and a standard deviation of 0.8 ft. If a random sample of 36 students is chosen, what is the probability that their height fall between 6.6ft and 6.7ft?