Measures of CentralTendency
Measures of central tendency are statistical tools that identify a single
value representing the “center” or “typical” value of a dataset.
The three most commonly used measures are:
Mean – the arithmetic average of all data points.
Median – the middle value when data is ordered.
Mode – the most frequent value(s) in the dataset.
3.
Measures of CentralTendency
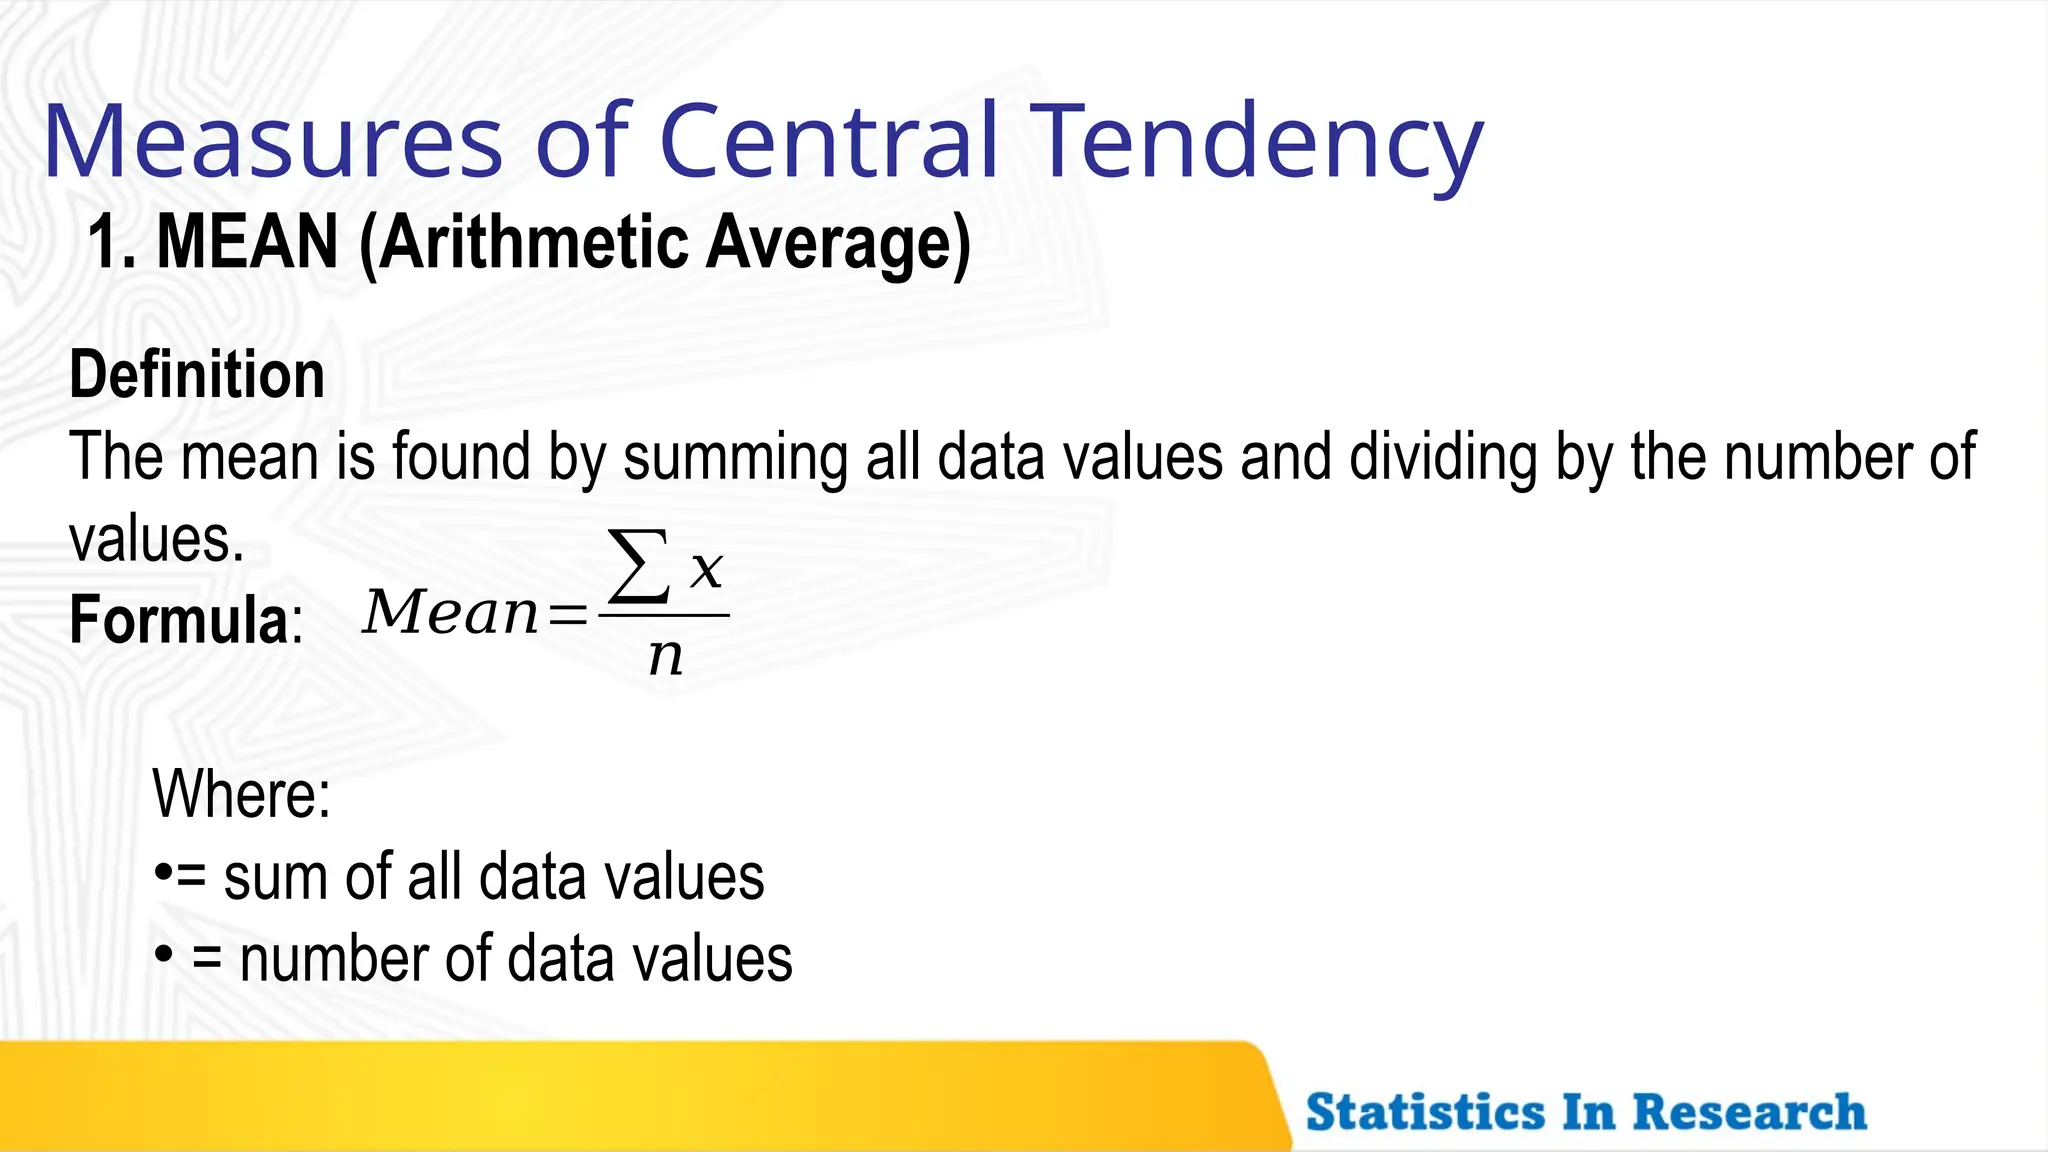
1. MEAN (Arithmetic Average)
Definition
The mean is found by summing all data values and dividing by the number of
values.
Formula: 𝑀𝑒𝑎𝑛=
∑ 𝑥
𝑛
Where:
•= sum of all data values
• = number of data values
4.
Measures of CentralTendency
Advantages
Uses all data points (considered comprehensive)
Easy to compute
Useful for further statistical analysis (variance, standard deviation,
etc.)
Disadvantages
Sensitive to extreme values (outliers)
Not ideal for skewed distributions
5.
Measures of CentralTendency
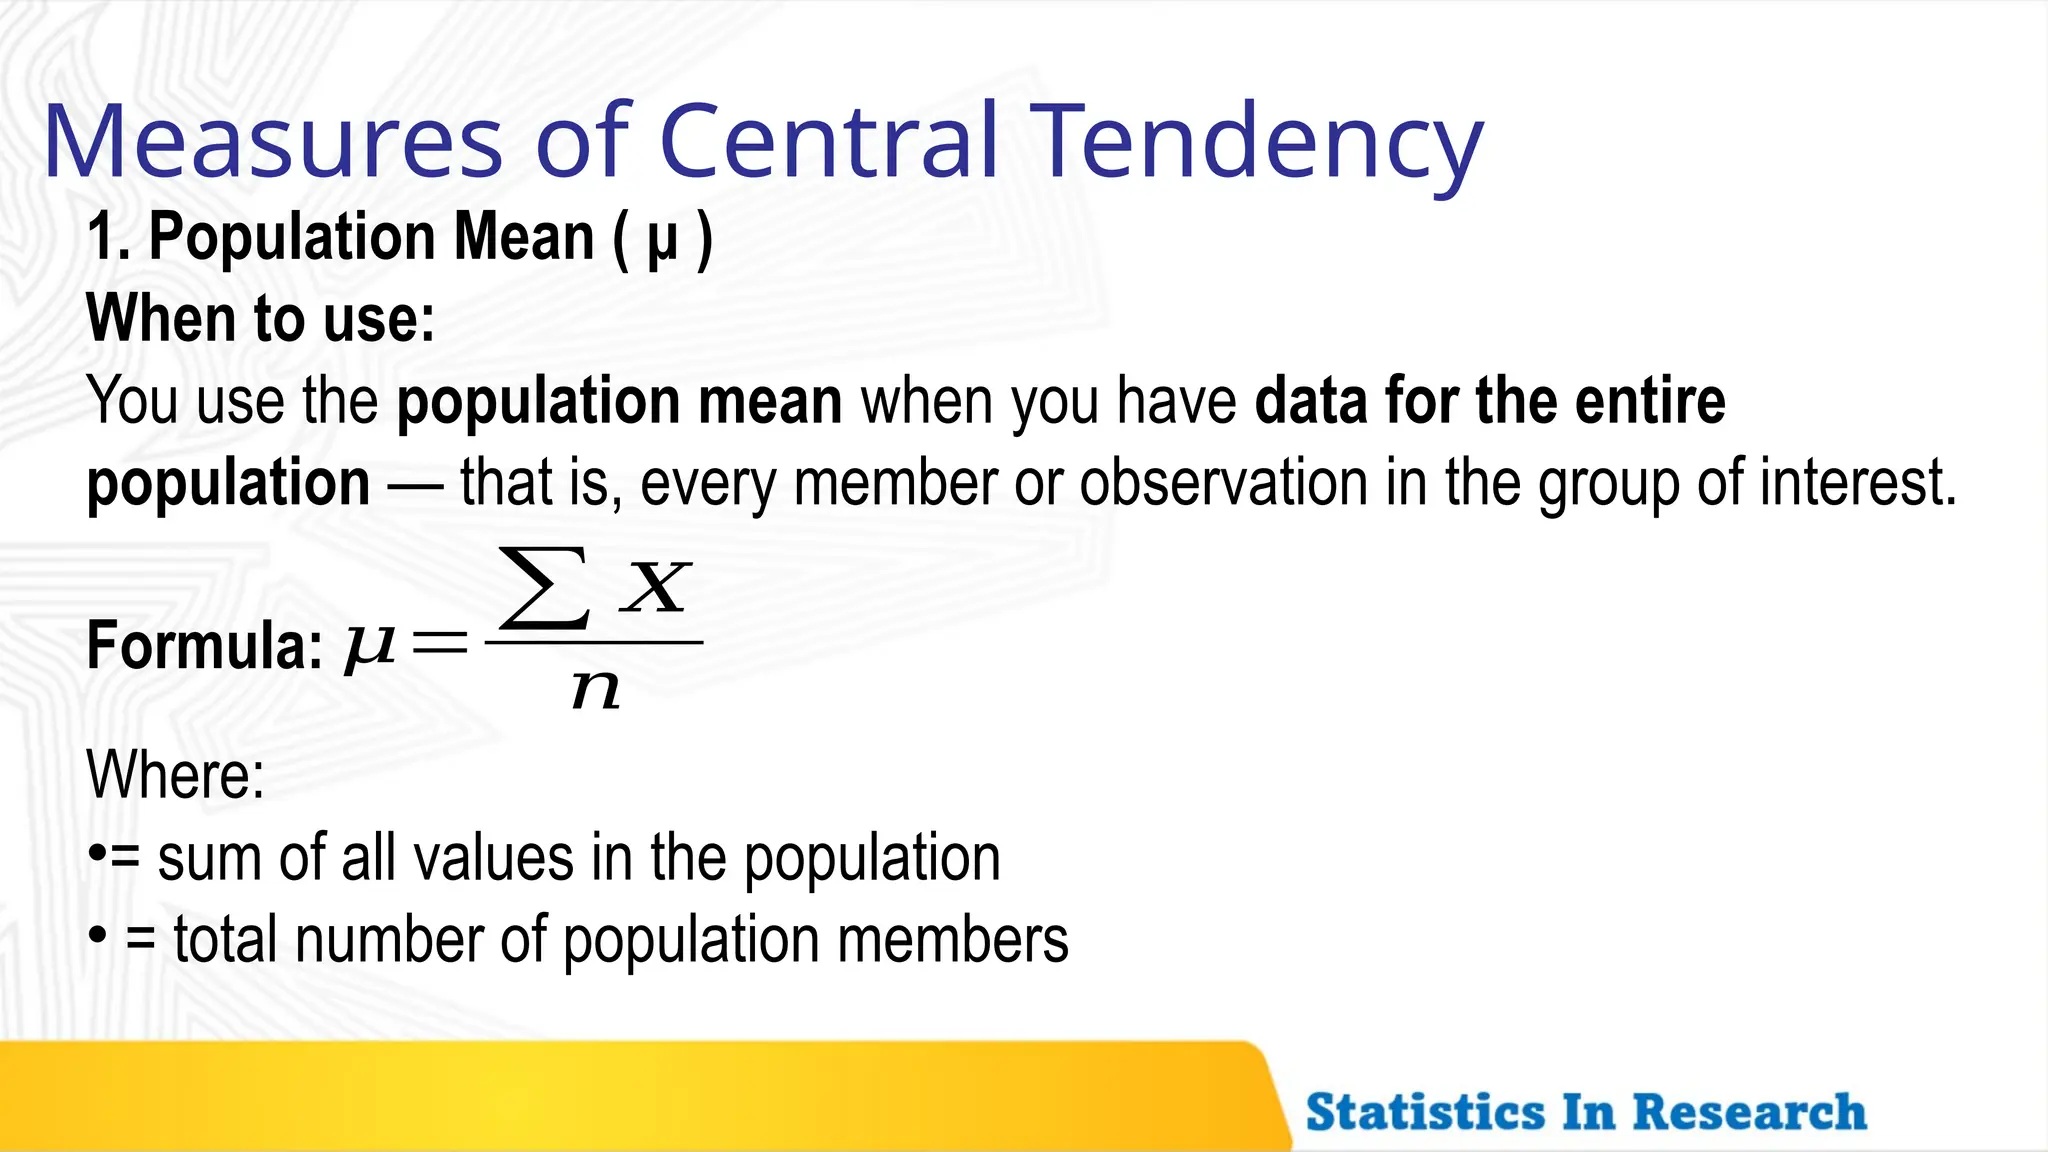
1. Population Mean ( μ )
When to use:
You use the population mean when you have data for the entire
population — that is, every member or observation in the group of interest.
Formula: 𝜇=
∑ 𝑋
𝑛
Where:
•= sum of all values in the population
• = total number of population members
6.
1. Population Mean( μ )
Example:
If you record the height of all students in your school, you can calculate the
population mean because you have complete data.
Measures of Central Tendency
7.
Examples
Measures of CentralTendency
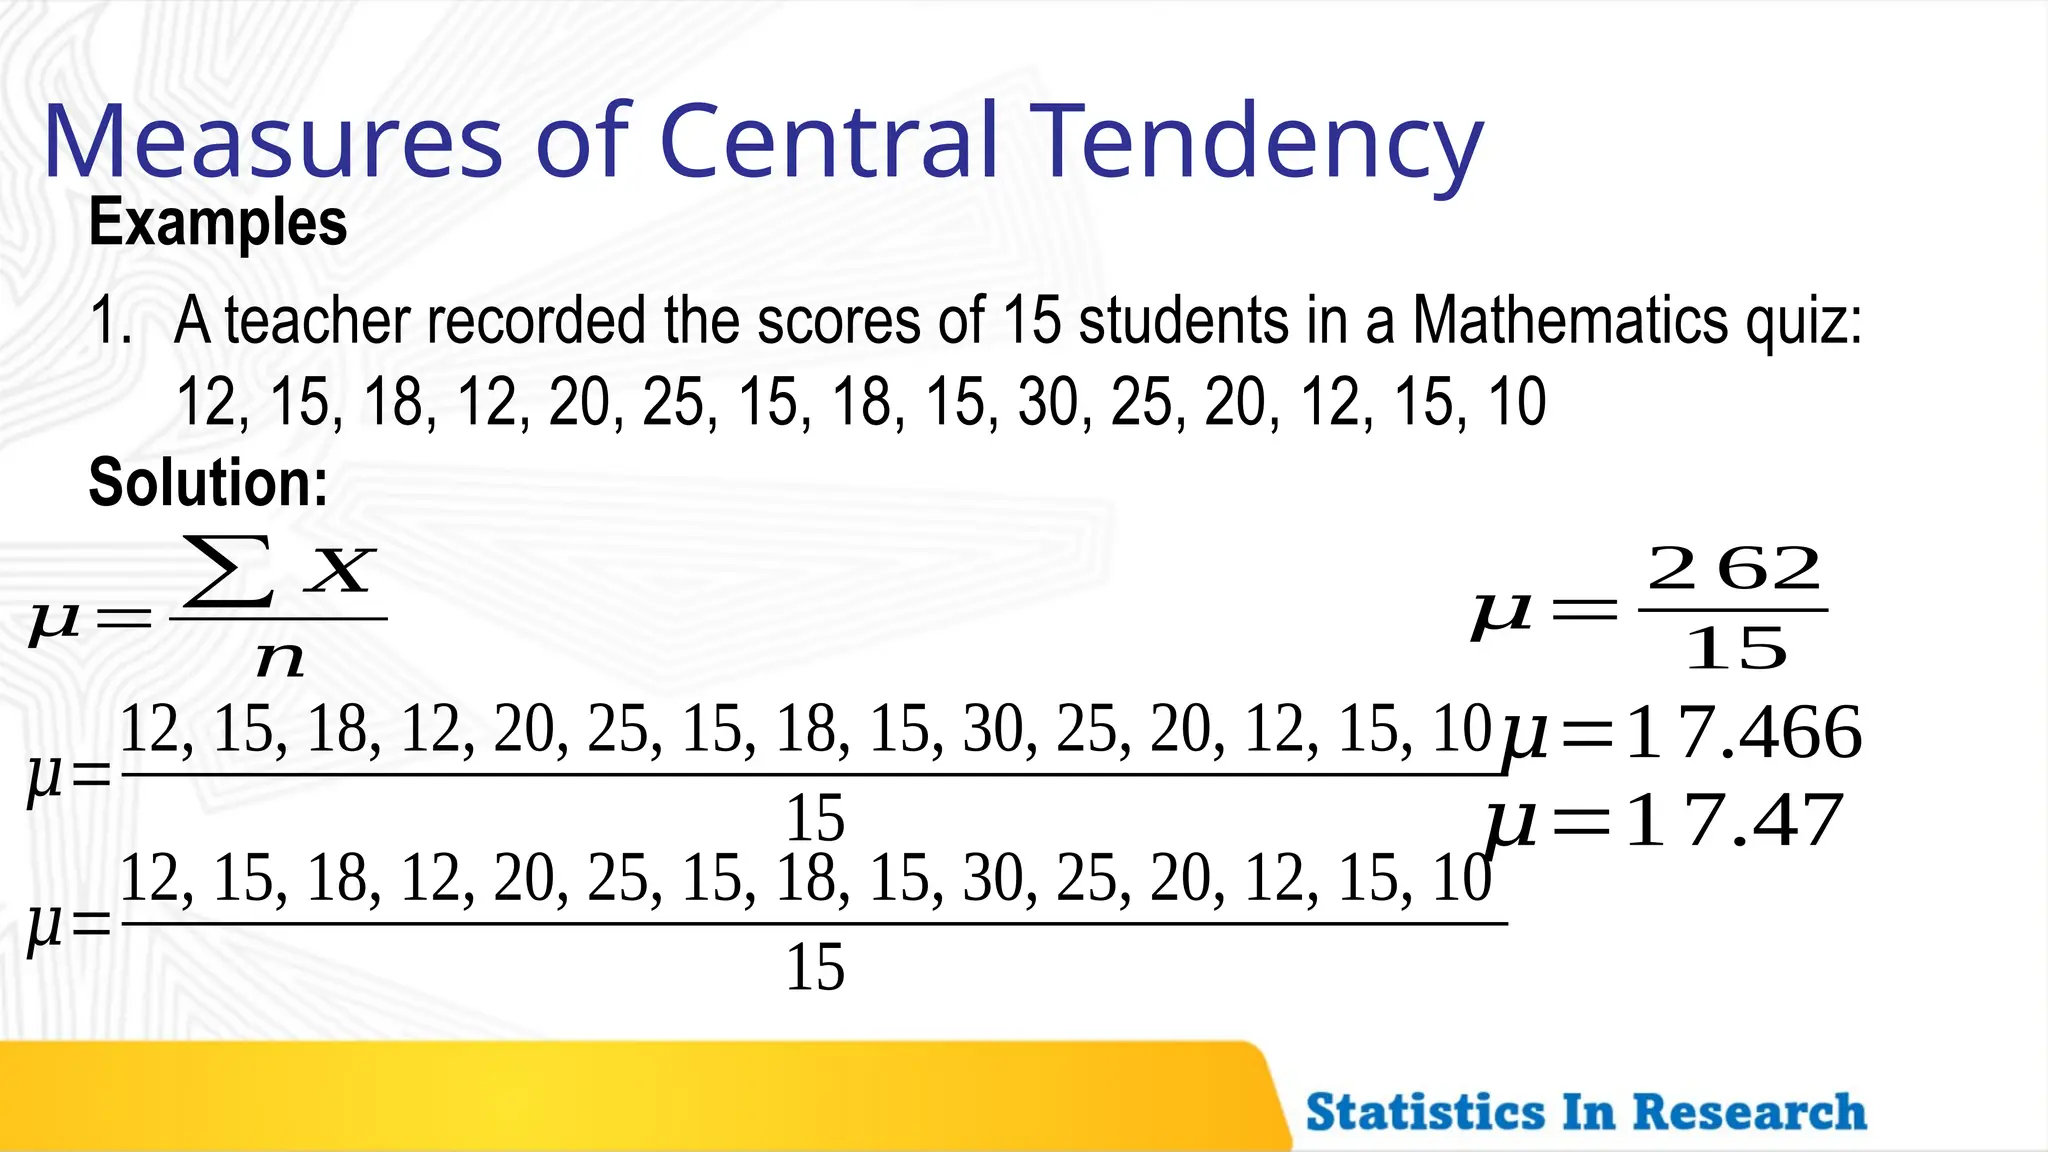
1. A teacher recorded the scores of 15 students in a Mathematics quiz:
12, 15, 18, 12, 20, 25, 15, 18, 15, 30, 25, 20, 12, 15, 10
𝜇=
∑ 𝑋
𝑛
Solution:
𝜇=
12, 15, 18, 12, 20, 25, 15, 18, 15, 30, 25, 20, 12, 15, 10
15
𝜇=
12, 15, 18, 12, 20, 25, 15, 18, 15, 30, 25, 20, 12, 15, 10
15
𝜇=
2 62
15
𝜇=17.466
𝜇=1 7.47
8.
Examples
Measures of CentralTendency
2. The number of hours all 4 employees worked in a day: 8, 7, 9, 8.
Find the population mean hours worked.
9.
Examples
Measures of CentralTendency
3. Find the mean of the daily sales (in pesos) of a store for all 5 days of
the week are: 200, 220, 210, 250, 230.
10.
Measures of CentralTendency
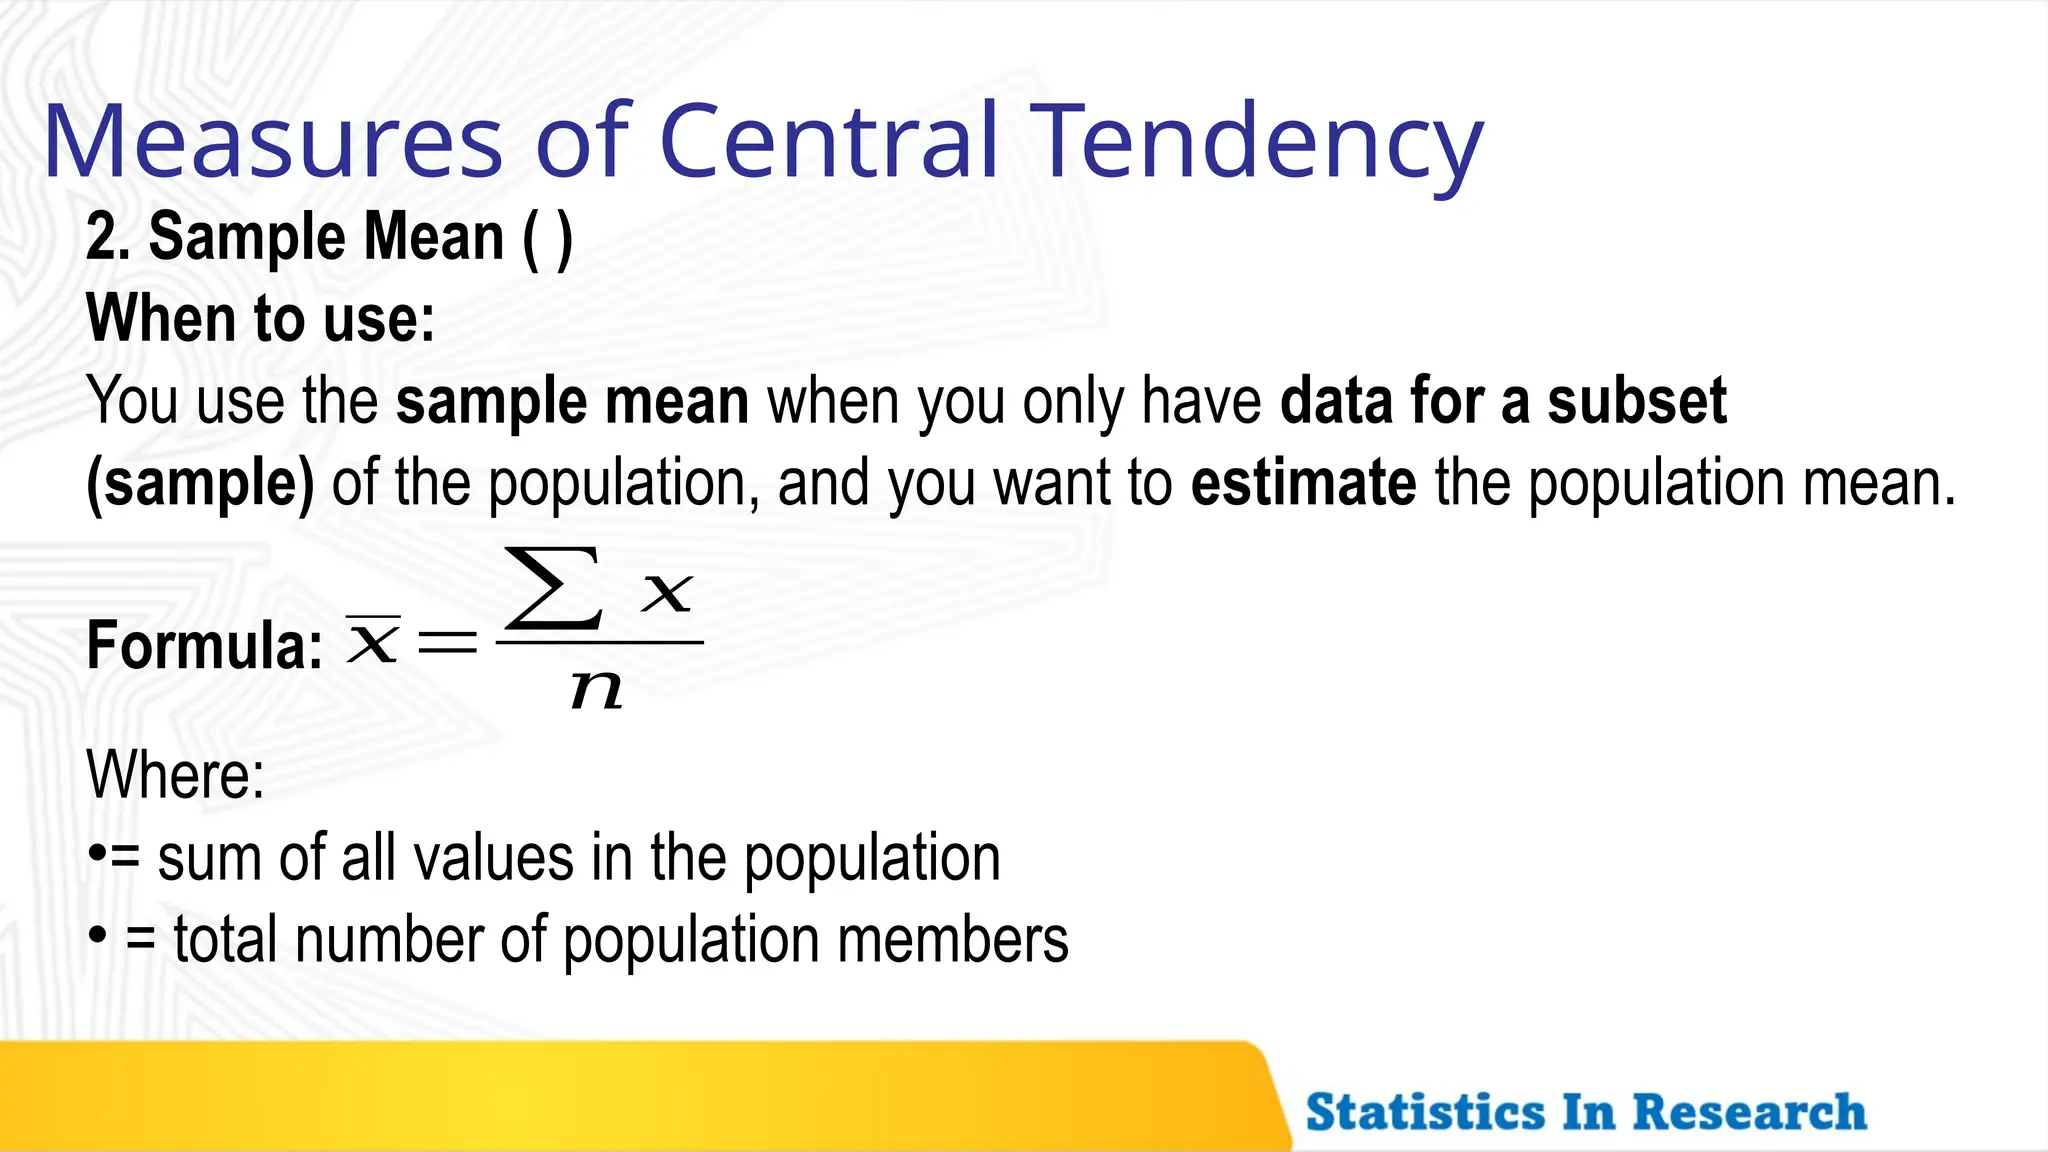
2. Sample Mean ( )
When to use:
You use the sample mean when you only have data for a subset
(sample) of the population, and you want to estimate the population mean.
Formula: 𝑥=
∑ 𝑥
𝑛
Where:
•= sum of all values in the population
• = total number of population members
11.
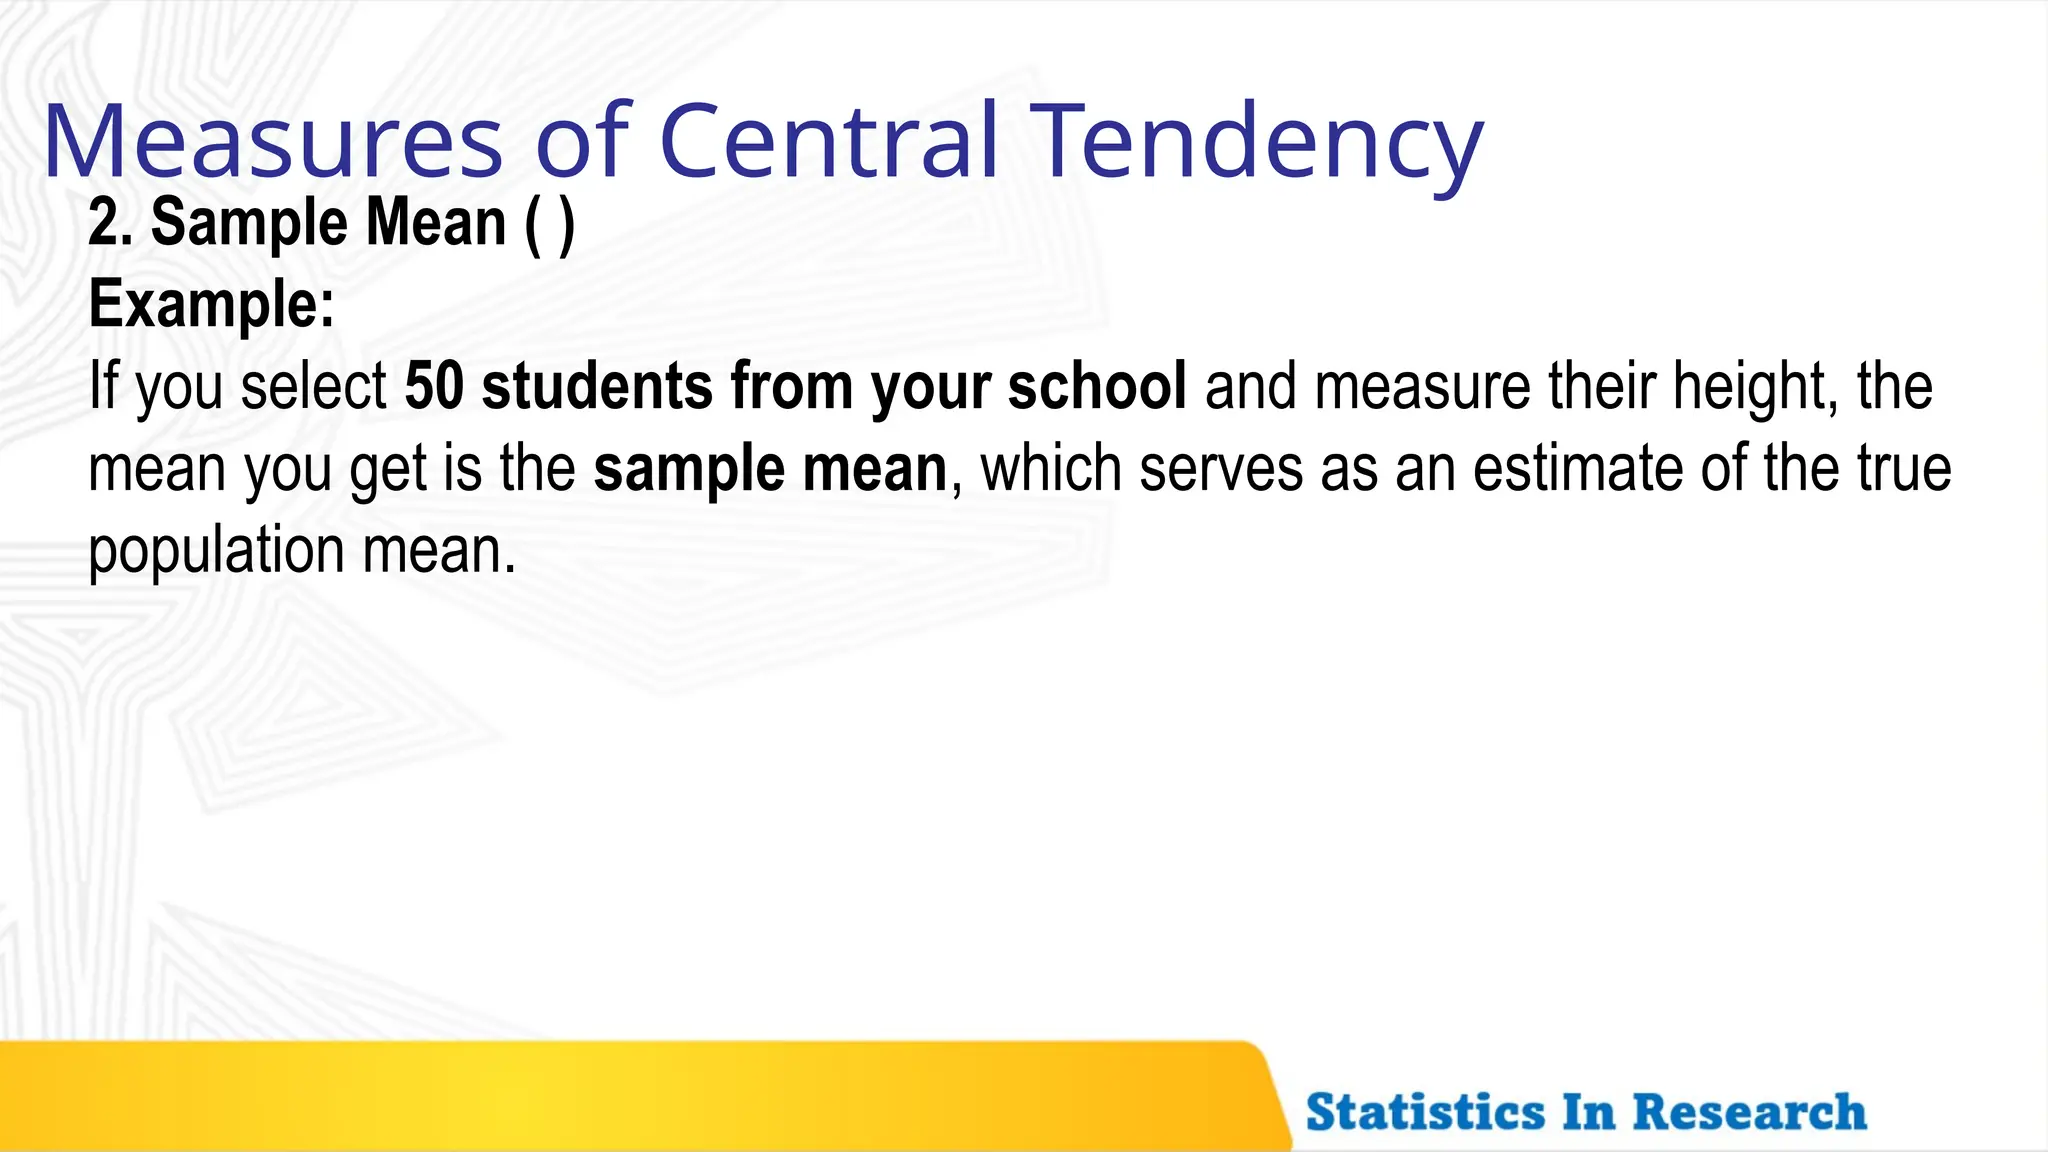
2. Sample Mean( )
Example:
If you select 50 students from your school and measure their height, the
mean you get is the sample mean, which serves as an estimate of the true
population mean.
Measures of Central Tendency
12.
Examples
Measures of CentralTendency
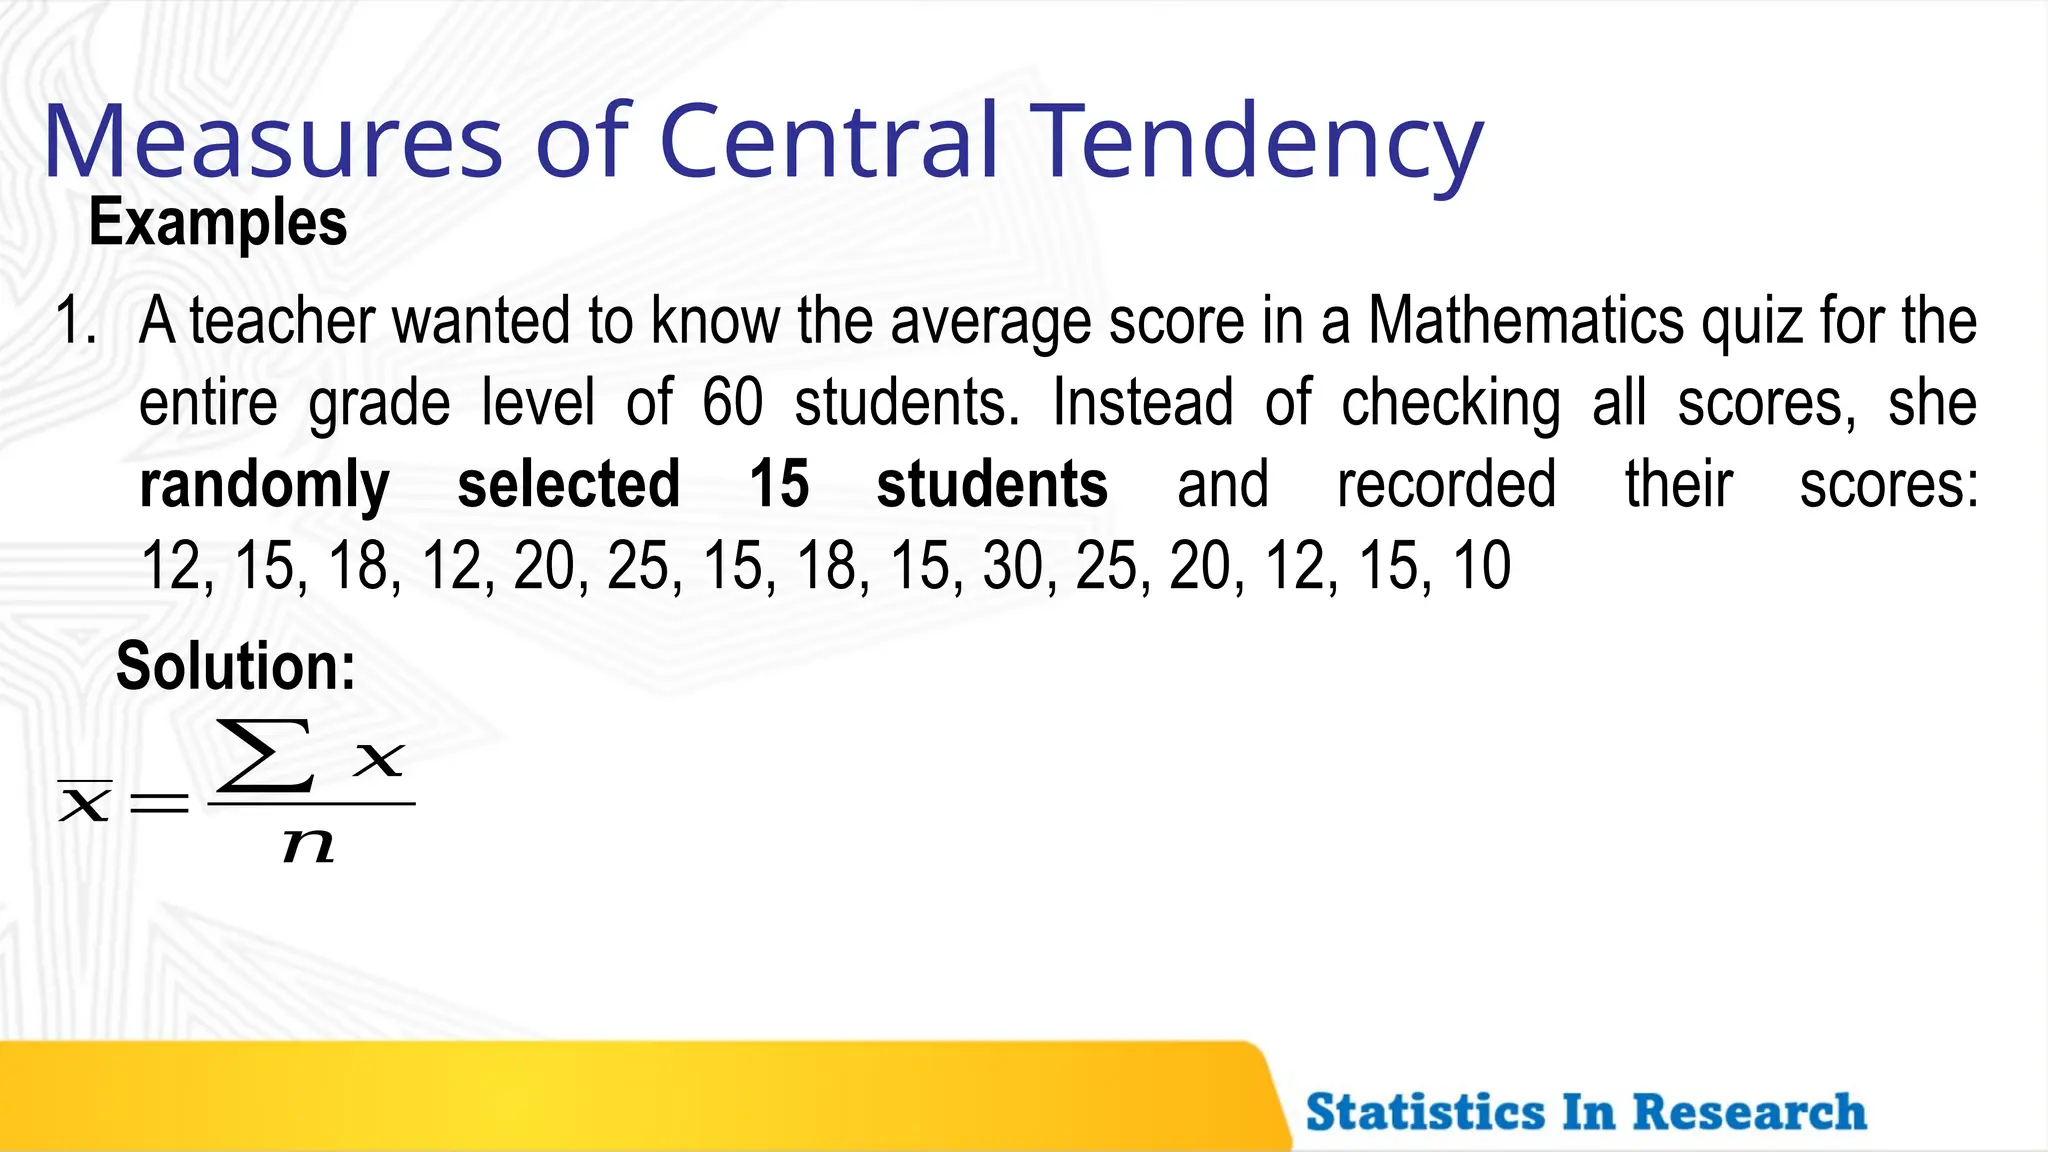
1. A teacher wanted to know the average score in a Mathematics quiz for the
entire grade level of 60 students. Instead of checking all scores, she
randomly selected 15 students and recorded their scores:
12, 15, 18, 12, 20, 25, 15, 18, 15, 30, 25, 20, 12, 15, 10
𝑥=
∑ 𝑥
𝑛
Solution:
13.
Examples
Measures of CentralTendency
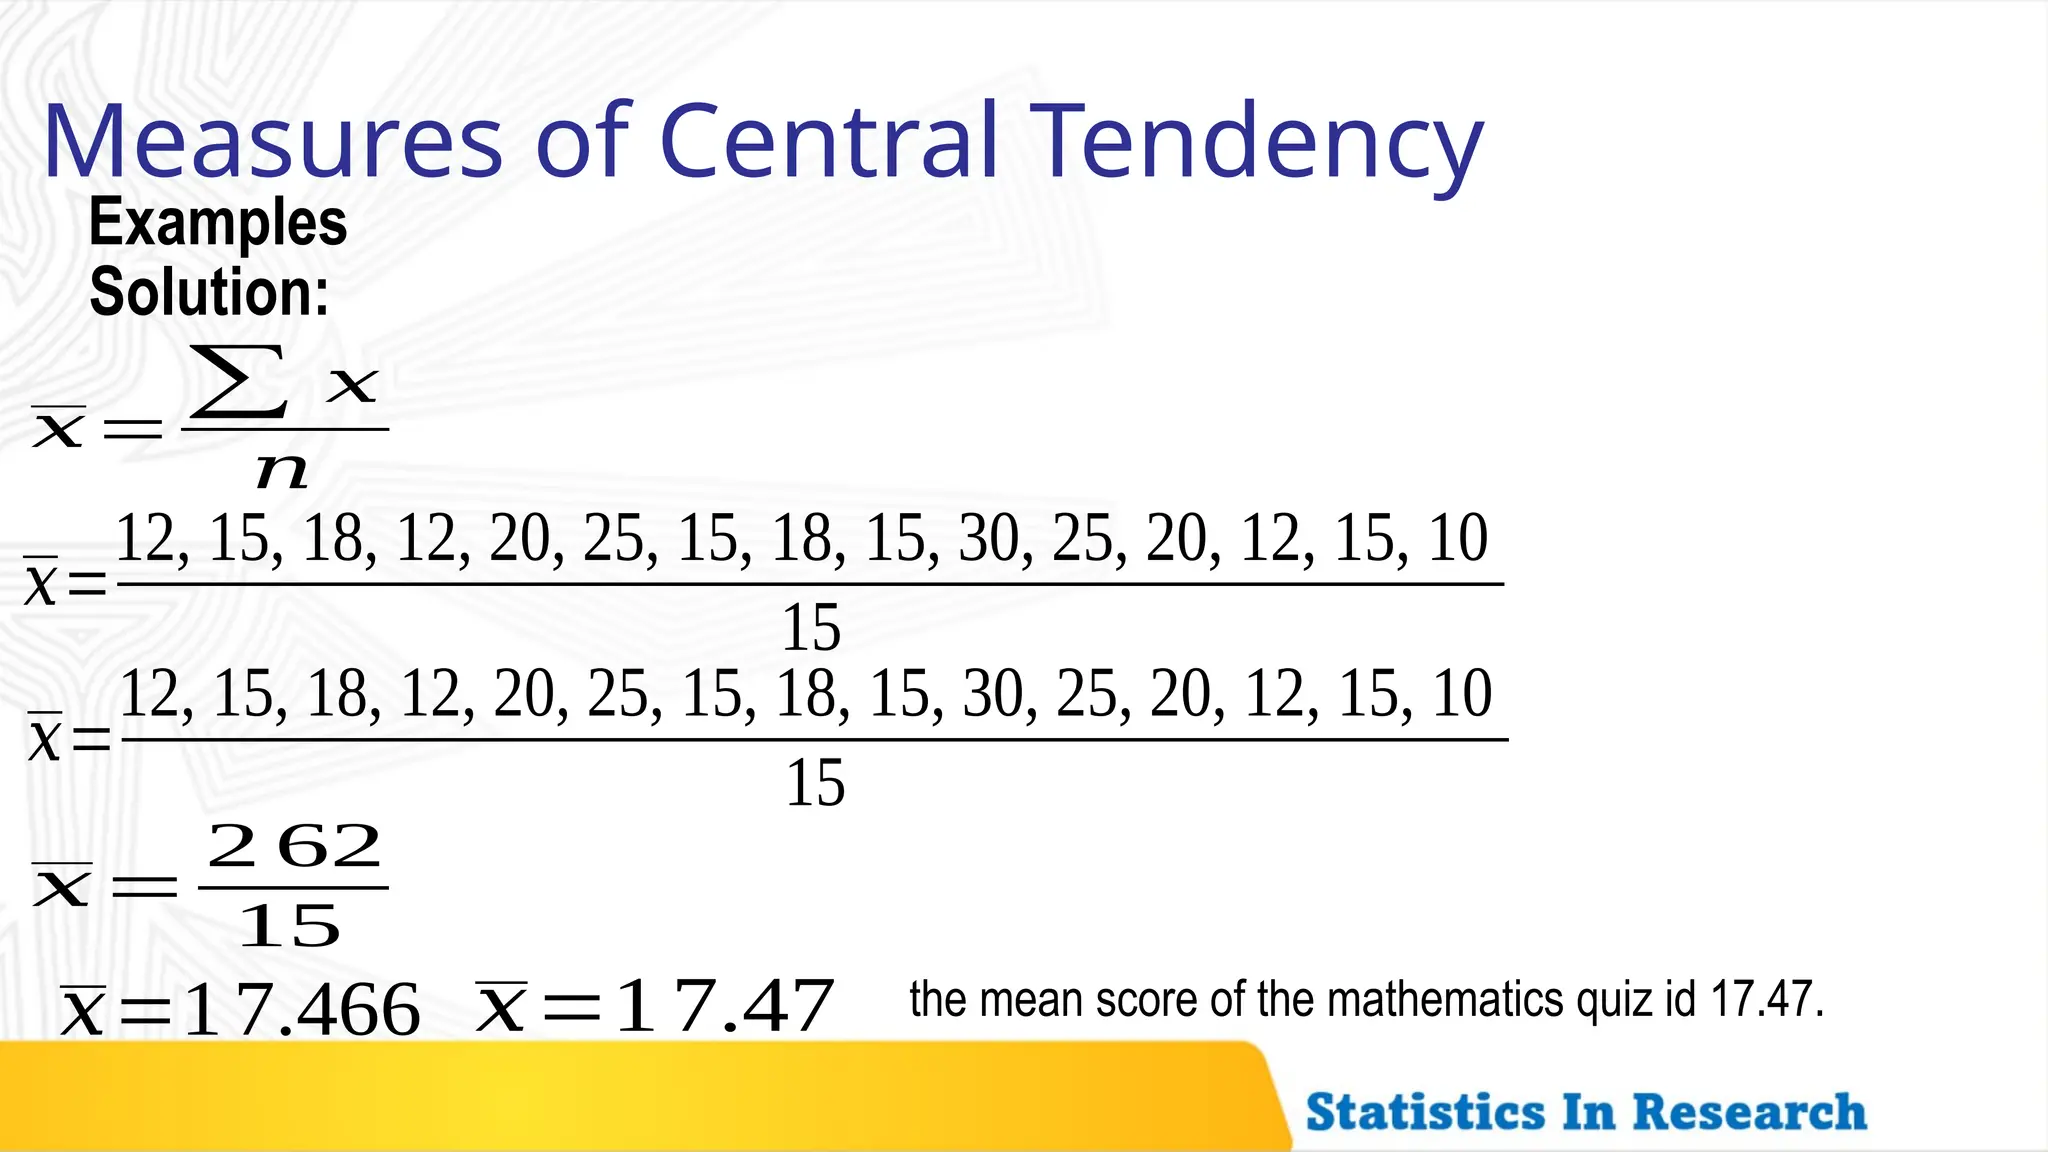
𝑥=
∑ 𝑥
𝑛
Solution:
𝑥=
12, 15, 18, 12, 20, 25, 15, 18, 15, 30, 25, 20, 12, 15, 10
15
𝑥=
12, 15, 18, 12, 20, 25, 15, 18, 15, 30, 25, 20, 12, 15, 10
15
𝑥=
2 62
15
𝑥=17.466 𝑥=1 7.47 the mean score of the mathematics quiz id 17.47.
14.
Examples
Measures of CentralTendency
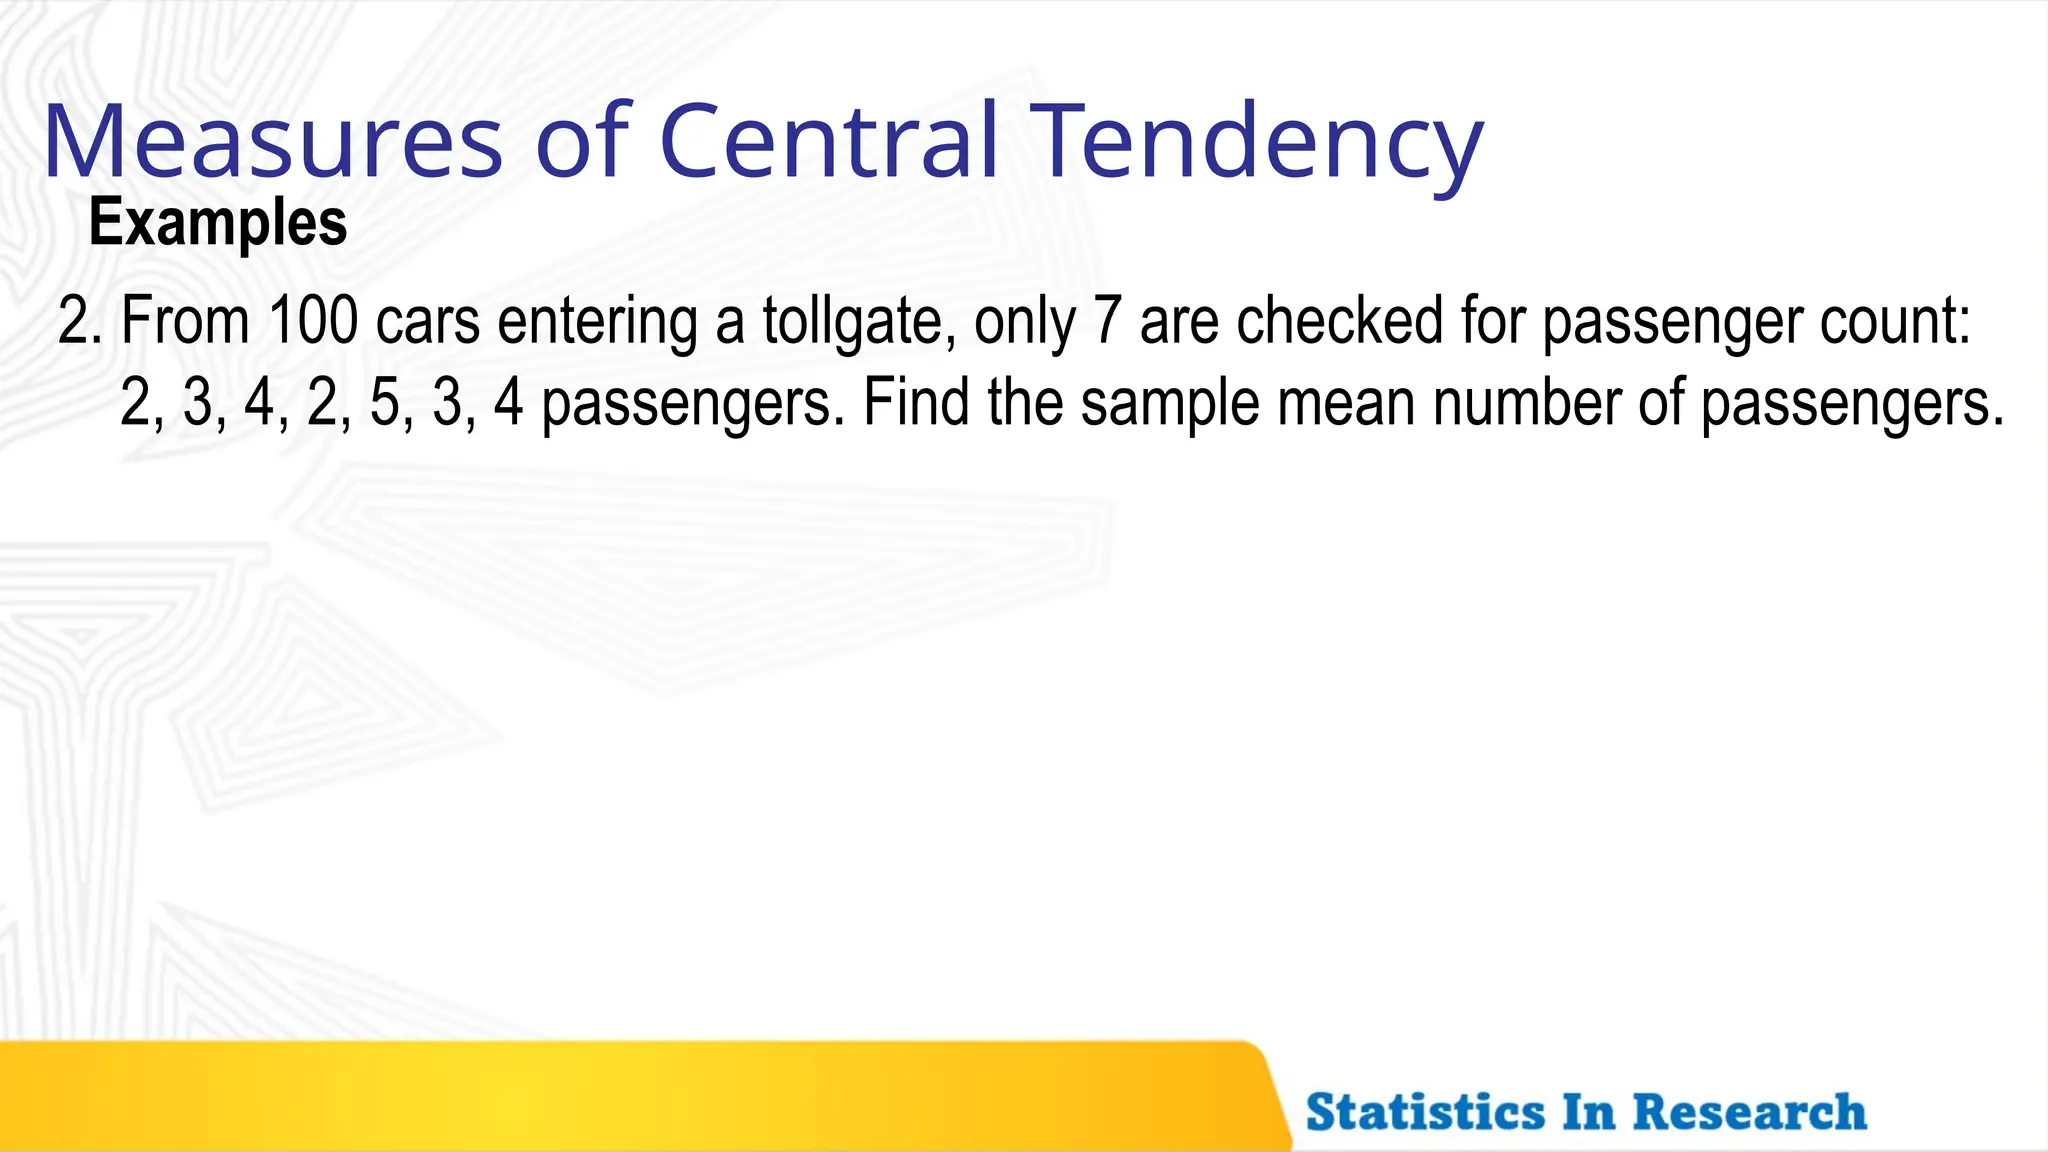
2. From 100 cars entering a tollgate, only 7 are checked for passenger count:
2, 3, 4, 2, 5, 3, 4 passengers. Find the sample mean number of passengers.
15.
Examples
Measure of CentralTendency
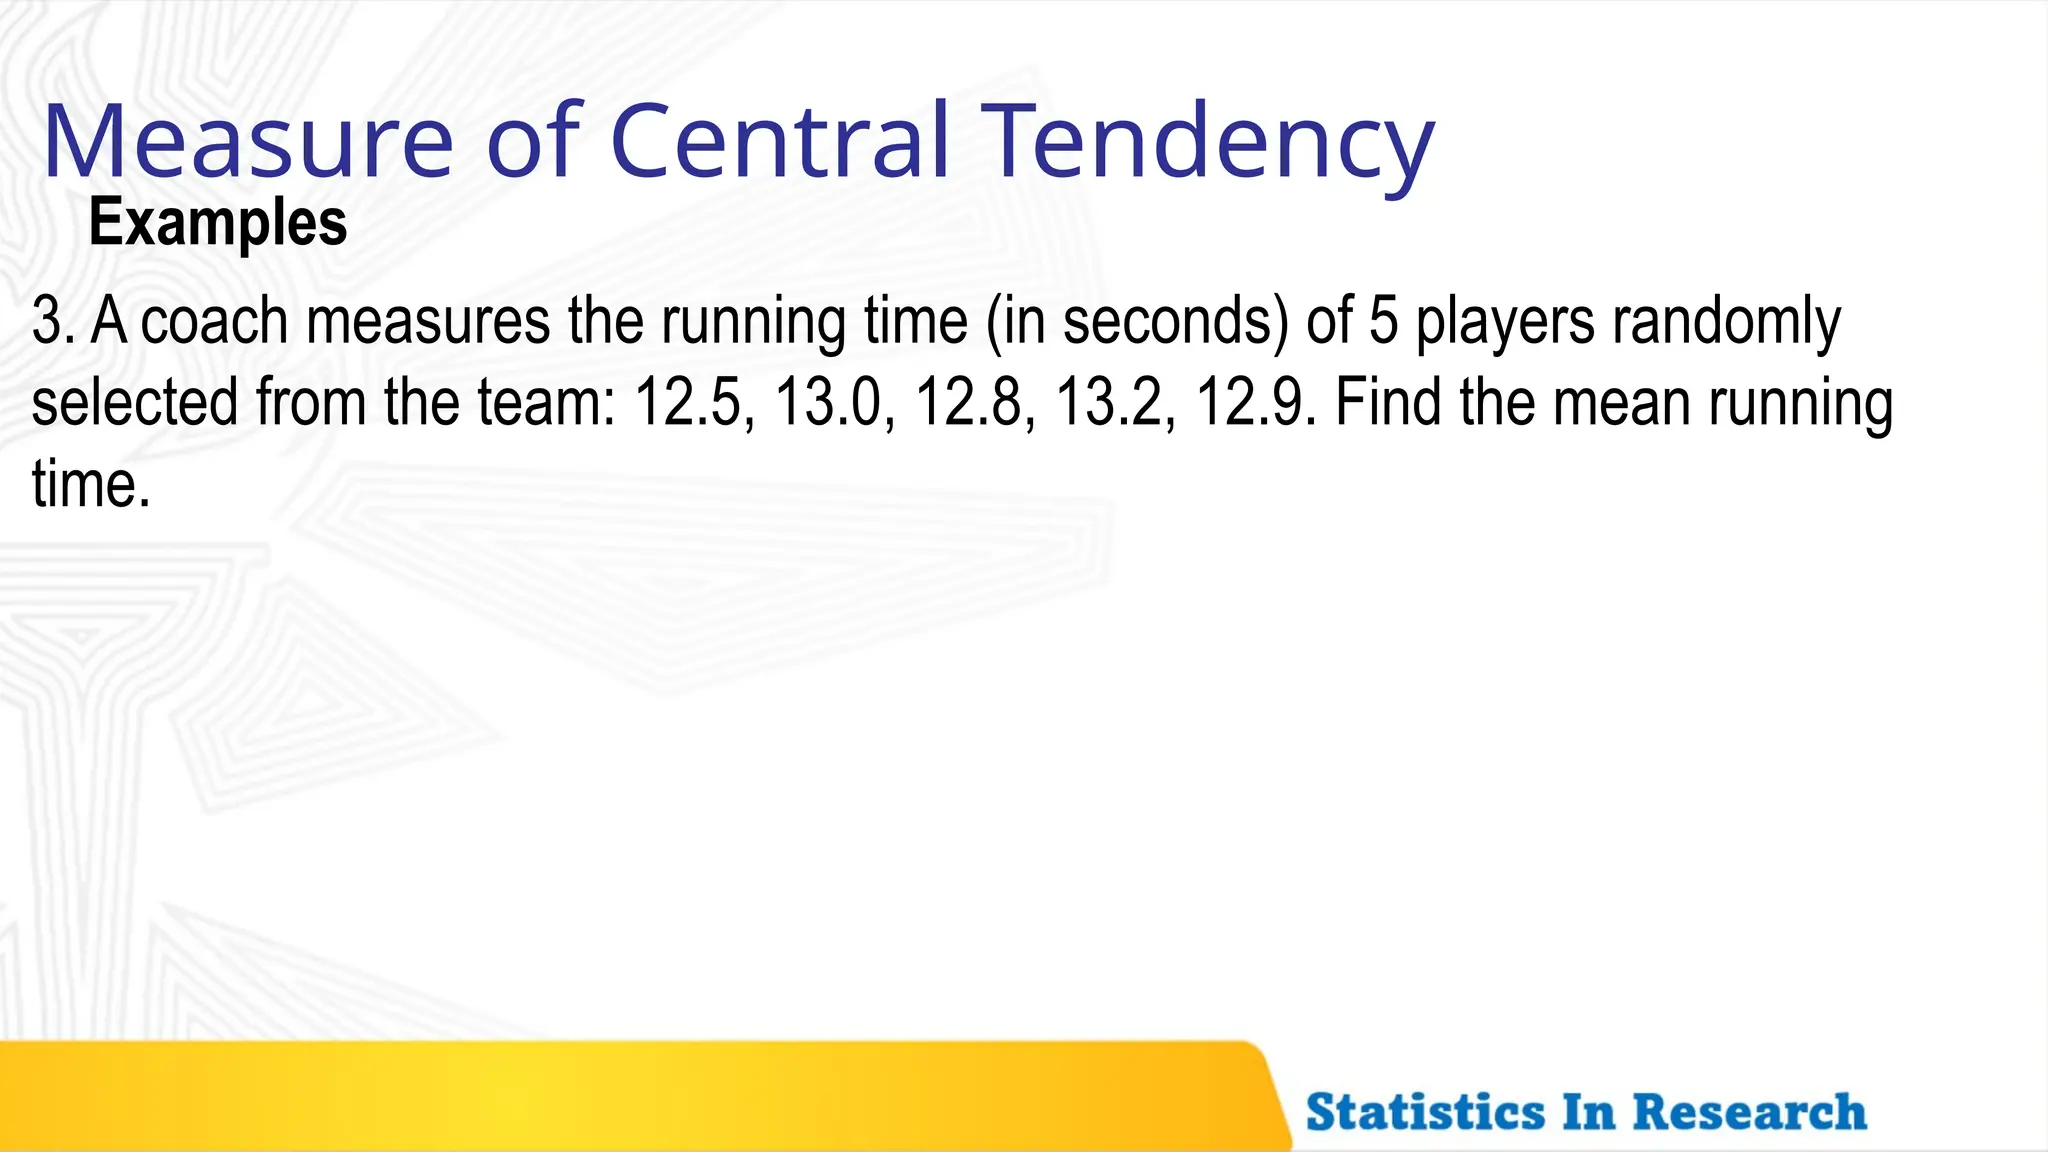
3. A coach measures the running time (in seconds) of 5 players randomly
selected from the team: 12.5, 13.0, 12.8, 13.2, 12.9. Find the mean running
time.
16.
Measure of CentralTendency
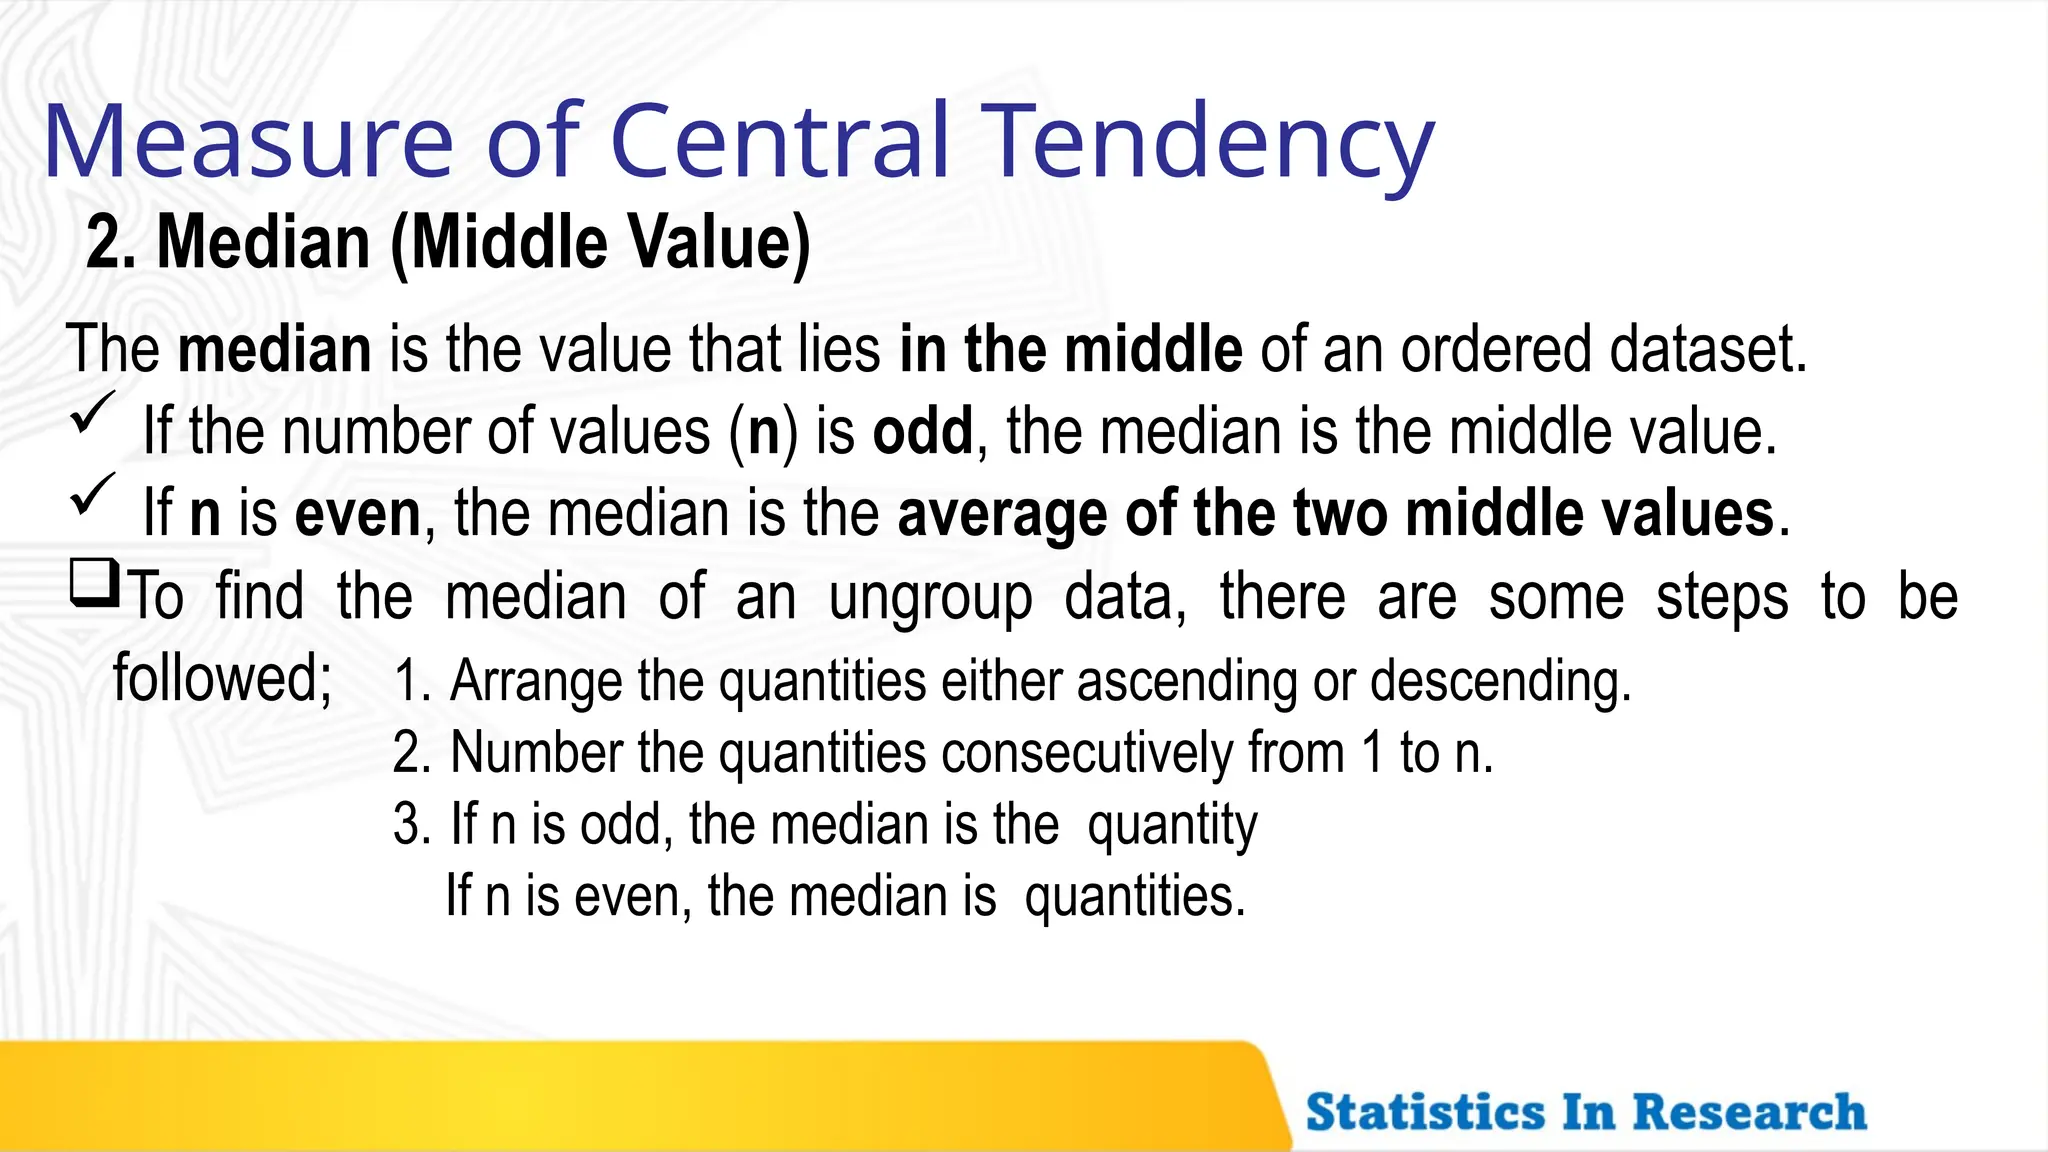
2. Median (Middle Value)
The median is the value that lies in the middle of an ordered dataset.
If the number of values (n) is odd, the median is the middle value.
If n is even, the median is the average of the two middle values.
To find the median of an ungroup data, there are some steps to be
followed; 1. Arrange the quantities either ascending or descending.
2. Number the quantities consecutively from 1 to n.
3. If n is odd, the median is the quantity
If n is even, the median is quantities.
17.
Measure of CentralTendency
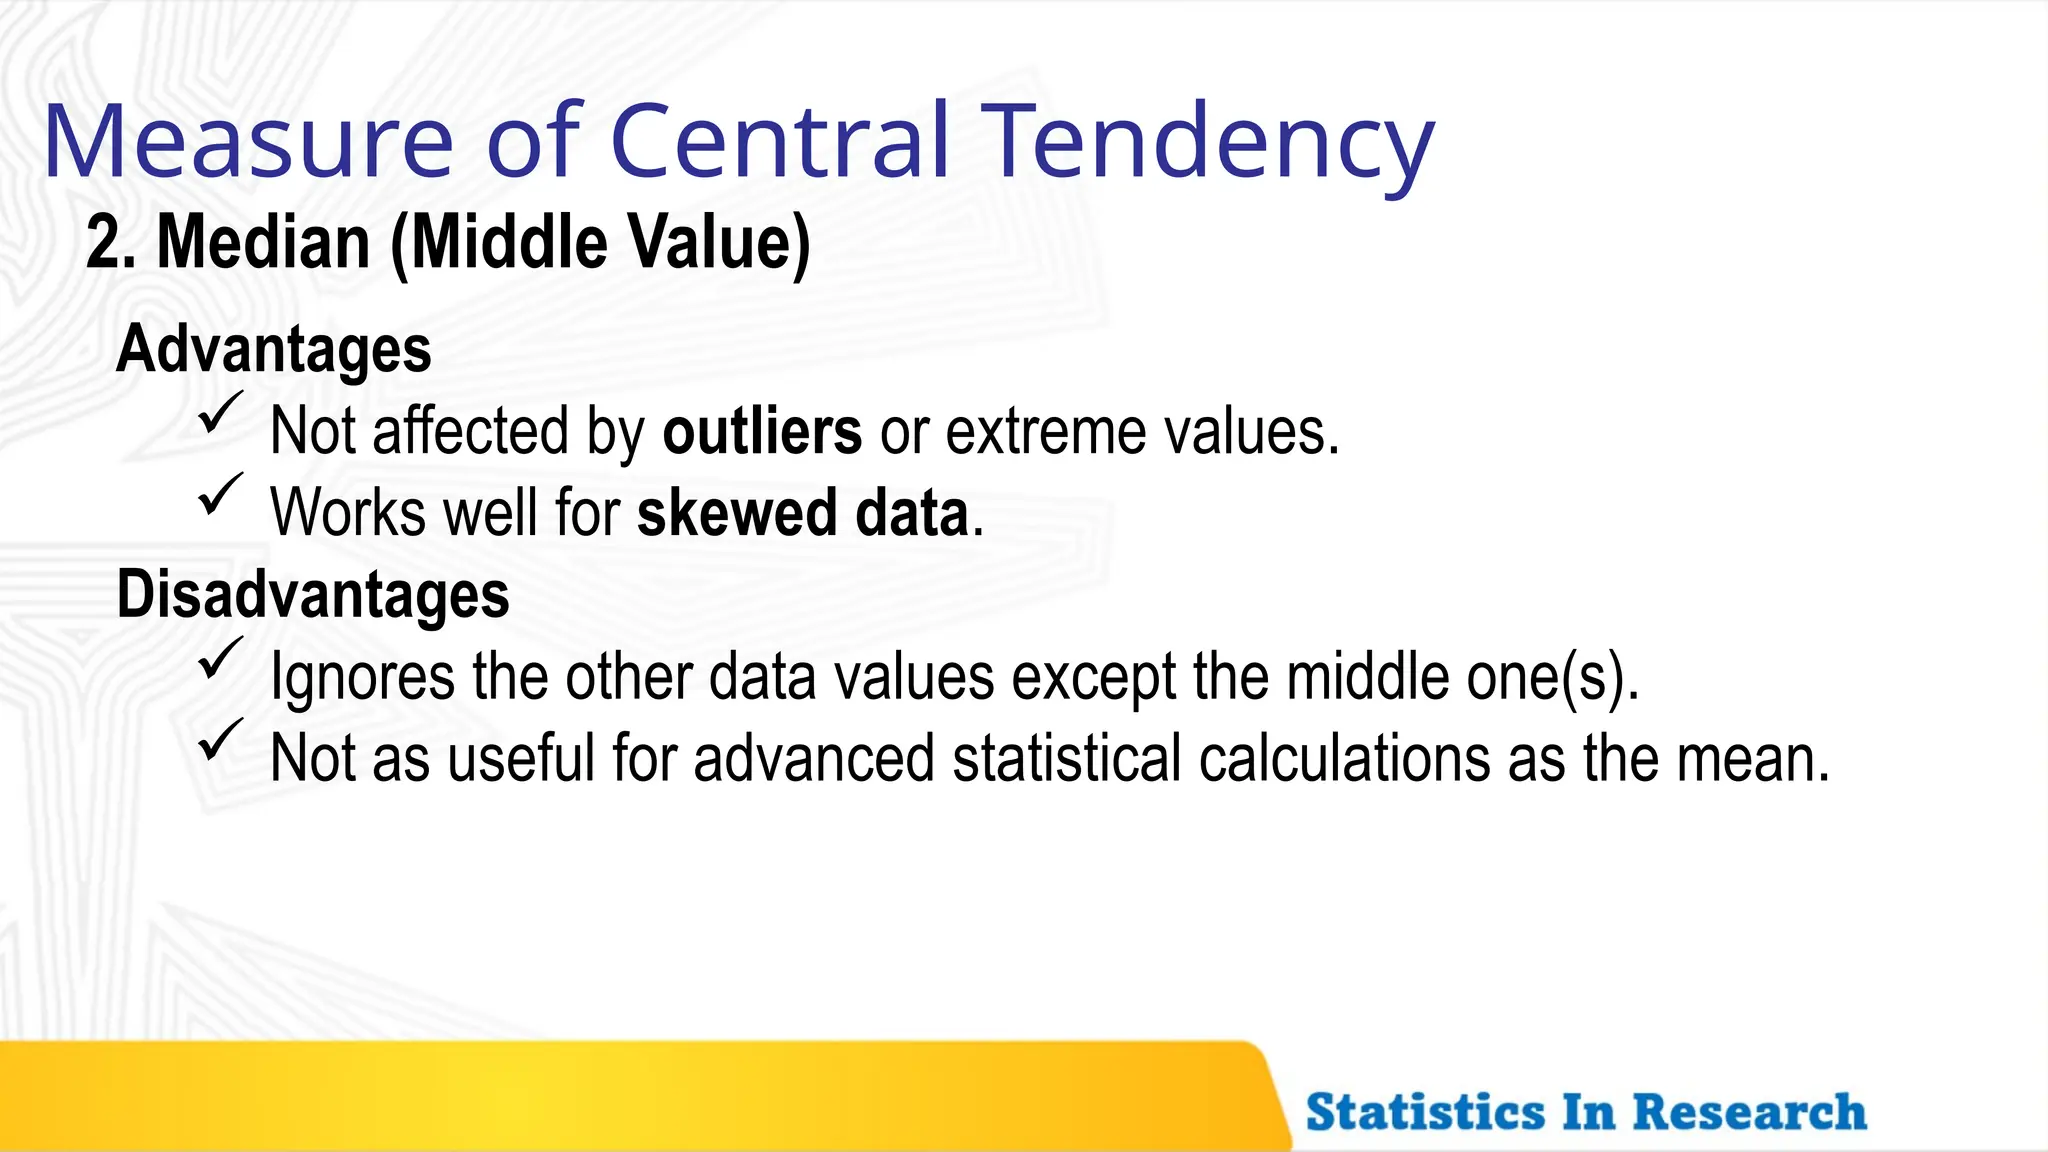
2. Median (Middle Value)
Advantages
Not affected by outliers or extreme values.
Works well for skewed data.
Disadvantages
Ignores the other data values except the middle one(s).
Not as useful for advanced statistical calculations as the mean.
18.
Measure of CentralTendency
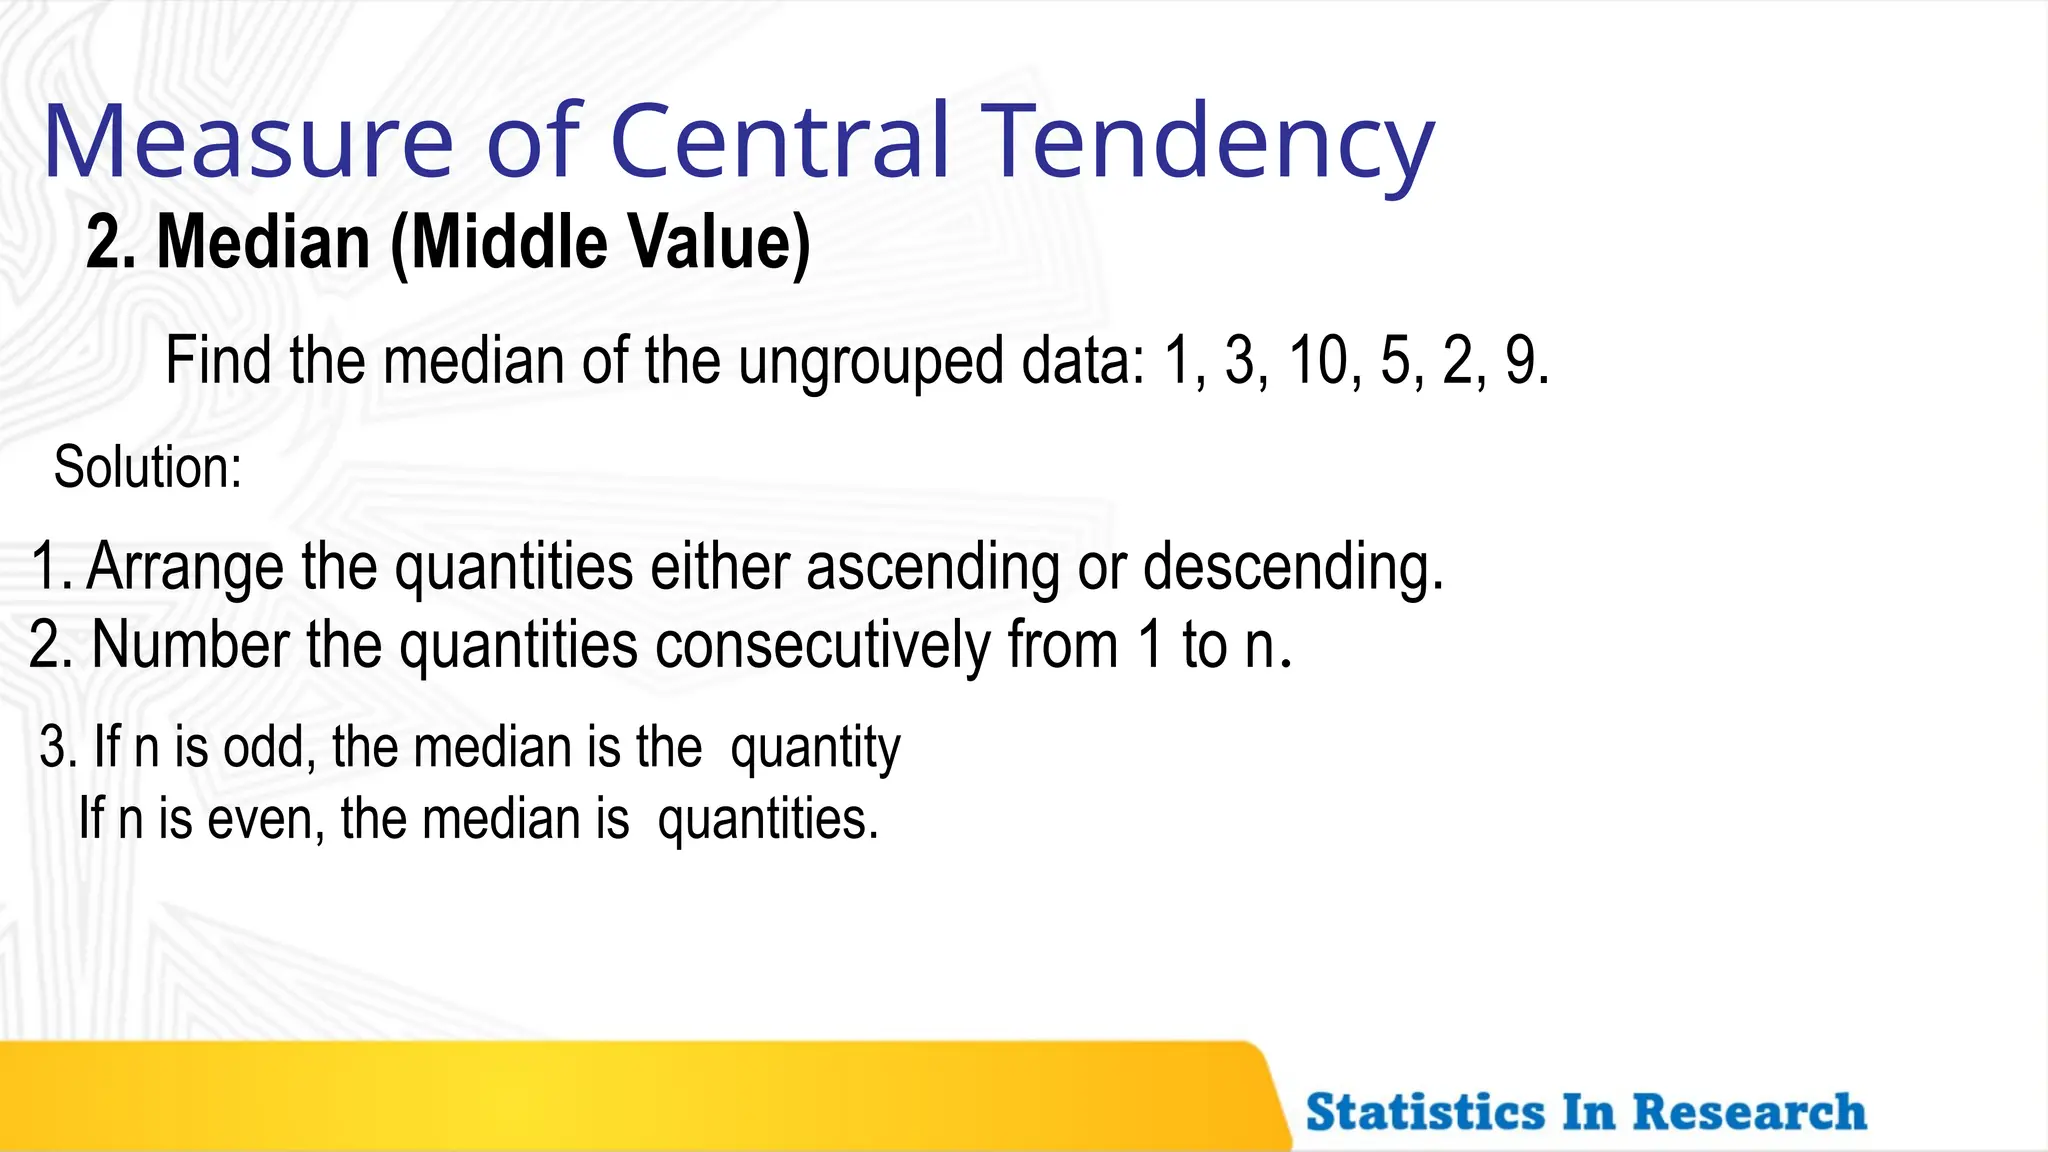
2. Median (Middle Value)
Find the median of the ungrouped data: 1, 3, 10, 5, 2, 9.
Solution:
1. Arrange the quantities either ascending or descending.
2. Number the quantities consecutively from 1 to n.
3. If n is odd, the median is the quantity
If n is even, the median is quantities.
19.
Measure of CentralTendency
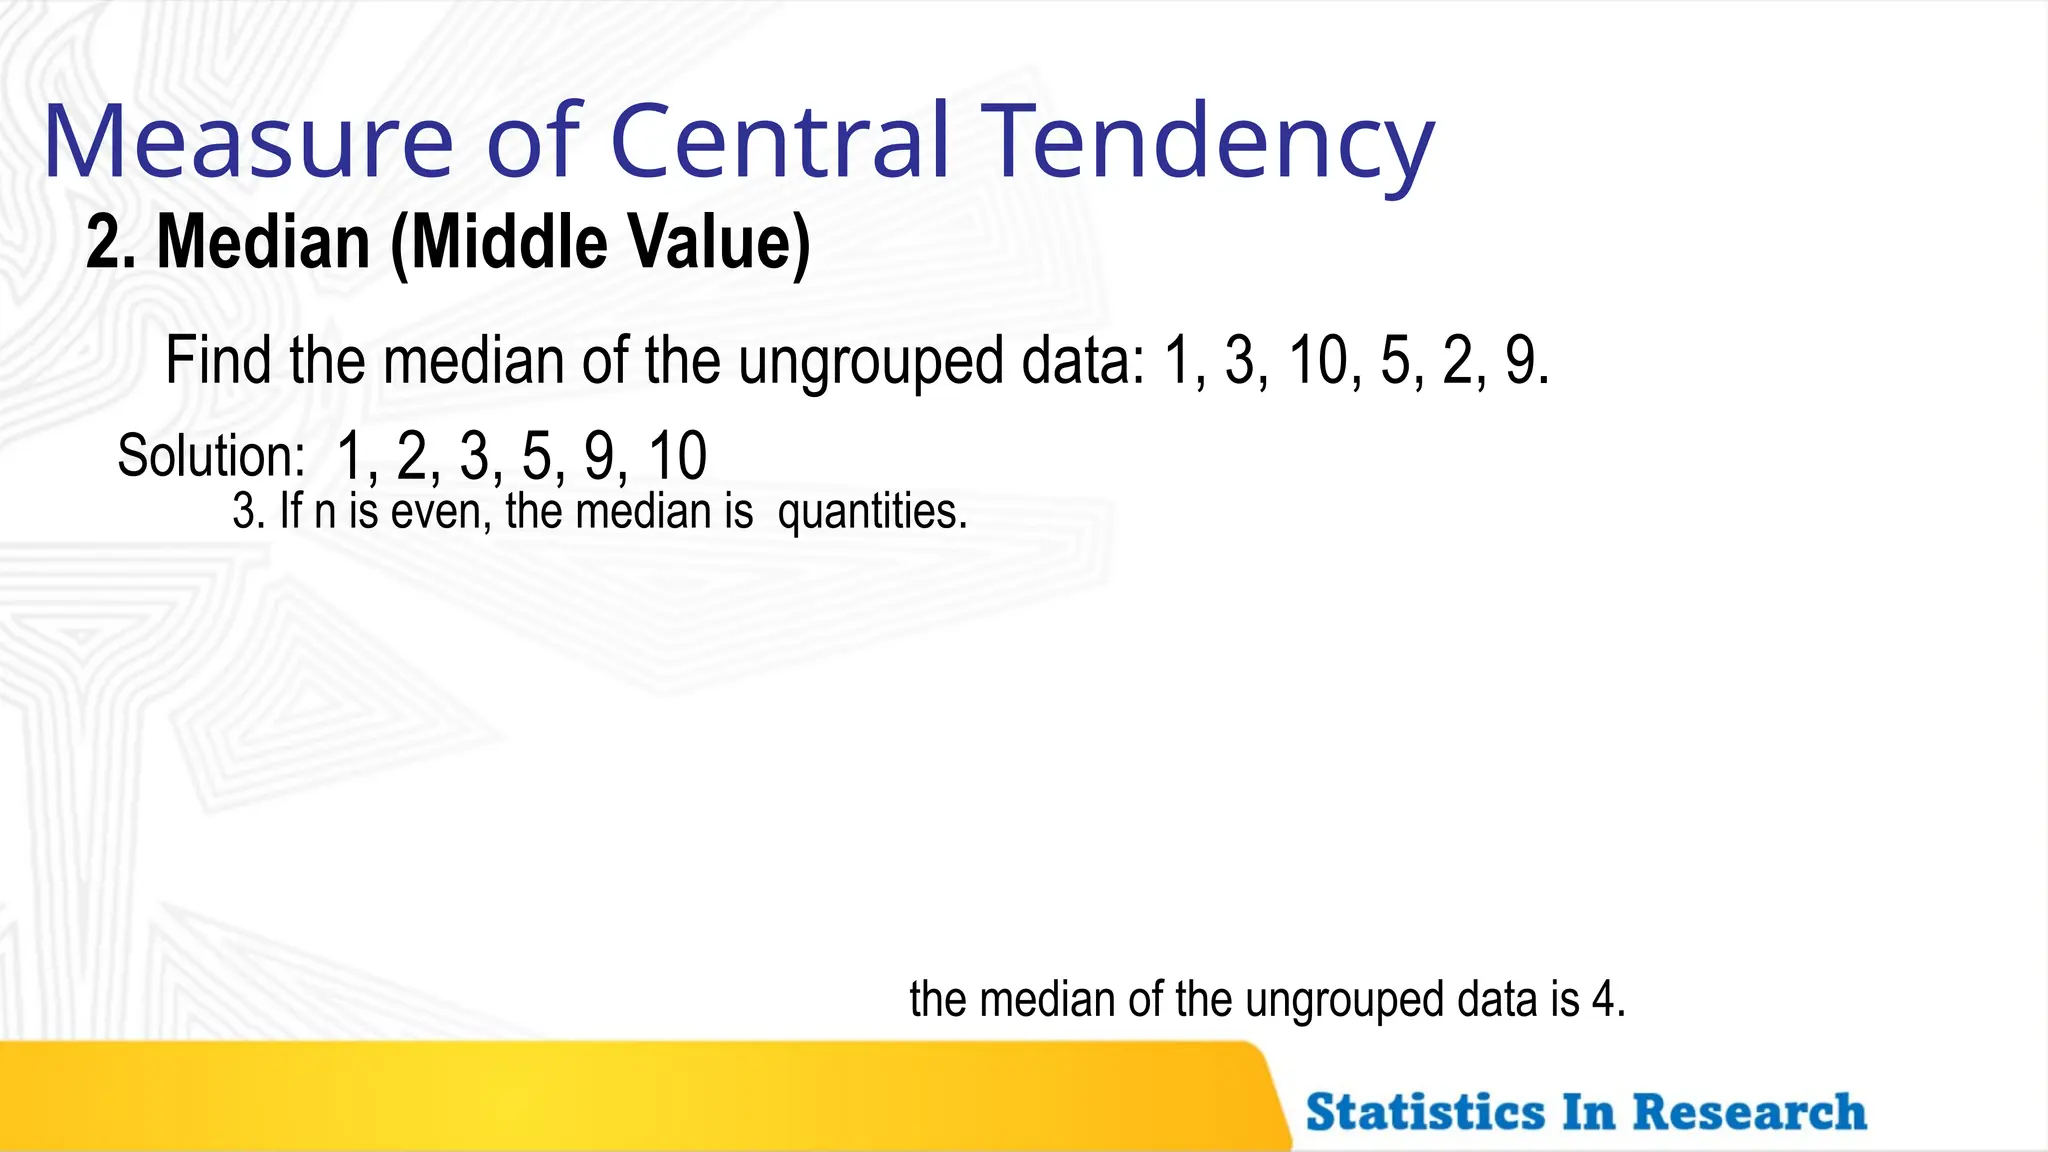
2. Median (Middle Value)
the median of the ungrouped data is 4.
3. If n is even, the median is quantities.
Find the median of the ungrouped data: 1, 3, 10, 5, 2, 9.
1, 2, 3, 5, 9, 10
Solution:
20.
Measure of CentralTendency
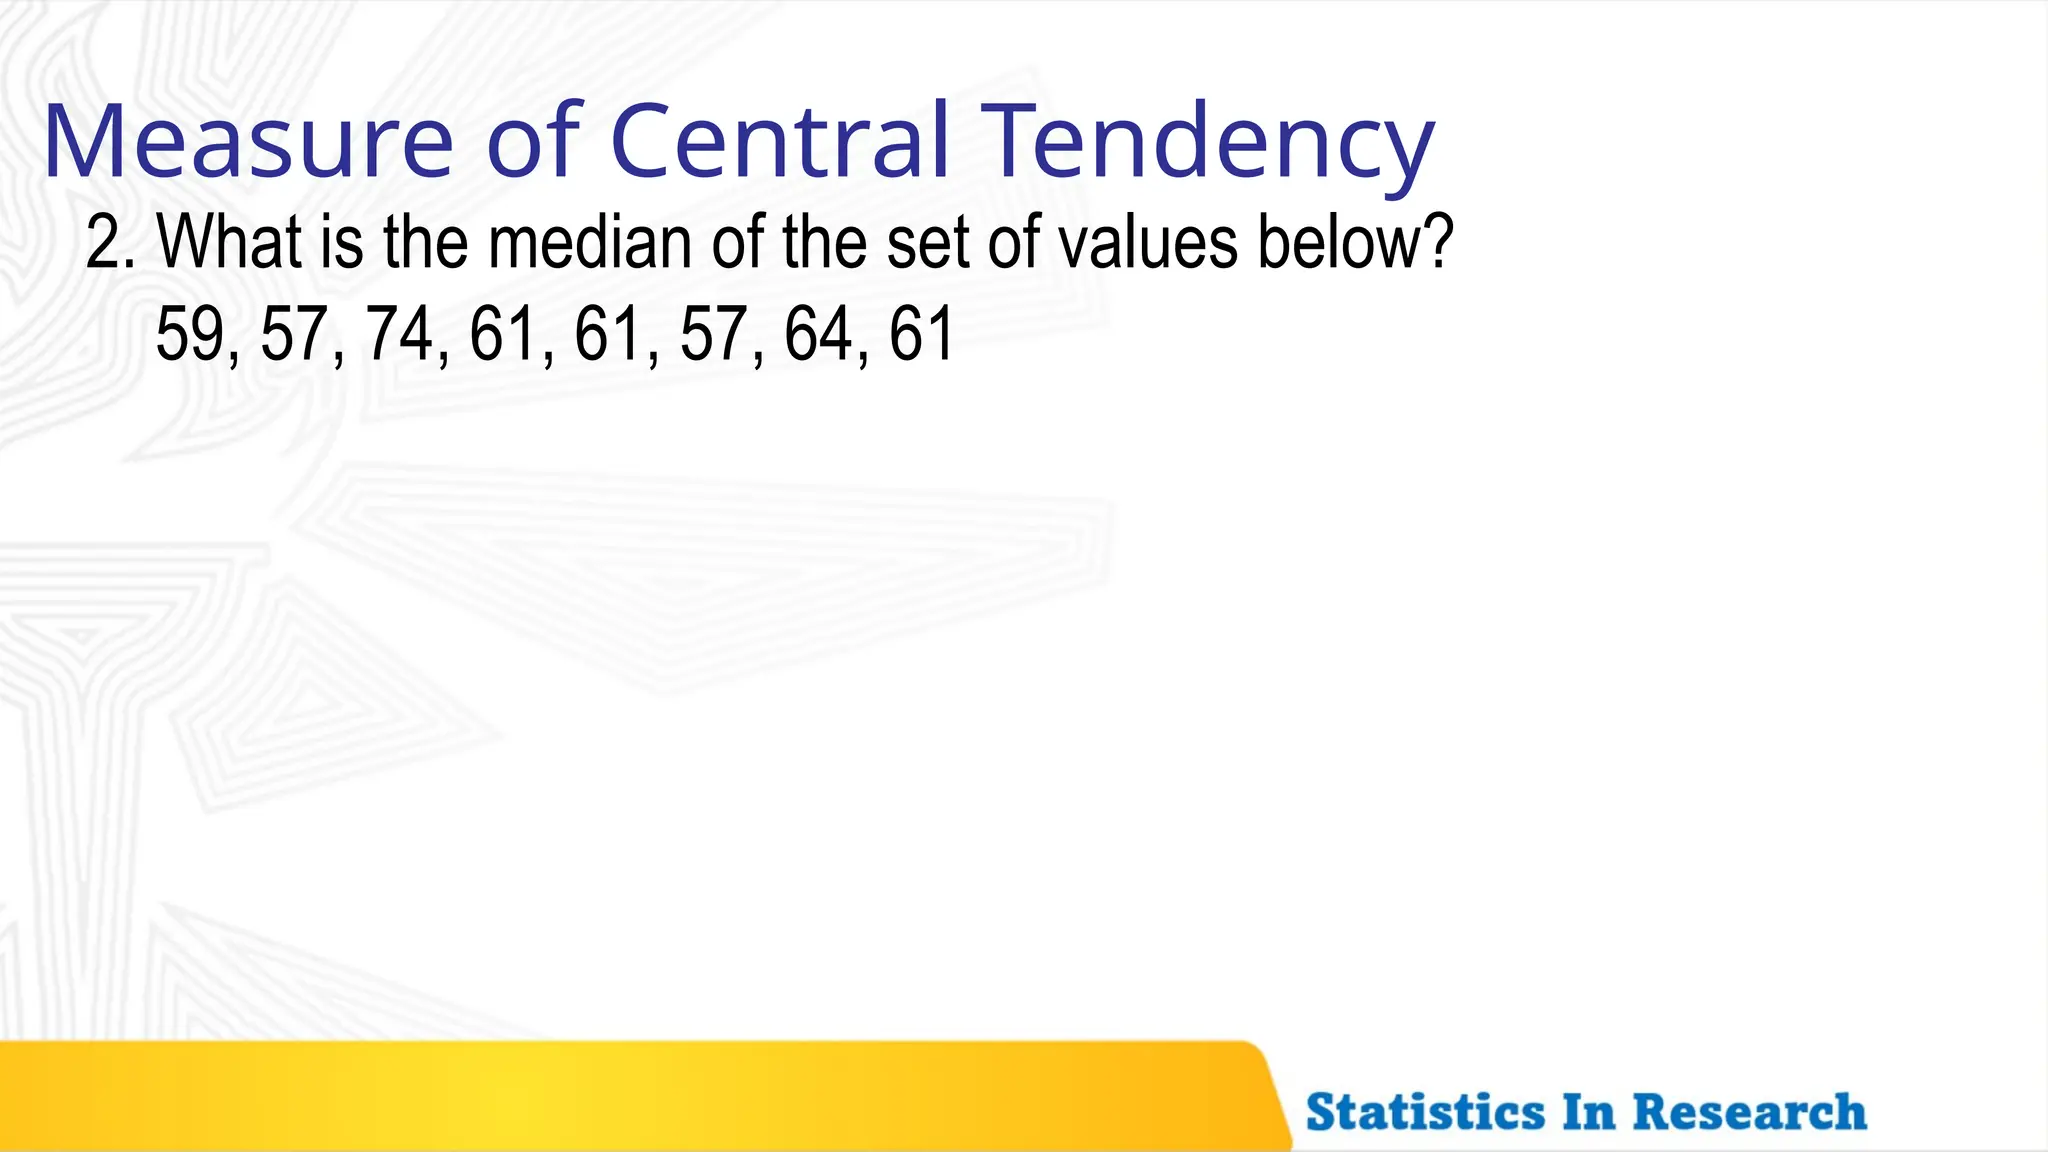
2. What is the median of the set of values below?
59, 57, 74, 61, 61, 57, 64, 61
21.
Measure of CentralTendency
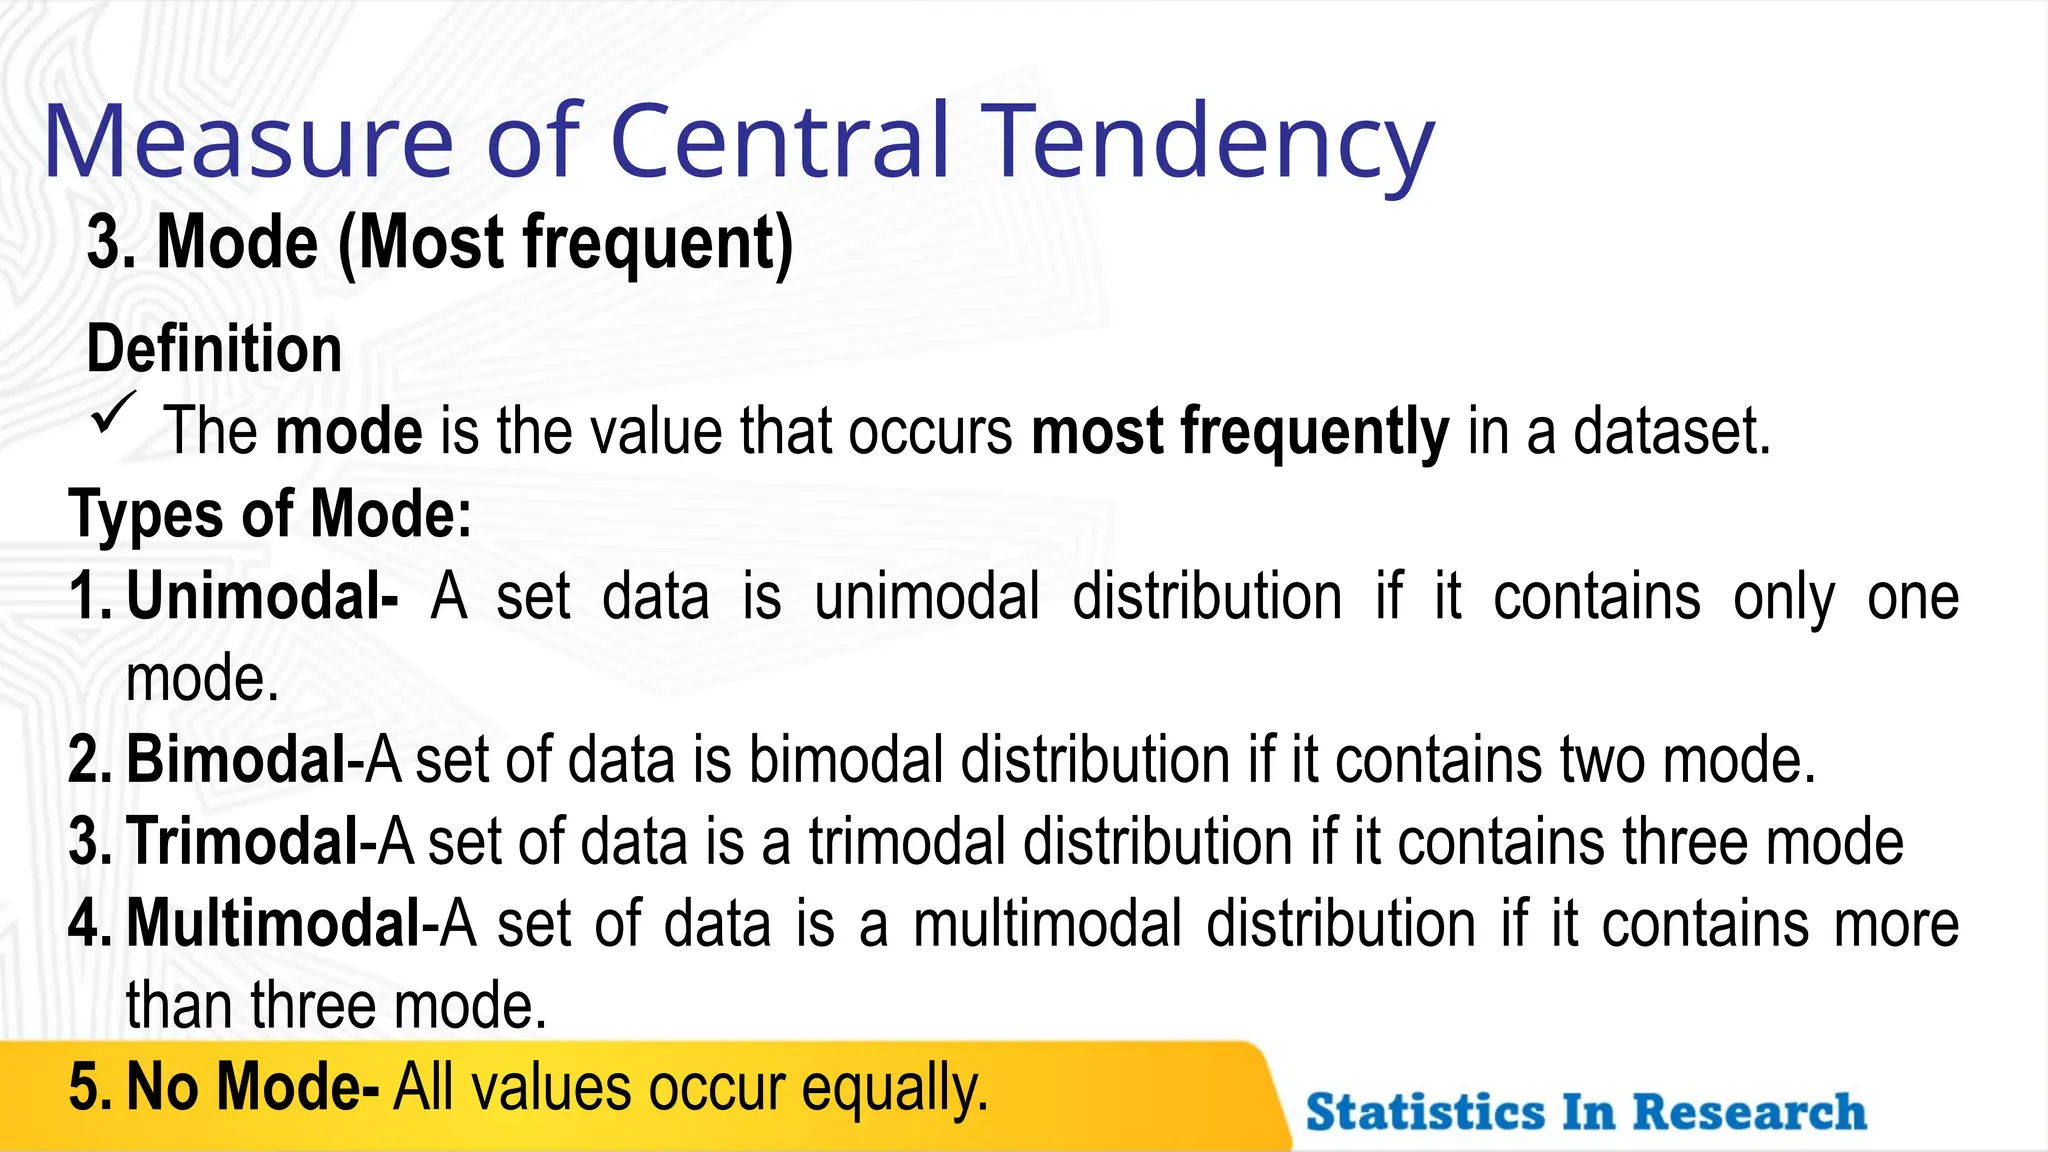
3. Mode (Most frequent)
Definition
The mode is the value that occurs most frequently in a dataset.
Types of Mode:
1. Unimodal- A set data is unimodal distribution if it contains only one
mode.
2. Bimodal-A set of data is bimodal distribution if it contains two mode.
3. Trimodal-A set of data is a trimodal distribution if it contains three mode
4. Multimodal-A set of data is a multimodal distribution if it contains more
than three mode.
5. No Mode- All values occur equally.
22.
Measure of CentralTendency
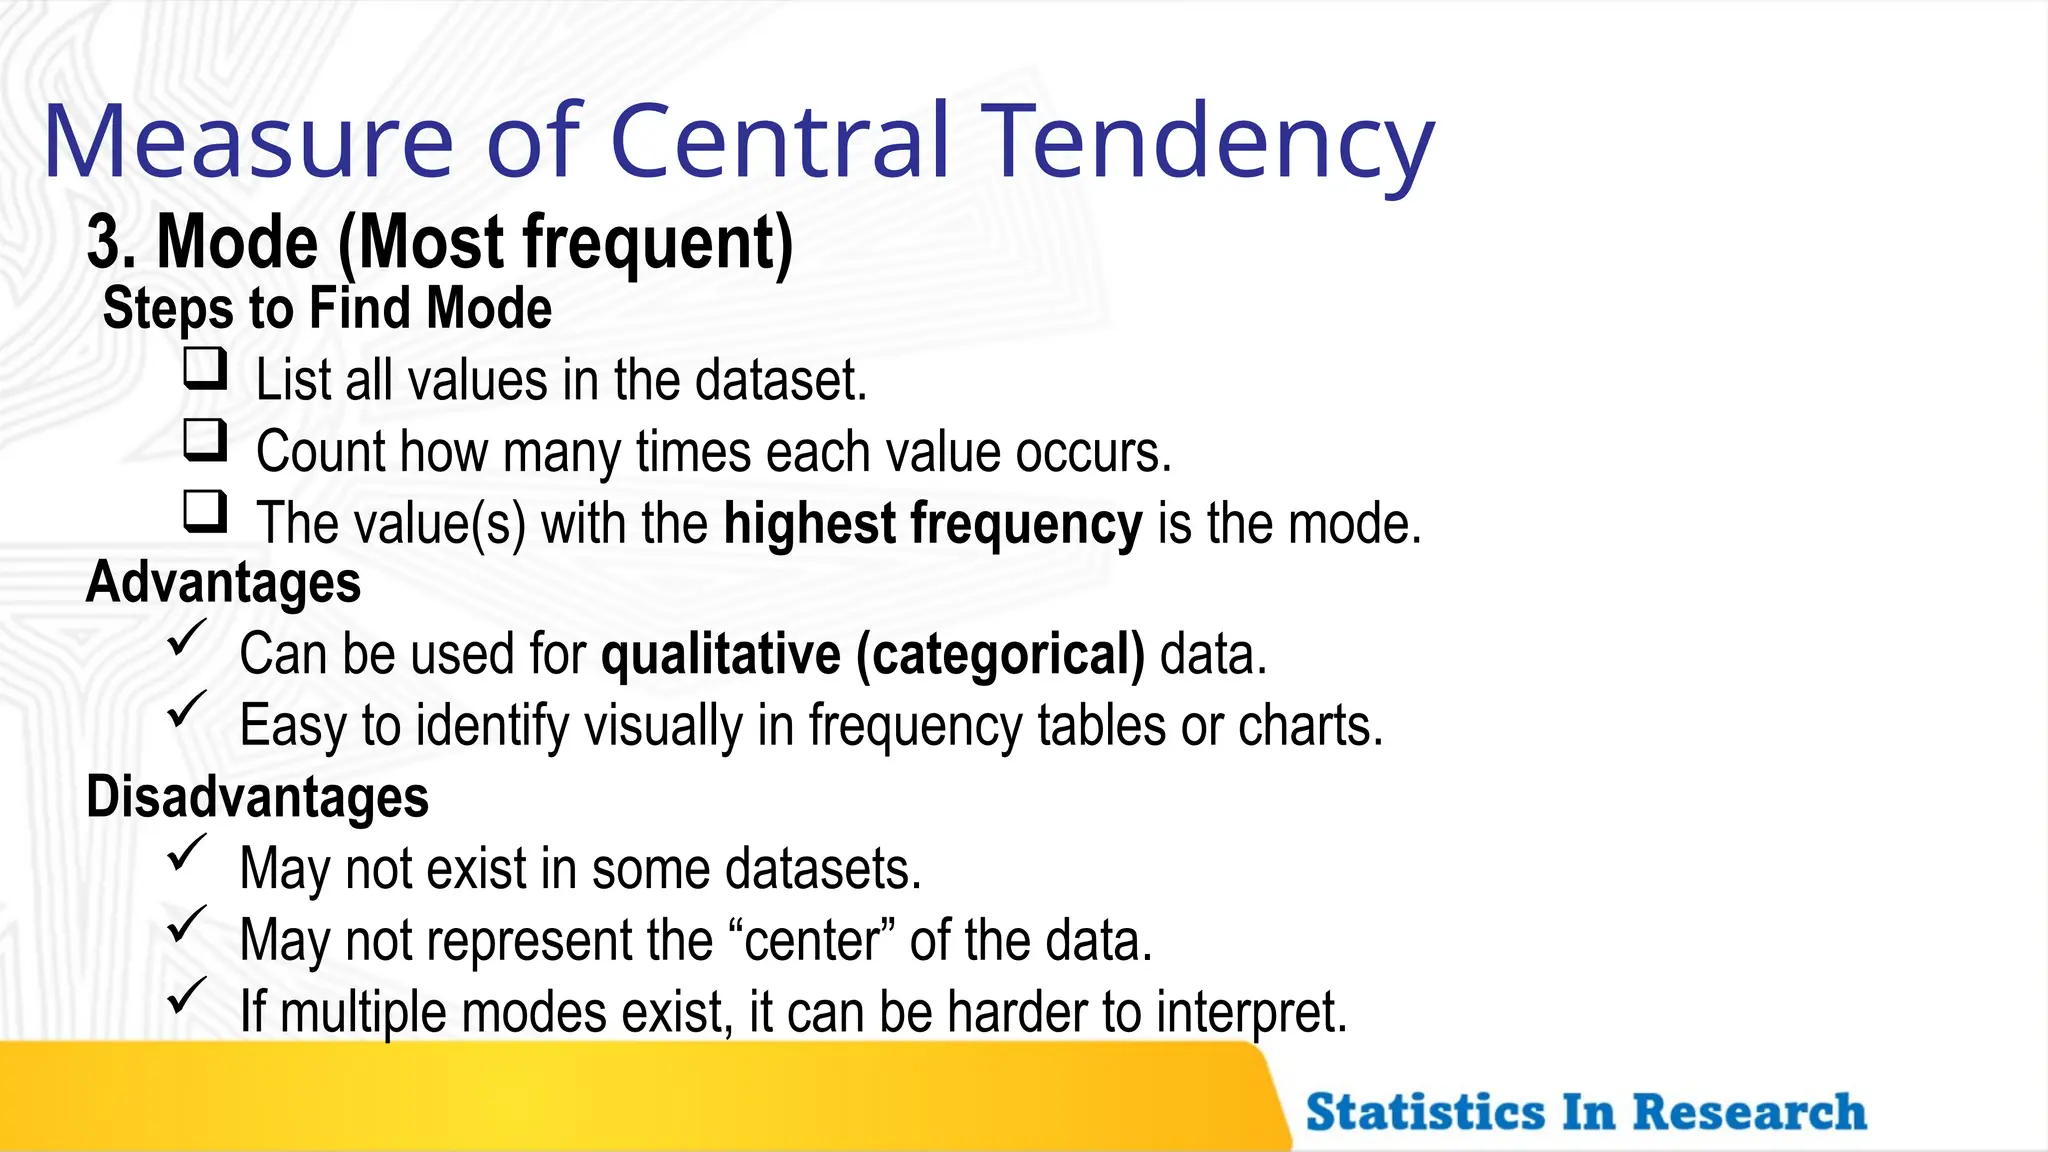
3. Mode (Most frequent)
Steps to Find Mode
List all values in the dataset.
Count how many times each value occurs.
The value(s) with the highest frequency is the mode.
Advantages
Can be used for qualitative (categorical) data.
Easy to identify visually in frequency tables or charts.
Disadvantages
May not exist in some datasets.
May not represent the “center” of the data.
If multiple modes exist, it can be harder to interpret.
23.
Measure of CentralTendency
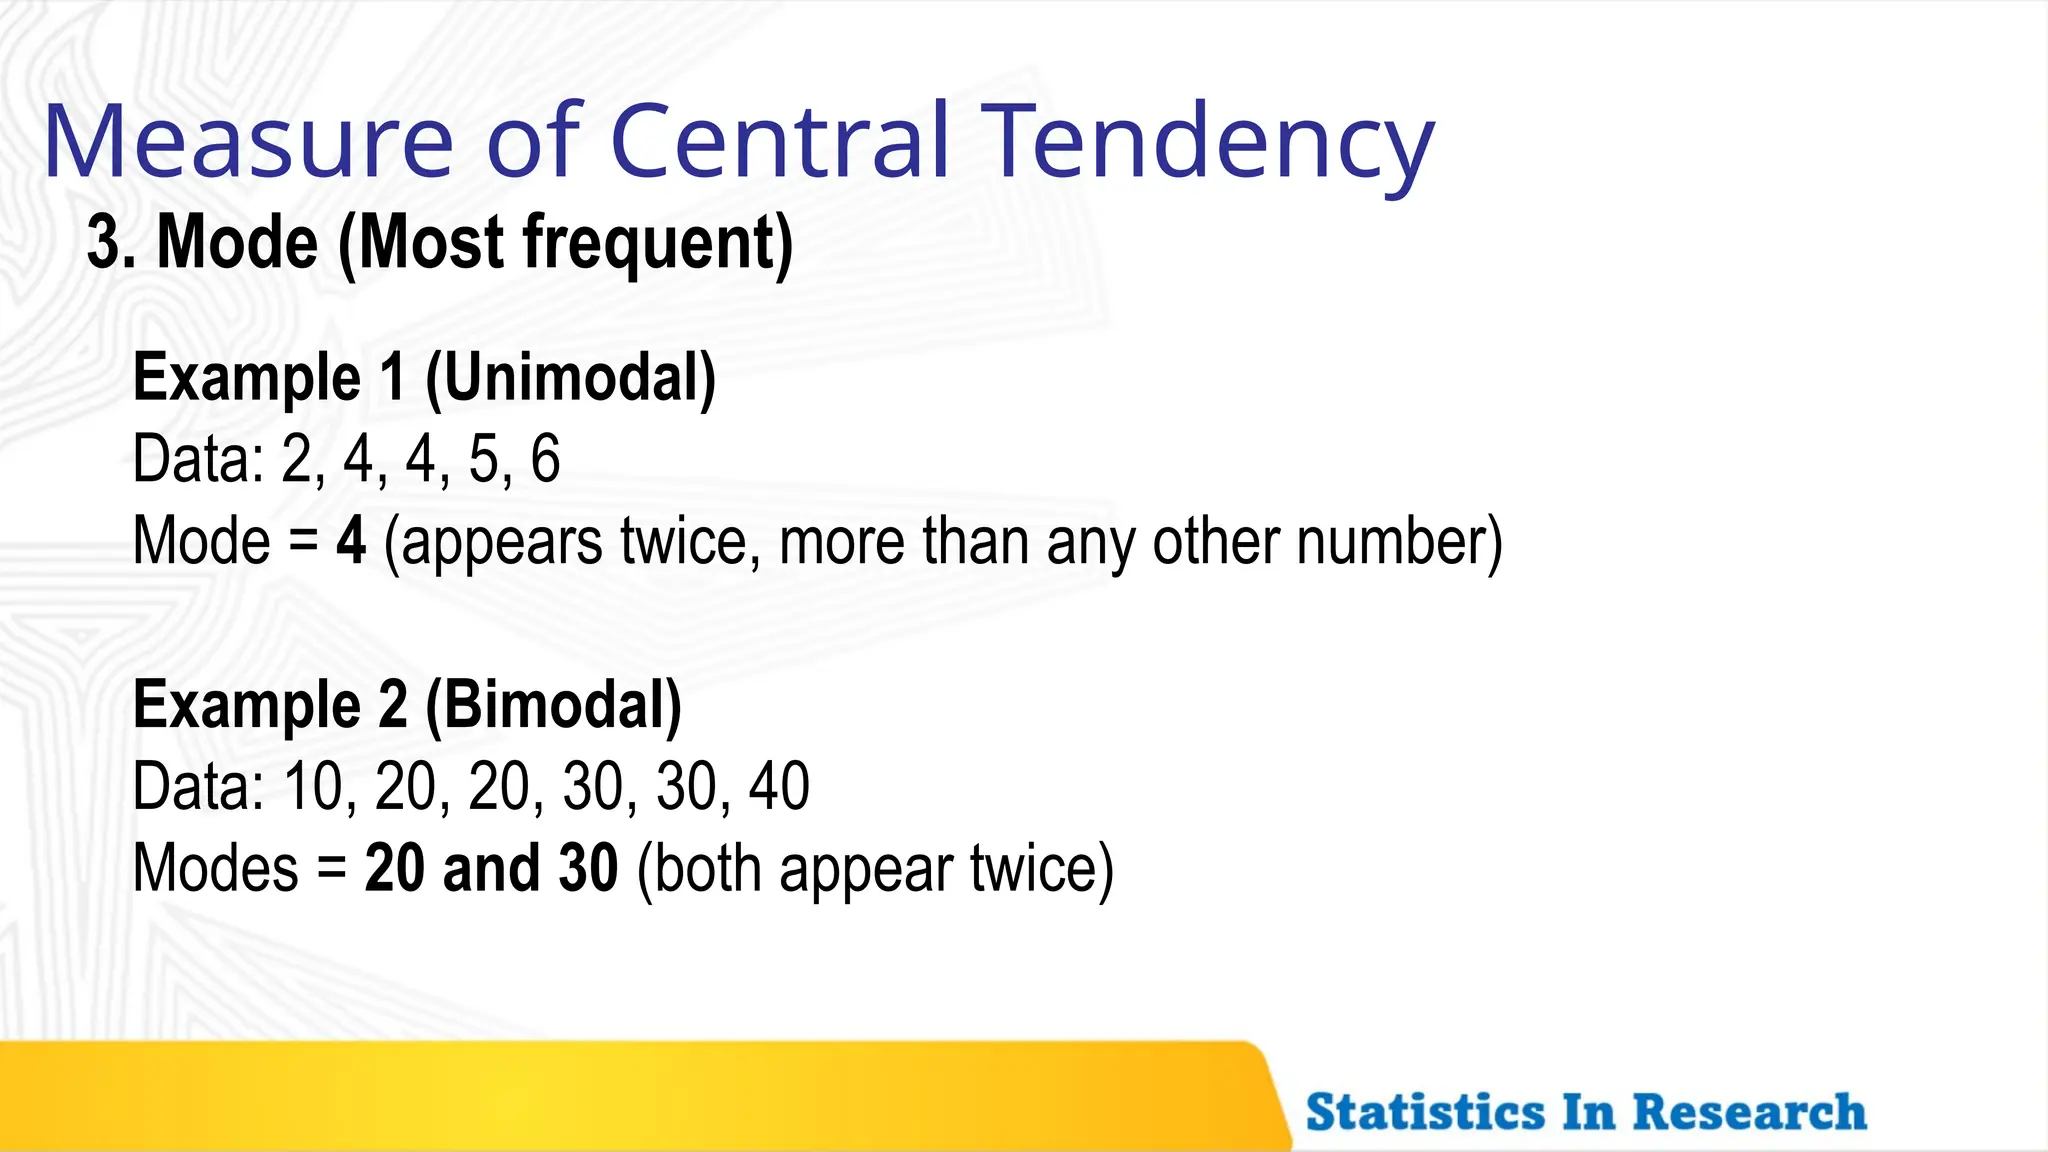
3. Mode (Most frequent)
Example 1 (Unimodal)
Data: 2, 4, 4, 5, 6
Mode = 4 (appears twice, more than any other number)
Example 2 (Bimodal)
Data: 10, 20, 20, 30, 30, 40
Modes = 20 and 30 (both appear twice)
24.
Measure of CentralTendency
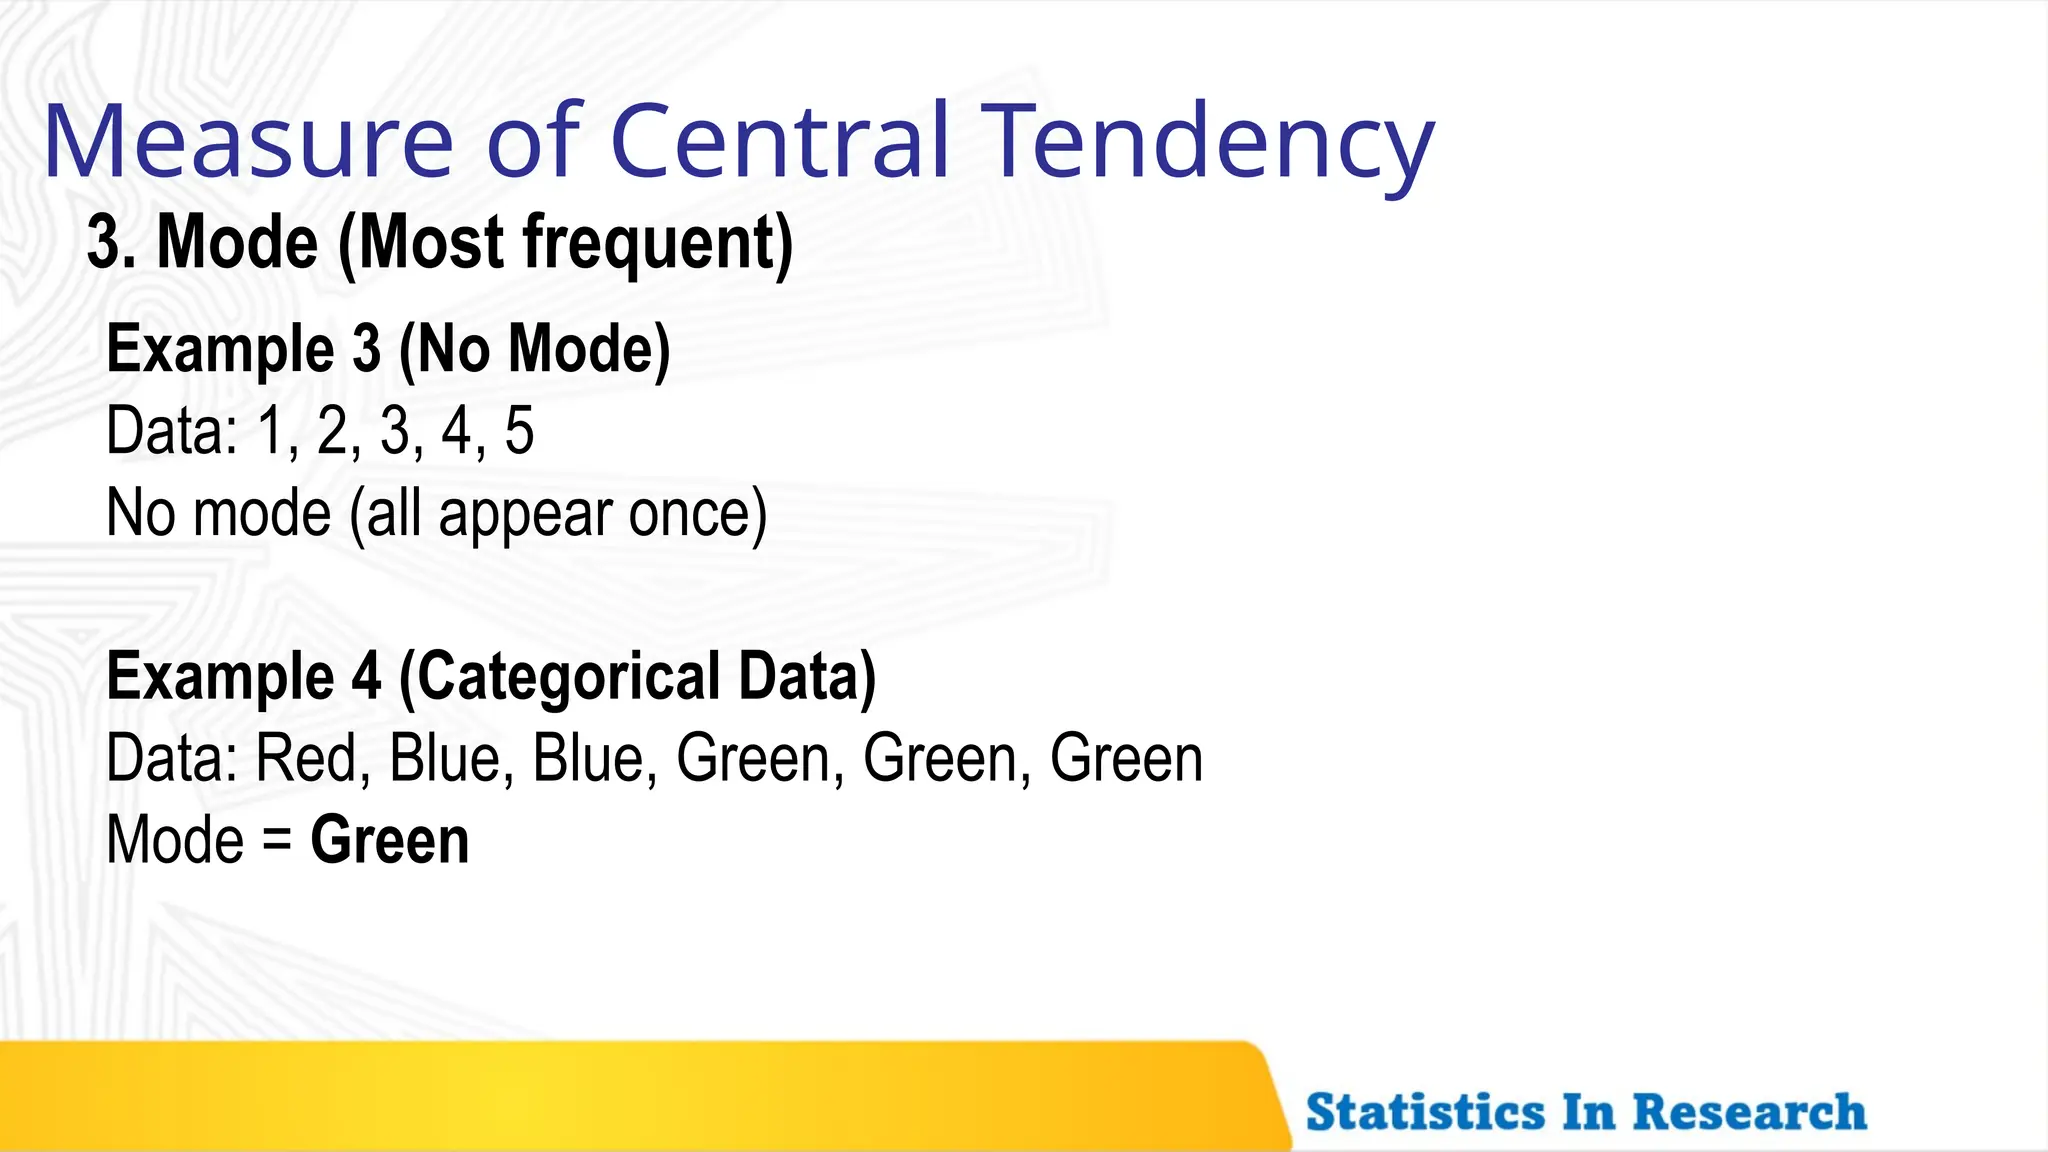
3. Mode (Most frequent)
Example 3 (No Mode)
Data: 1, 2, 3, 4, 5
No mode (all appear once)
Example 4 (Categorical Data)
Data: Red, Blue, Blue, Green, Green, Green
Mode = Green
25.
Measure of CentralTendency
4. Given the following data, find the mode of;
36 1, 16, 4, 45, 35, 13


![2 JoHari Window Theory [final].pptx](https://cdn.slidesharecdn.com/ss_thumbnails/2johariwindowtheoryfinal-221121172251-0d74beb6-thumbnail.jpg?width=640&height=640&fit=bounds)


