SlideShare a Scribd company logo
• Statistical inference is the process of reaching
conclusions about characteristics of an entire population
using data from a subset, or sample, of that Population.
• The process of making guesses about the truth about a
population parameter from a sample statistic.
• To Draw the conclusion about the population parameter
by using sample information.
• Parameter ? u
• Statistic ? X-bar , s, regression coefficient
STATISTICAL INFERENCE
Divided into two
branches
Estimation of
parameters
Testing of hypothesis
Problem 1st: C.I for single mean
• The masses, in grams, of thirteen ball bearings taken at
random from a batch are
•
Calculate a 95% C.I for the mean mass of the population.
Solution:
Mean=
σ 𝒙
𝒏
=
𝟑𝟏𝟒.𝟕
𝟏𝟑
= 𝟐𝟒. 𝟐𝟏
𝒔 =
σ(𝑥𝑖 − ഥ
𝒙)𝟐
𝒏 − 𝟏
= 𝟑. 𝟏𝟐 = 𝟏. 𝟕𝟕 ,
𝒗 = 𝒏 − 𝟏 = 𝟏𝟑 − 𝟏 = 𝟏𝟐
21.4 23.1 25.9 23.4 24.5 25.0 25.0 22.5 26.9 26.4 25.8 23.2 21.9
• ഥ
𝑥 ±𝑡𝜕/2v
𝑠
𝑛
• Alpha =1- level of confidence
• Alpha=1-0.95=0.05
• V=n-1= 13-1=12
𝟐𝟒. 𝟐𝟏 ± 𝒕𝟎.𝟎𝟓
𝟐
𝒗
𝟏. 𝟕𝟕
𝟏𝟑
𝒕𝟎.𝟎𝟐𝟓 𝟏𝟐 = 𝟐. 𝟏𝟕𝟗 → (From the t-table)
𝟐𝟒. 𝟐𝟏 ± 𝟐. 𝟏𝟕𝟗
𝟏. 𝟕𝟕
𝟏𝟑
24.21+2.179(0.49)=25.28 Upper-limit
24.21-2.179(0.49)=23.14 Lower-limit
At 95%
Confidence
interval
PERCENTAGE POINT OF STUDENT'S t-DISTRIBUTION
Alpha
d.f. 0.250 0.100 0.050 0.025 0.0125 0.005
1 1.000 3.078 6.314 12.706 31.821 63.657
2 0.816 1.886 2.920 4.303 6.965 9.925
3 0.765 1.638 2.353 3.182 4.541 5.841
4 0.741 1.533 2.132 2.776 3.747 4.604
5 0.727 1.476 2.015 2.571 3.365 4.032
6 0.718 1.440 1.943 2.447 3.143 3.707
7 0.711 1.415 1.895 2.365 2.998 3.499
8 0.706 1.397 1.860 2.306 2.896 3.355
9 0.703 1.383 1.833 2.262 2.821 3.250
10 0.700 1.372 1.812 2.228 2.764 3.169
11 0.697 1.363 1.796 2.201 2.718 3.106
12 0.695 1.356 1.782 2.179 2.681 3.055
13 0.694 1.350 1.771 2.160 2.650 3.012
14 0.692 1.345 1.761 2.145 2.624 2.977
15 0.691 1.341 1.753 2.131 2.602 2.947
16 0.690 1.337 1.746 2.120 2.583 2.921
17 0.689 1.333 1.740 2.110 2.567 2.898
18 0.688 1.330 1.734 2.101 2.552 2.878
19 0.688 1.328 1.729 2.093 2.539 2.861
20 0.687 1.325 1.725 2.086 2.528 2.845
21 0.686 1.323 1.721 2.080 2.518 2.831
22 0.686 1.321 1.717 2.074 2.508 2.819
23 0.685 1.319 1.714 2.069 2.500 2.807
24 0.685 1.318 1.711 2.064 2.492 2.797
25 0.684 1.316 1.708 2.060 2.485 2.787
26 0.684 1.315 1.706 2.056 2.479 2.779
27 0.684 1.314 1.703 2.052 2.473 2.771
28 0.683 1.313 1.701 2.048 2.467 2.763
29 0.683 1.311 1.699 2.045 2.462 2.756
30 0.683 1.310 1.697 2.042 2.457 2.750
40 0.681 1.303 1.684 2.021 2.423 2.704
60 0.679 1.296 1.671 2.000 2.390 2.660
120 0.677 1.289 1.658 1.980 2.358 2.617
• Confidence interval for single mean
• From t-distribution
• when sample information n≤ 30
• From Z-distribution
• when sample information n > 30
Confidence interval estimate of mean In
case of two samples :
• ( ҧ
𝑥1 − ҧ
𝑥2) ± 𝑡𝛼
2
, 𝑣
𝑠𝑝
1
𝑛1
+
1
𝑛2
• ҧ
𝑥1 =mean of 1st sample
• ҧ
𝑥2 =mean of 2nd sample
•
𝛼
2
= 𝑠𝑎𝑚𝑒 𝑎𝑠 𝑖𝑛 𝑠𝑖𝑛𝑔𝑙𝑒 𝑚𝑒𝑎𝑛 𝑐𝑎𝑠𝑒
• V=1st sample number of observation +2nd sample number
of observation - 2
• 𝑠𝑝= pooled standard-deviation
For two random sample:
• 𝑆𝑝
2
=
1
𝑛1+𝑛2−2
σ𝑖
𝑛1
𝑥1𝑖 − ҧ
𝑥1
2 + σ𝑗
𝑛2
𝑥2𝑗 − ҧ
𝑥2
2
• 𝑠𝑝= 𝑆𝑝
2
• 𝑠𝑝=
1
𝑛1+𝑛2−2
σ𝑖
𝑛1
𝑥1𝑖 − ҧ
𝑥1
2 + σ𝑗
𝑛2
𝑥2𝑗 − ҧ
𝑥1
2
V=𝑛1 + 𝑛2 − 2
Problem 2nd:
• Given that
• ҧ
𝑥1 = 75, 𝑛1 = 9, σ 𝑥1𝑖 − ҧ
𝑥1
2
= 1482;
• ҧ
𝑥2 = 60, 𝑛2 = 16, σ 𝑥2𝑗 − ҧ
𝑥2
2
= 1830;
And assuming that the two samples were randomly
selected from population in which equal variance, calculate
CI for 80%
• Solution:
• 𝑠𝑝=
1
𝑛1+𝑛2−2
σ𝑖
𝑛1
𝑥1𝑖 − ҧ
𝑥1
2 + σ𝑗
𝑛2
𝑥2𝑗 − ҧ
𝑥1
2
• 𝑠𝑝 =
1
9+16−2
1482 + 1830 = 144 = 12
• V=𝑛1 + 𝑛2 − 2
• V=9+16-2=23
• Alpha=1-0.80 = 0.20
•
𝛼
2
=
0.20
2
=0.10
• 𝑡0.10 23 → 𝑓𝑟𝑜𝑚 𝑡ℎ𝑒 𝑡 𝑡𝑎𝑏𝑙𝑒 = 1.32
• ҧ
𝑥1 − ҧ
𝑥2=75-60=15
• Substituting these values, we obtain:
• ( ҧ
𝑥1 − ҧ
𝑥2) ± 𝑡𝛼
2
, 𝑣 𝑠𝑝
1
𝑛1
+
1
𝑛2
15±(1.32)(12)
1
9
+
1
16
15±15.84*(0.4167)
15+15.84*0.4167=21.60 Upper limit
15-15.84*0.4167=8.3994 Lower Limit
(8.3994 , 21.60)
Assignment :
Consider the data: Find Confidence interval for two mean in case of 80% and for 95%
1st
sample
x1
10 14 16 8 15 17 19 21 13
2nd
sample
X2
12 13 19 15 8 15 16 18 8
• Solution:
• 𝑠𝑝 = 232.18 = 15.237
• V=𝑛1 + 𝑛2 − 2
• V=9+9-2
• Alpha=1-0.95 = 0.05
•
𝛼
2
=
0.050
2
=0.025
• 𝑡0.025 16 → 𝑓𝑟𝑜𝑚 𝑡ℎ𝑒 𝑡 𝑡𝑎𝑏𝑙𝑒 =2.120
• ( ҧ
𝑥1 − ҧ
𝑥2) ± 𝑡𝛼
2
, 𝑣
𝑠𝑝
1
𝑛1
+
1
𝑛2
• 9 ± 2.120(15.237*0.4711)
• 9 ± 9.597187
• 9+ 9.597187 for upper limit 18.59719
• 9-9.597187 for lower limit -0.5971875

More Related Content

What's hot

Pearson product moment correlation
Pearson product moment correlationPearson product moment correlation
Pearson product moment correlation
Sharlaine Ruth
 

What's hot (20)

Geometric Distribution
Geometric DistributionGeometric Distribution
Geometric Distribution
 
Introduction to sequences and series
Introduction to sequences and seriesIntroduction to sequences and series
Introduction to sequences and series
 
Student's T-test, Paired T-Test, ANOVA & Proportionate Test
Student's T-test, Paired T-Test, ANOVA & Proportionate TestStudent's T-test, Paired T-Test, ANOVA & Proportionate Test
Student's T-test, Paired T-Test, ANOVA & Proportionate Test
 
Master statistics 1#10 Empirical Rule of Standard Deviation
Master statistics 1#10 Empirical Rule of Standard Deviation Master statistics 1#10 Empirical Rule of Standard Deviation
Master statistics 1#10 Empirical Rule of Standard Deviation
 
Factor Analysis, Assumptions. Exploratory Factor Analysis and Confirmatory Fa...
Factor Analysis, Assumptions. Exploratory Factor Analysis and Confirmatory Fa...Factor Analysis, Assumptions. Exploratory Factor Analysis and Confirmatory Fa...
Factor Analysis, Assumptions. Exploratory Factor Analysis and Confirmatory Fa...
 
Manova Report
Manova ReportManova Report
Manova Report
 
continuous probability distributions.ppt
continuous probability distributions.pptcontinuous probability distributions.ppt
continuous probability distributions.ppt
 
Normal probability distribution
Normal probability distributionNormal probability distribution
Normal probability distribution
 
Normal distribution
Normal distributionNormal distribution
Normal distribution
 
Introduction to t-tests (statistics)
Introduction to t-tests (statistics)Introduction to t-tests (statistics)
Introduction to t-tests (statistics)
 
Directional Hypothesis testing
Directional Hypothesis testing Directional Hypothesis testing
Directional Hypothesis testing
 
Binomial distribution
Binomial distributionBinomial distribution
Binomial distribution
 
Pearson product moment correlation
Pearson product moment correlationPearson product moment correlation
Pearson product moment correlation
 
Discrete Distribution.pptx
Discrete Distribution.pptxDiscrete Distribution.pptx
Discrete Distribution.pptx
 
Multiple linear regression
Multiple linear regressionMultiple linear regression
Multiple linear regression
 
Inter quartile range
Inter quartile rangeInter quartile range
Inter quartile range
 
The Normal Distribution
The Normal DistributionThe Normal Distribution
The Normal Distribution
 
Logistic Regression in Case-Control Study
Logistic Regression in Case-Control StudyLogistic Regression in Case-Control Study
Logistic Regression in Case-Control Study
 
Confidence Intervals
Confidence IntervalsConfidence Intervals
Confidence Intervals
 
Introduction to Statistics
Introduction to StatisticsIntroduction to Statistics
Introduction to Statistics
 

Similar to Statistical Inference.pdf

Normal distribution - Unitedworld School of Business
Normal distribution - Unitedworld School of BusinessNormal distribution - Unitedworld School of Business
Normal distribution - Unitedworld School of Business
Arnab Roy Chowdhury
 
Mean, median, and mode ug
Mean, median, and mode ugMean, median, and mode ug
Mean, median, and mode ug
AbhishekDas15
 

Similar to Statistical Inference.pdf (20)

AP Statistics - Confidence Intervals with Means - One Sample
AP Statistics - Confidence Intervals with Means - One SampleAP Statistics - Confidence Intervals with Means - One Sample
AP Statistics - Confidence Intervals with Means - One Sample
 
Lecture 03 Inferential Statistics 1
Lecture 03 Inferential Statistics 1Lecture 03 Inferential Statistics 1
Lecture 03 Inferential Statistics 1
 
New Clustering-based Forecasting Method for Disaggregated End-consumer Electr...
New Clustering-based Forecasting Method for Disaggregated End-consumer Electr...New Clustering-based Forecasting Method for Disaggregated End-consumer Electr...
New Clustering-based Forecasting Method for Disaggregated End-consumer Electr...
 
Power_flow..نظم_قدرة.pptx
Power_flow..نظم_قدرة.pptxPower_flow..نظم_قدرة.pptx
Power_flow..نظم_قدرة.pptx
 
Normal distri
Normal distriNormal distri
Normal distri
 
Sampling
SamplingSampling
Sampling
 
scical manual fx-250HC
scical manual fx-250HCscical manual fx-250HC
scical manual fx-250HC
 
Normal distribution
Normal distribution  Normal distribution
Normal distribution
 
Business statistics solved numericals
Business statistics solved numericalsBusiness statistics solved numericals
Business statistics solved numericals
 
Tarea 2 hidraulica iii-cabrera arias roberto alejandro
Tarea 2 hidraulica iii-cabrera arias roberto alejandroTarea 2 hidraulica iii-cabrera arias roberto alejandro
Tarea 2 hidraulica iii-cabrera arias roberto alejandro
 
The sexagesimal foundation of mathematics
The sexagesimal foundation of mathematicsThe sexagesimal foundation of mathematics
The sexagesimal foundation of mathematics
 
Normal distribution - Unitedworld School of Business
Normal distribution - Unitedworld School of BusinessNormal distribution - Unitedworld School of Business
Normal distribution - Unitedworld School of Business
 
Data Analysis.pptx
Data Analysis.pptxData Analysis.pptx
Data Analysis.pptx
 
EJERCICIOS RESUELTOS DE LOGARITMOS
EJERCICIOS RESUELTOS DE LOGARITMOSEJERCICIOS RESUELTOS DE LOGARITMOS
EJERCICIOS RESUELTOS DE LOGARITMOS
 
Mean, median, and mode ug
Mean, median, and mode ugMean, median, and mode ug
Mean, median, and mode ug
 
Regression Analysis , A statistical approch to analysis data.pptx
Regression Analysis , A statistical  approch to analysis data.pptxRegression Analysis , A statistical  approch to analysis data.pptx
Regression Analysis , A statistical approch to analysis data.pptx
 
Introduction to Probability and Statistics 13th Edition Mendenhall Solutions ...
Introduction to Probability and Statistics 13th Edition Mendenhall Solutions ...Introduction to Probability and Statistics 13th Edition Mendenhall Solutions ...
Introduction to Probability and Statistics 13th Edition Mendenhall Solutions ...
 
Douglas C. Montgomery - Design and Analysis of Experiments, solutions manual.pdf
Douglas C. Montgomery - Design and Analysis of Experiments, solutions manual.pdfDouglas C. Montgomery - Design and Analysis of Experiments, solutions manual.pdf
Douglas C. Montgomery - Design and Analysis of Experiments, solutions manual.pdf
 
Tachometers.pptx
Tachometers.pptxTachometers.pptx
Tachometers.pptx
 
Mpc 006 - 02-03 partial and multiple correlation
Mpc 006 - 02-03 partial and multiple correlationMpc 006 - 02-03 partial and multiple correlation
Mpc 006 - 02-03 partial and multiple correlation
 

More from MuhammadFaizan389

High Performance Liquid Chromatography.pdf
High Performance Liquid Chromatography.pdfHigh Performance Liquid Chromatography.pdf
High Performance Liquid Chromatography.pdf
MuhammadFaizan389
 

More from MuhammadFaizan389 (20)

Introduction & Classification of Biofuels.pdf
Introduction & Classification of Biofuels.pdfIntroduction & Classification of Biofuels.pdf
Introduction & Classification of Biofuels.pdf
 
Adsorption Chromatography Assignment.pdf
Adsorption Chromatography Assignment.pdfAdsorption Chromatography Assignment.pdf
Adsorption Chromatography Assignment.pdf
 
Analytical Page# 36 to 42.pdf
Analytical Page# 36 to 42.pdfAnalytical Page# 36 to 42.pdf
Analytical Page# 36 to 42.pdf
 
Analytical Page# 50 to 56.pdf
Analytical Page# 50 to 56.pdfAnalytical Page# 50 to 56.pdf
Analytical Page# 50 to 56.pdf
 
Coulmn & Ion Exchange Chromatography.pdf
Coulmn & Ion Exchange Chromatography.pdfCoulmn & Ion Exchange Chromatography.pdf
Coulmn & Ion Exchange Chromatography.pdf
 
Detectors used in HPLC, GC & I.E Chromatography.pdf
Detectors used in HPLC, GC & I.E Chromatography.pdfDetectors used in HPLC, GC & I.E Chromatography.pdf
Detectors used in HPLC, GC & I.E Chromatography.pdf
 
Gas Chromatography.pptx
Gas Chromatography.pptxGas Chromatography.pptx
Gas Chromatography.pptx
 
Gas Chromatogrpahy.pdf
Gas Chromatogrpahy.pdfGas Chromatogrpahy.pdf
Gas Chromatogrpahy.pdf
 
High Performance Liquid Chromatography.pdf
High Performance Liquid Chromatography.pdfHigh Performance Liquid Chromatography.pdf
High Performance Liquid Chromatography.pdf
 
Introduction to Chromatography.pdf
Introduction to Chromatography.pdfIntroduction to Chromatography.pdf
Introduction to Chromatography.pdf
 
Ion Chromatography.pptx
Ion Chromatography.pptxIon Chromatography.pptx
Ion Chromatography.pptx
 
Theoretical Consideration of Chromatography.pdf
Theoretical Consideration of Chromatography.pdfTheoretical Consideration of Chromatography.pdf
Theoretical Consideration of Chromatography.pdf
 
Traditional Methods of Alcohol.pdf
Traditional Methods of Alcohol.pdfTraditional Methods of Alcohol.pdf
Traditional Methods of Alcohol.pdf
 
Syngas.pdf
Syngas.pdfSyngas.pdf
Syngas.pdf
 
Photovoltaic Cells.pptx
Photovoltaic Cells.pptxPhotovoltaic Cells.pptx
Photovoltaic Cells.pptx
 
Hydroelectric Power.pptx
Hydroelectric Power.pptxHydroelectric Power.pptx
Hydroelectric Power.pptx
 
Fuel Cells.pptx
Fuel Cells.pptxFuel Cells.pptx
Fuel Cells.pptx
 
Fuel Cell.pdf
Fuel Cell.pdfFuel Cell.pdf
Fuel Cell.pdf
 
BioReactor.pptx
BioReactor.pptxBioReactor.pptx
BioReactor.pptx
 
Biomass.ppt
Biomass.pptBiomass.ppt
Biomass.ppt
 

Recently uploaded

一比一原版Birmingham毕业证伯明翰大学|学院毕业证成绩单如何办理
一比一原版Birmingham毕业证伯明翰大学|学院毕业证成绩单如何办理一比一原版Birmingham毕业证伯明翰大学|学院毕业证成绩单如何办理
一比一原版Birmingham毕业证伯明翰大学|学院毕业证成绩单如何办理
betoozp
 
USDA Loans in California: A Comprehensive Overview.pptx
USDA Loans in California: A Comprehensive Overview.pptxUSDA Loans in California: A Comprehensive Overview.pptx
USDA Loans in California: A Comprehensive Overview.pptx
marketing367770
 
US Economic Outlook - Being Decided - M Capital Group August 2021.pdf
US Economic Outlook - Being Decided - M Capital Group August 2021.pdfUS Economic Outlook - Being Decided - M Capital Group August 2021.pdf
US Economic Outlook - Being Decided - M Capital Group August 2021.pdf
pchutichetpong
 
what is the future of Pi Network currency.
what is the future of Pi Network currency.what is the future of Pi Network currency.
what is the future of Pi Network currency.
DOT TECH
 
NO1 Uk Rohani Baba In Karachi Bangali Baba Karachi Online Amil Baba WorldWide...
NO1 Uk Rohani Baba In Karachi Bangali Baba Karachi Online Amil Baba WorldWide...NO1 Uk Rohani Baba In Karachi Bangali Baba Karachi Online Amil Baba WorldWide...
NO1 Uk Rohani Baba In Karachi Bangali Baba Karachi Online Amil Baba WorldWide...
Amil baba
 
一比一原版Adelaide毕业证阿德莱德大学毕业证成绩单如何办理
一比一原版Adelaide毕业证阿德莱德大学毕业证成绩单如何办理一比一原版Adelaide毕业证阿德莱德大学毕业证成绩单如何办理
一比一原版Adelaide毕业证阿德莱德大学毕业证成绩单如何办理
zsewypy
 

Recently uploaded (20)

is it possible to sell pi network coin in 2024.
is it possible to sell pi network coin in 2024.is it possible to sell pi network coin in 2024.
is it possible to sell pi network coin in 2024.
 
Summary of financial results for 1Q2024
Summary of financial  results for 1Q2024Summary of financial  results for 1Q2024
Summary of financial results for 1Q2024
 
how can I sell my pi coins for cash in a pi APP
how can I sell my pi coins for cash in a pi APPhow can I sell my pi coins for cash in a pi APP
how can I sell my pi coins for cash in a pi APP
 
Introduction to Indian Financial System ()
Introduction to Indian Financial System ()Introduction to Indian Financial System ()
Introduction to Indian Financial System ()
 
一比一原版Birmingham毕业证伯明翰大学|学院毕业证成绩单如何办理
一比一原版Birmingham毕业证伯明翰大学|学院毕业证成绩单如何办理一比一原版Birmingham毕业证伯明翰大学|学院毕业证成绩单如何办理
一比一原版Birmingham毕业证伯明翰大学|学院毕业证成绩单如何办理
 
Falcon Invoice Discounting: Optimizing Returns with Minimal Risk
Falcon Invoice Discounting: Optimizing Returns with Minimal RiskFalcon Invoice Discounting: Optimizing Returns with Minimal Risk
Falcon Invoice Discounting: Optimizing Returns with Minimal Risk
 
USDA Loans in California: A Comprehensive Overview.pptx
USDA Loans in California: A Comprehensive Overview.pptxUSDA Loans in California: A Comprehensive Overview.pptx
USDA Loans in California: A Comprehensive Overview.pptx
 
Economics and Economic reasoning Chap. 1
Economics and Economic reasoning Chap. 1Economics and Economic reasoning Chap. 1
Economics and Economic reasoning Chap. 1
 
9th issue of our inhouse magazine Ingenious May 2024.pdf
9th issue of our inhouse magazine Ingenious May 2024.pdf9th issue of our inhouse magazine Ingenious May 2024.pdf
9th issue of our inhouse magazine Ingenious May 2024.pdf
 
how can I sell/buy bulk pi coins securely
how can I sell/buy bulk pi coins securelyhow can I sell/buy bulk pi coins securely
how can I sell/buy bulk pi coins securely
 
how can I sell my locked pi coins safety.
how can I sell my locked pi coins safety.how can I sell my locked pi coins safety.
how can I sell my locked pi coins safety.
 
US Economic Outlook - Being Decided - M Capital Group August 2021.pdf
US Economic Outlook - Being Decided - M Capital Group August 2021.pdfUS Economic Outlook - Being Decided - M Capital Group August 2021.pdf
US Economic Outlook - Being Decided - M Capital Group August 2021.pdf
 
Jio Financial service Multibagger 2024 from India stock Market
Jio Financial service  Multibagger 2024 from India stock MarketJio Financial service  Multibagger 2024 from India stock Market
Jio Financial service Multibagger 2024 from India stock Market
 
what is a pi whale and how to access one.
what is a pi whale and how to access one.what is a pi whale and how to access one.
what is a pi whale and how to access one.
 
what is the future of Pi Network currency.
what is the future of Pi Network currency.what is the future of Pi Network currency.
what is the future of Pi Network currency.
 
how can I transfer pi coins to someone in a different country.
how can I transfer pi coins to someone in a different country.how can I transfer pi coins to someone in a different country.
how can I transfer pi coins to someone in a different country.
 
how to sell pi coins in Canada, Uk and Australia
how to sell pi coins in Canada, Uk and Australiahow to sell pi coins in Canada, Uk and Australia
how to sell pi coins in Canada, Uk and Australia
 
when officially can i withdraw my pi Network coins.
when officially can i withdraw my pi Network coins.when officially can i withdraw my pi Network coins.
when officially can i withdraw my pi Network coins.
 
NO1 Uk Rohani Baba In Karachi Bangali Baba Karachi Online Amil Baba WorldWide...
NO1 Uk Rohani Baba In Karachi Bangali Baba Karachi Online Amil Baba WorldWide...NO1 Uk Rohani Baba In Karachi Bangali Baba Karachi Online Amil Baba WorldWide...
NO1 Uk Rohani Baba In Karachi Bangali Baba Karachi Online Amil Baba WorldWide...
 
一比一原版Adelaide毕业证阿德莱德大学毕业证成绩单如何办理
一比一原版Adelaide毕业证阿德莱德大学毕业证成绩单如何办理一比一原版Adelaide毕业证阿德莱德大学毕业证成绩单如何办理
一比一原版Adelaide毕业证阿德莱德大学毕业证成绩单如何办理
 

Statistical Inference.pdf

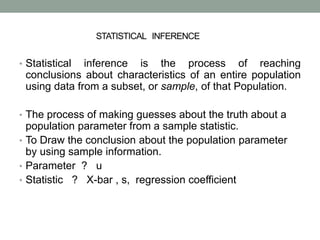
  • 1. • Statistical inference is the process of reaching conclusions about characteristics of an entire population using data from a subset, or sample, of that Population. • The process of making guesses about the truth about a population parameter from a sample statistic. • To Draw the conclusion about the population parameter by using sample information. • Parameter ? u • Statistic ? X-bar , s, regression coefficient STATISTICAL INFERENCE
  • 2. STATISTICAL INFERENCE Divided into two branches Estimation of parameters Testing of hypothesis
  • 3. Problem 1st: C.I for single mean • The masses, in grams, of thirteen ball bearings taken at random from a batch are • Calculate a 95% C.I for the mean mass of the population. Solution: Mean= σ 𝒙 𝒏 = 𝟑𝟏𝟒.𝟕 𝟏𝟑 = 𝟐𝟒. 𝟐𝟏 𝒔 = σ(𝑥𝑖 − ഥ 𝒙)𝟐 𝒏 − 𝟏 = 𝟑. 𝟏𝟐 = 𝟏. 𝟕𝟕 , 𝒗 = 𝒏 − 𝟏 = 𝟏𝟑 − 𝟏 = 𝟏𝟐 21.4 23.1 25.9 23.4 24.5 25.0 25.0 22.5 26.9 26.4 25.8 23.2 21.9
  • 4. • ഥ 𝑥 ±𝑡𝜕/2v 𝑠 𝑛 • Alpha =1- level of confidence • Alpha=1-0.95=0.05 • V=n-1= 13-1=12 𝟐𝟒. 𝟐𝟏 ± 𝒕𝟎.𝟎𝟓 𝟐 𝒗 𝟏. 𝟕𝟕 𝟏𝟑 𝒕𝟎.𝟎𝟐𝟓 𝟏𝟐 = 𝟐. 𝟏𝟕𝟗 → (From the t-table) 𝟐𝟒. 𝟐𝟏 ± 𝟐. 𝟏𝟕𝟗 𝟏. 𝟕𝟕 𝟏𝟑 24.21+2.179(0.49)=25.28 Upper-limit 24.21-2.179(0.49)=23.14 Lower-limit At 95% Confidence interval
  • 5. PERCENTAGE POINT OF STUDENT'S t-DISTRIBUTION Alpha d.f. 0.250 0.100 0.050 0.025 0.0125 0.005 1 1.000 3.078 6.314 12.706 31.821 63.657 2 0.816 1.886 2.920 4.303 6.965 9.925 3 0.765 1.638 2.353 3.182 4.541 5.841 4 0.741 1.533 2.132 2.776 3.747 4.604 5 0.727 1.476 2.015 2.571 3.365 4.032 6 0.718 1.440 1.943 2.447 3.143 3.707 7 0.711 1.415 1.895 2.365 2.998 3.499 8 0.706 1.397 1.860 2.306 2.896 3.355 9 0.703 1.383 1.833 2.262 2.821 3.250 10 0.700 1.372 1.812 2.228 2.764 3.169 11 0.697 1.363 1.796 2.201 2.718 3.106 12 0.695 1.356 1.782 2.179 2.681 3.055 13 0.694 1.350 1.771 2.160 2.650 3.012 14 0.692 1.345 1.761 2.145 2.624 2.977 15 0.691 1.341 1.753 2.131 2.602 2.947 16 0.690 1.337 1.746 2.120 2.583 2.921 17 0.689 1.333 1.740 2.110 2.567 2.898 18 0.688 1.330 1.734 2.101 2.552 2.878 19 0.688 1.328 1.729 2.093 2.539 2.861 20 0.687 1.325 1.725 2.086 2.528 2.845 21 0.686 1.323 1.721 2.080 2.518 2.831 22 0.686 1.321 1.717 2.074 2.508 2.819 23 0.685 1.319 1.714 2.069 2.500 2.807 24 0.685 1.318 1.711 2.064 2.492 2.797 25 0.684 1.316 1.708 2.060 2.485 2.787 26 0.684 1.315 1.706 2.056 2.479 2.779 27 0.684 1.314 1.703 2.052 2.473 2.771 28 0.683 1.313 1.701 2.048 2.467 2.763 29 0.683 1.311 1.699 2.045 2.462 2.756 30 0.683 1.310 1.697 2.042 2.457 2.750 40 0.681 1.303 1.684 2.021 2.423 2.704 60 0.679 1.296 1.671 2.000 2.390 2.660 120 0.677 1.289 1.658 1.980 2.358 2.617
  • 6. • Confidence interval for single mean • From t-distribution • when sample information n≤ 30 • From Z-distribution • when sample information n > 30
  • 7. Confidence interval estimate of mean In case of two samples : • ( ҧ 𝑥1 − ҧ 𝑥2) ± 𝑡𝛼 2 , 𝑣 𝑠𝑝 1 𝑛1 + 1 𝑛2 • ҧ 𝑥1 =mean of 1st sample • ҧ 𝑥2 =mean of 2nd sample • 𝛼 2 = 𝑠𝑎𝑚𝑒 𝑎𝑠 𝑖𝑛 𝑠𝑖𝑛𝑔𝑙𝑒 𝑚𝑒𝑎𝑛 𝑐𝑎𝑠𝑒 • V=1st sample number of observation +2nd sample number of observation - 2 • 𝑠𝑝= pooled standard-deviation
  • 8. For two random sample: • 𝑆𝑝 2 = 1 𝑛1+𝑛2−2 σ𝑖 𝑛1 𝑥1𝑖 − ҧ 𝑥1 2 + σ𝑗 𝑛2 𝑥2𝑗 − ҧ 𝑥2 2 • 𝑠𝑝= 𝑆𝑝 2 • 𝑠𝑝= 1 𝑛1+𝑛2−2 σ𝑖 𝑛1 𝑥1𝑖 − ҧ 𝑥1 2 + σ𝑗 𝑛2 𝑥2𝑗 − ҧ 𝑥1 2 V=𝑛1 + 𝑛2 − 2
  • 9. Problem 2nd: • Given that • ҧ 𝑥1 = 75, 𝑛1 = 9, σ 𝑥1𝑖 − ҧ 𝑥1 2 = 1482; • ҧ 𝑥2 = 60, 𝑛2 = 16, σ 𝑥2𝑗 − ҧ 𝑥2 2 = 1830; And assuming that the two samples were randomly selected from population in which equal variance, calculate CI for 80%
  • 10. • Solution: • 𝑠𝑝= 1 𝑛1+𝑛2−2 σ𝑖 𝑛1 𝑥1𝑖 − ҧ 𝑥1 2 + σ𝑗 𝑛2 𝑥2𝑗 − ҧ 𝑥1 2 • 𝑠𝑝 = 1 9+16−2 1482 + 1830 = 144 = 12 • V=𝑛1 + 𝑛2 − 2 • V=9+16-2=23 • Alpha=1-0.80 = 0.20 • 𝛼 2 = 0.20 2 =0.10 • 𝑡0.10 23 → 𝑓𝑟𝑜𝑚 𝑡ℎ𝑒 𝑡 𝑡𝑎𝑏𝑙𝑒 = 1.32 • ҧ 𝑥1 − ҧ 𝑥2=75-60=15
  • 11. • Substituting these values, we obtain: • ( ҧ 𝑥1 − ҧ 𝑥2) ± 𝑡𝛼 2 , 𝑣 𝑠𝑝 1 𝑛1 + 1 𝑛2 15±(1.32)(12) 1 9 + 1 16 15±15.84*(0.4167) 15+15.84*0.4167=21.60 Upper limit 15-15.84*0.4167=8.3994 Lower Limit (8.3994 , 21.60)
  • 12. Assignment : Consider the data: Find Confidence interval for two mean in case of 80% and for 95% 1st sample x1 10 14 16 8 15 17 19 21 13 2nd sample X2 12 13 19 15 8 15 16 18 8
  • 13. • Solution: • 𝑠𝑝 = 232.18 = 15.237 • V=𝑛1 + 𝑛2 − 2 • V=9+9-2 • Alpha=1-0.95 = 0.05 • 𝛼 2 = 0.050 2 =0.025 • 𝑡0.025 16 → 𝑓𝑟𝑜𝑚 𝑡ℎ𝑒 𝑡 𝑡𝑎𝑏𝑙𝑒 =2.120 • ( ҧ 𝑥1 − ҧ 𝑥2) ± 𝑡𝛼 2 , 𝑣 𝑠𝑝 1 𝑛1 + 1 𝑛2 • 9 ± 2.120(15.237*0.4711) • 9 ± 9.597187 • 9+ 9.597187 for upper limit 18.59719 • 9-9.597187 for lower limit -0.5971875