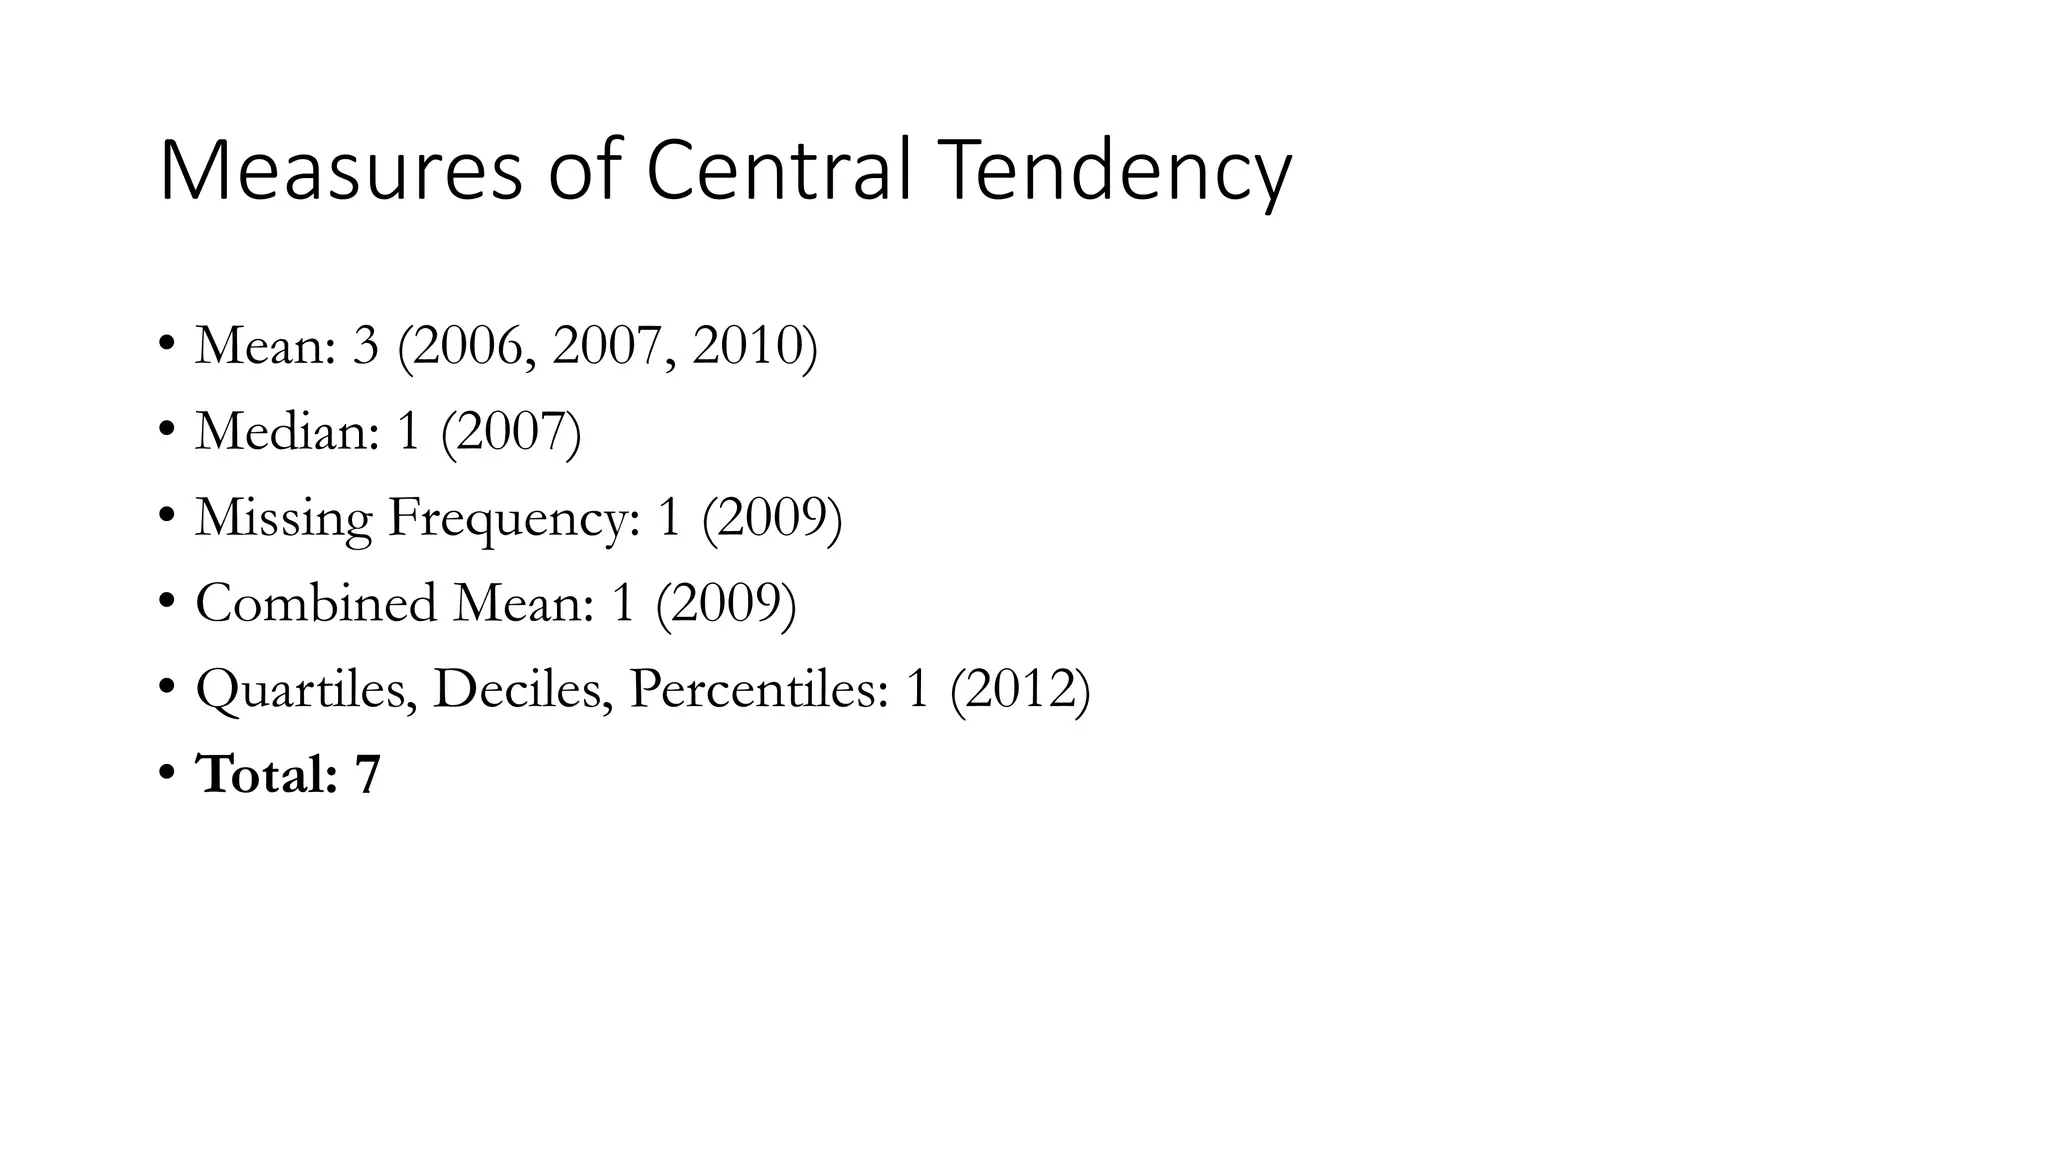
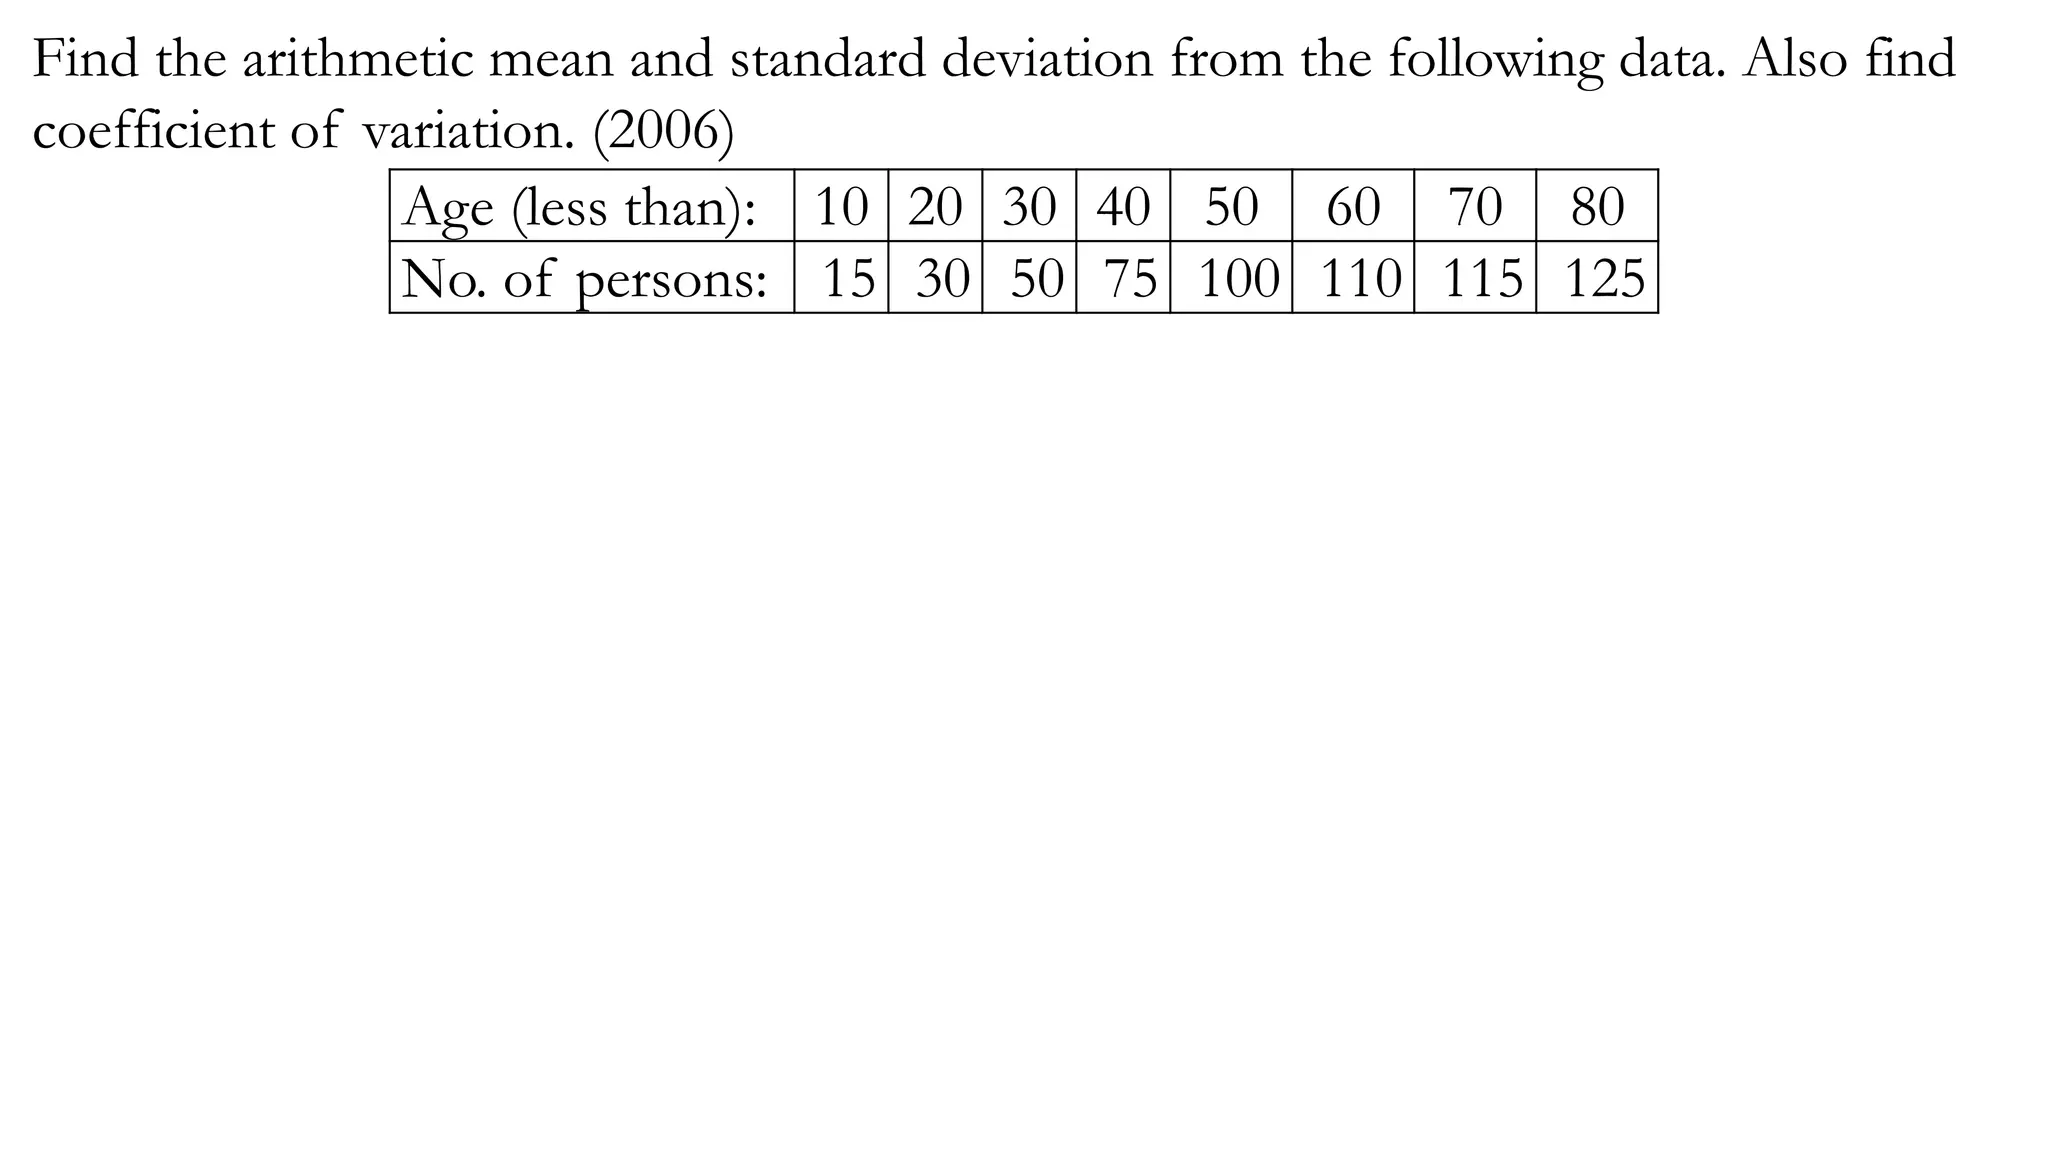
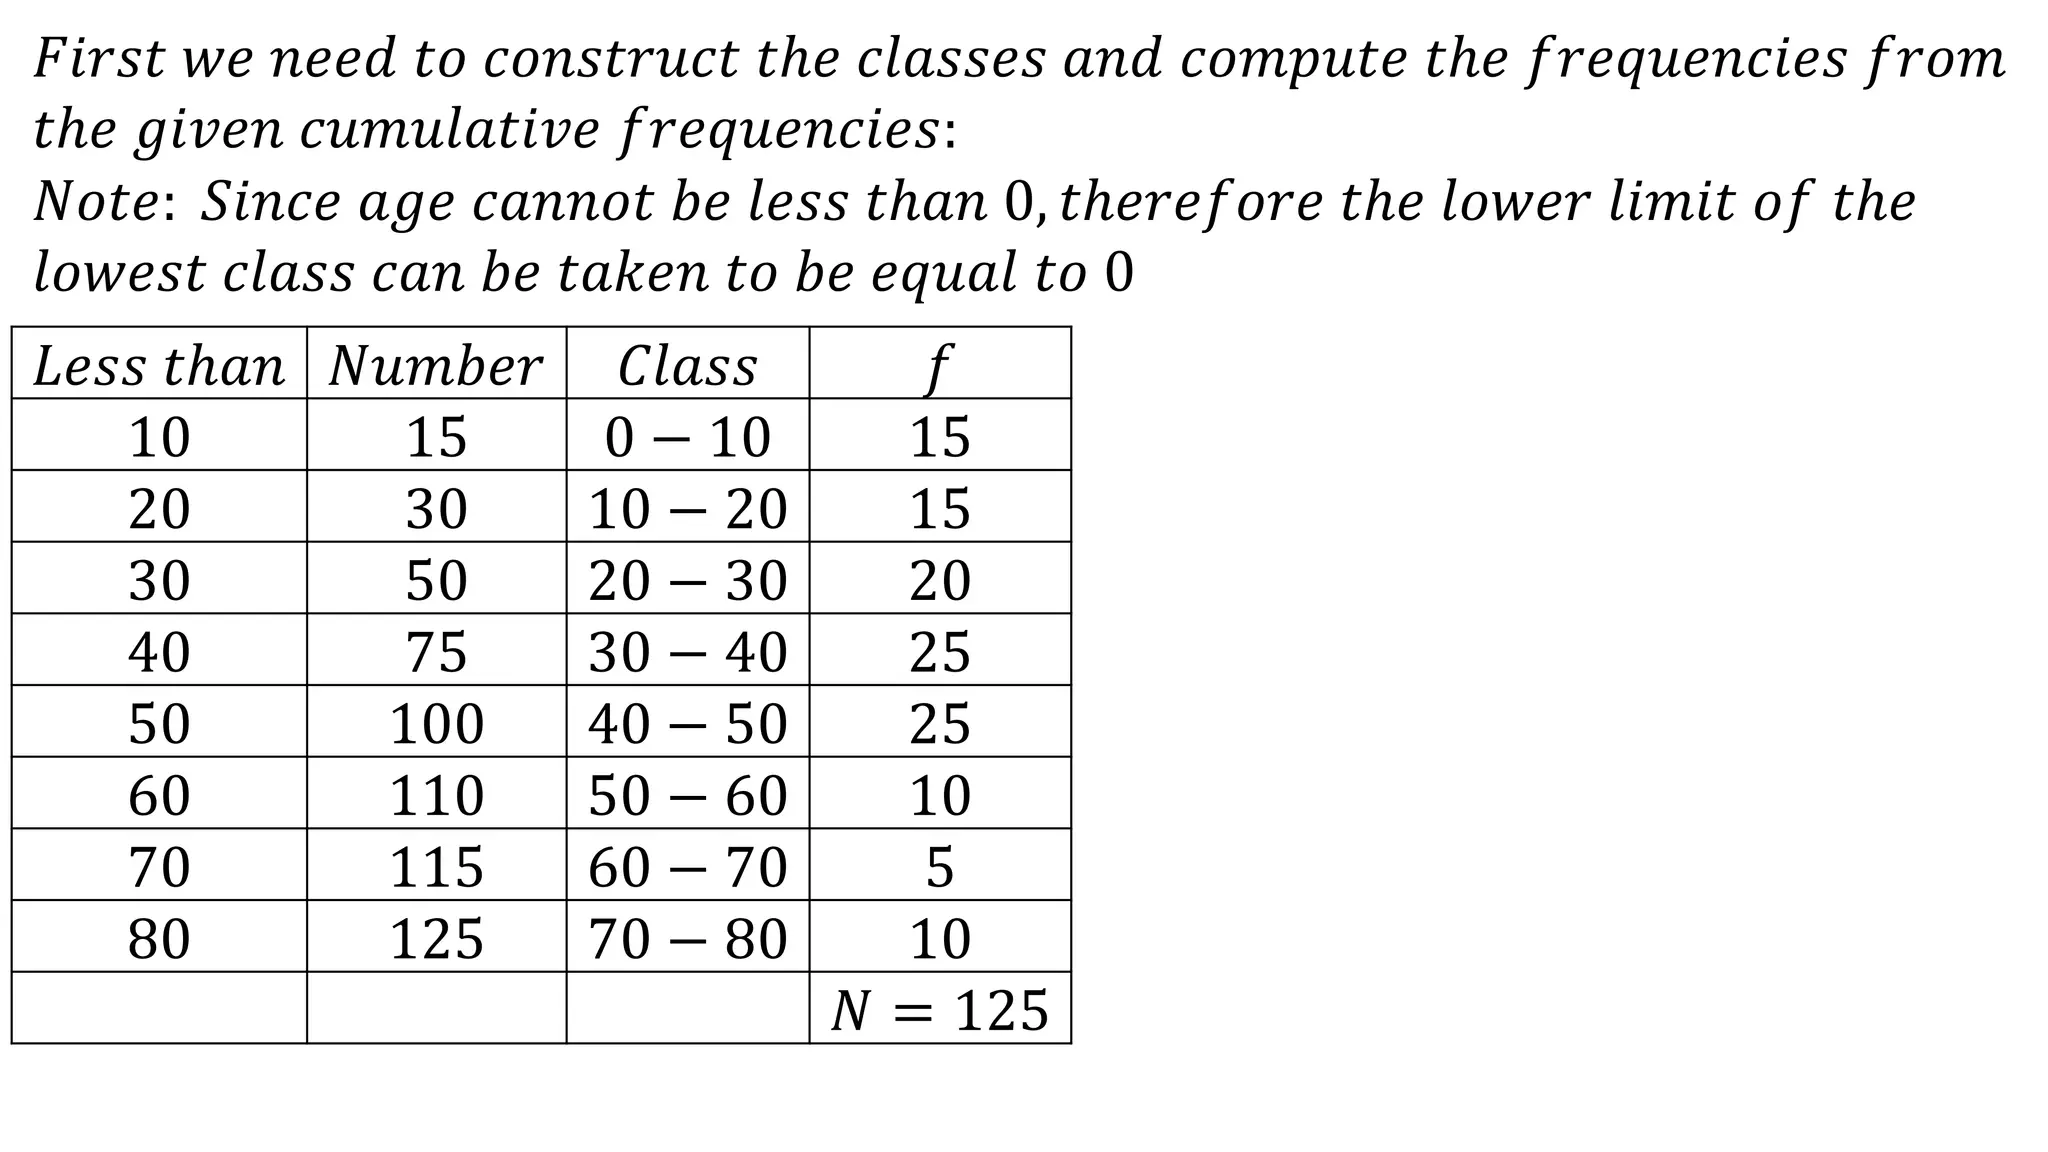
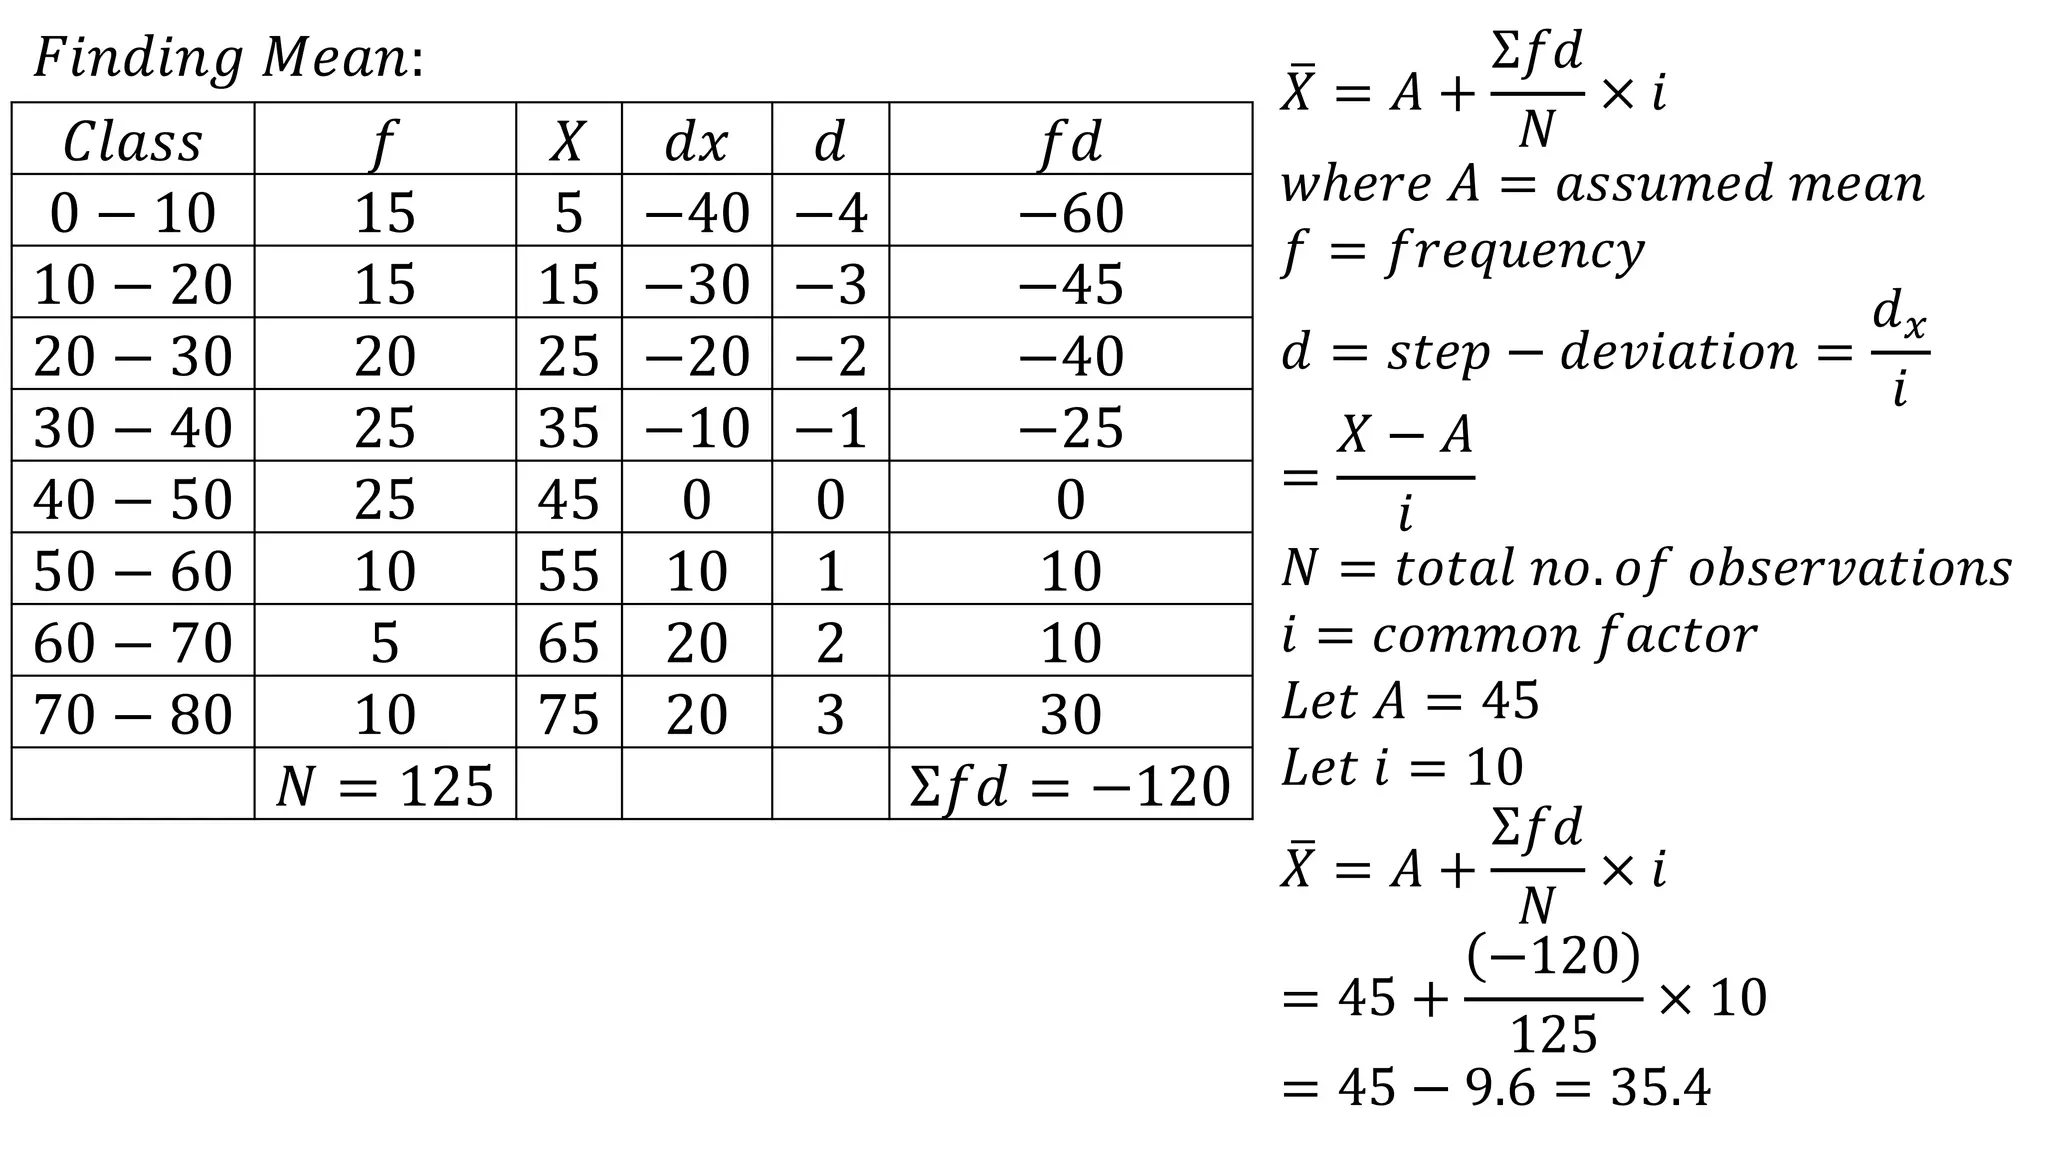
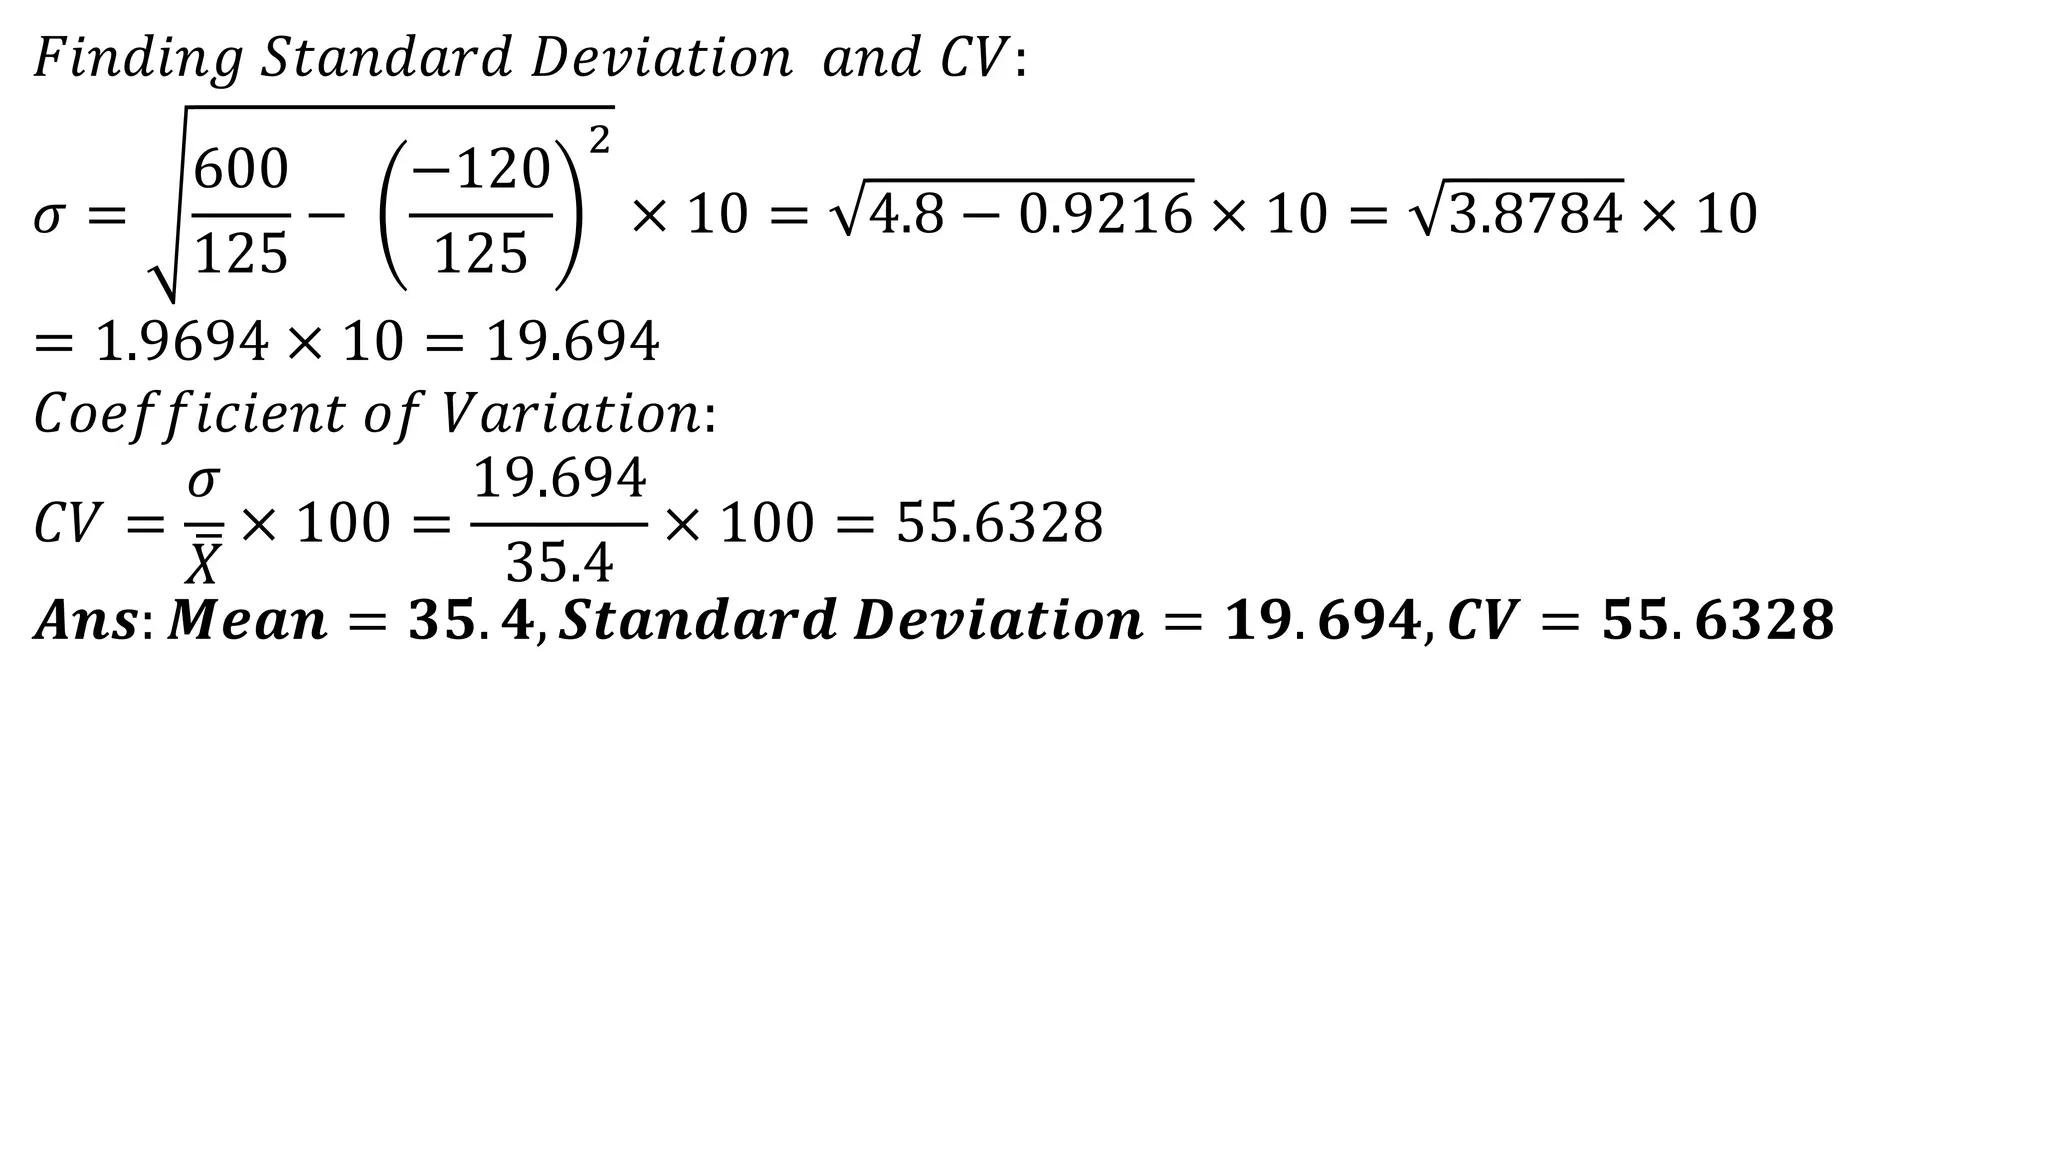
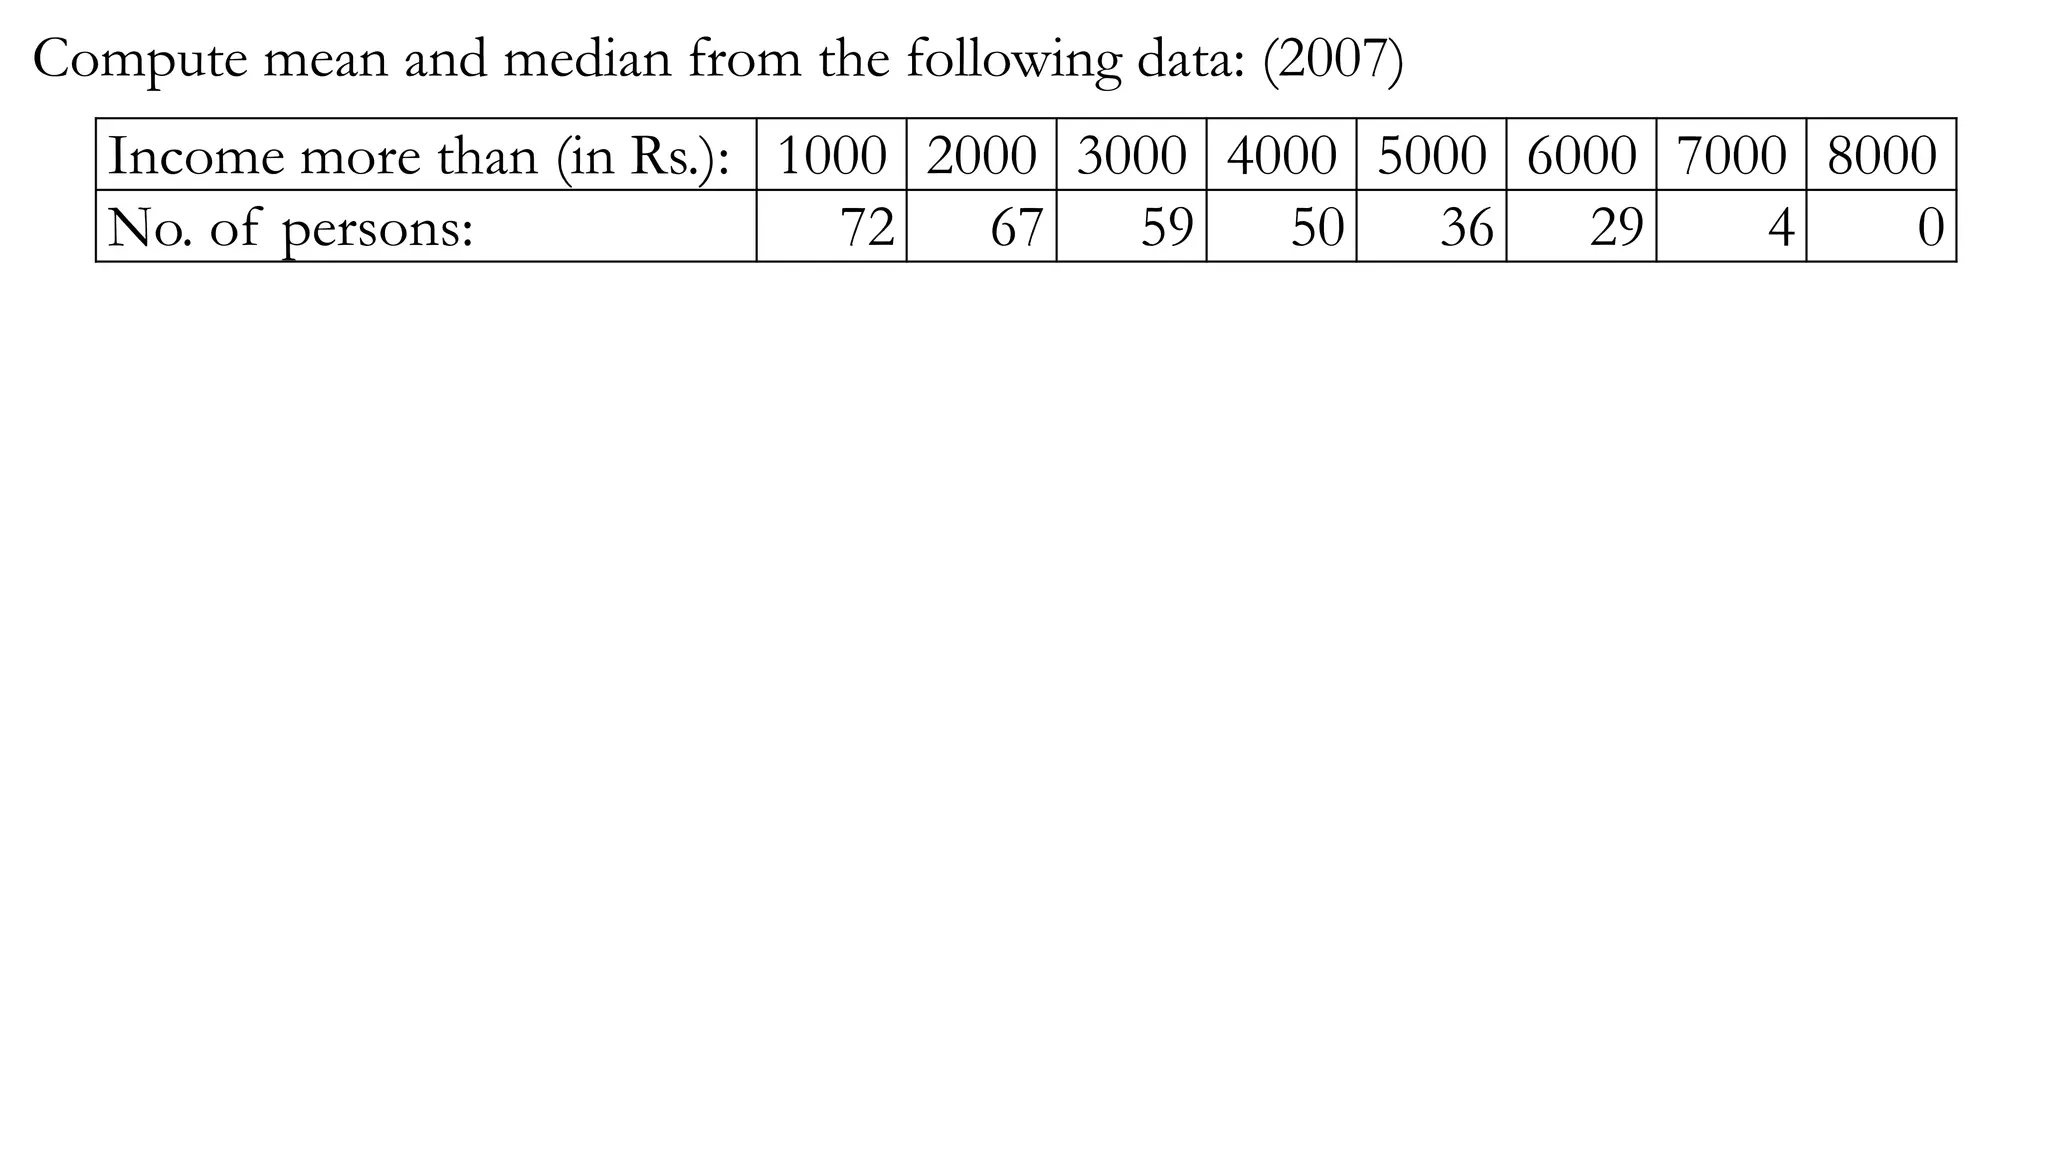
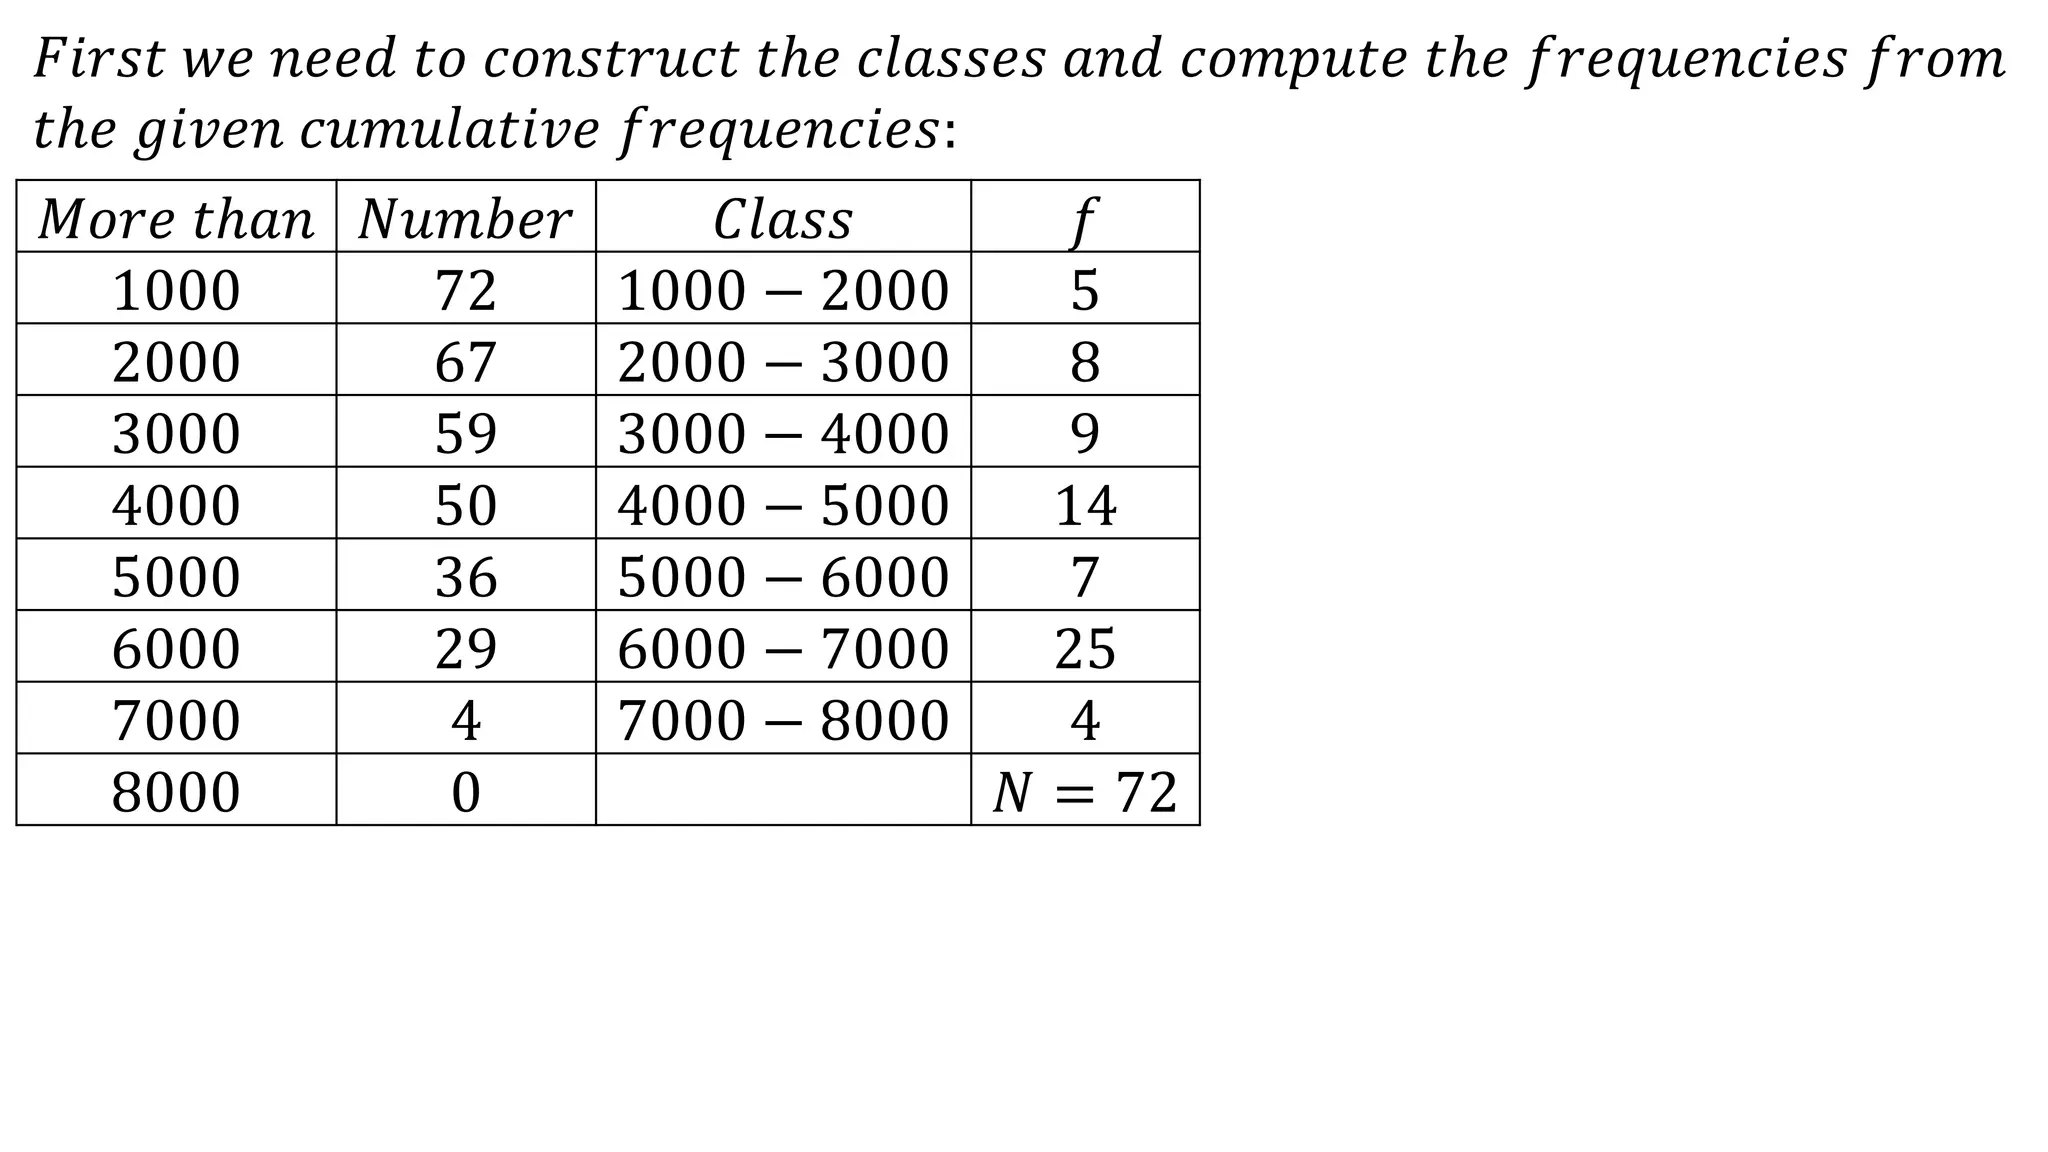
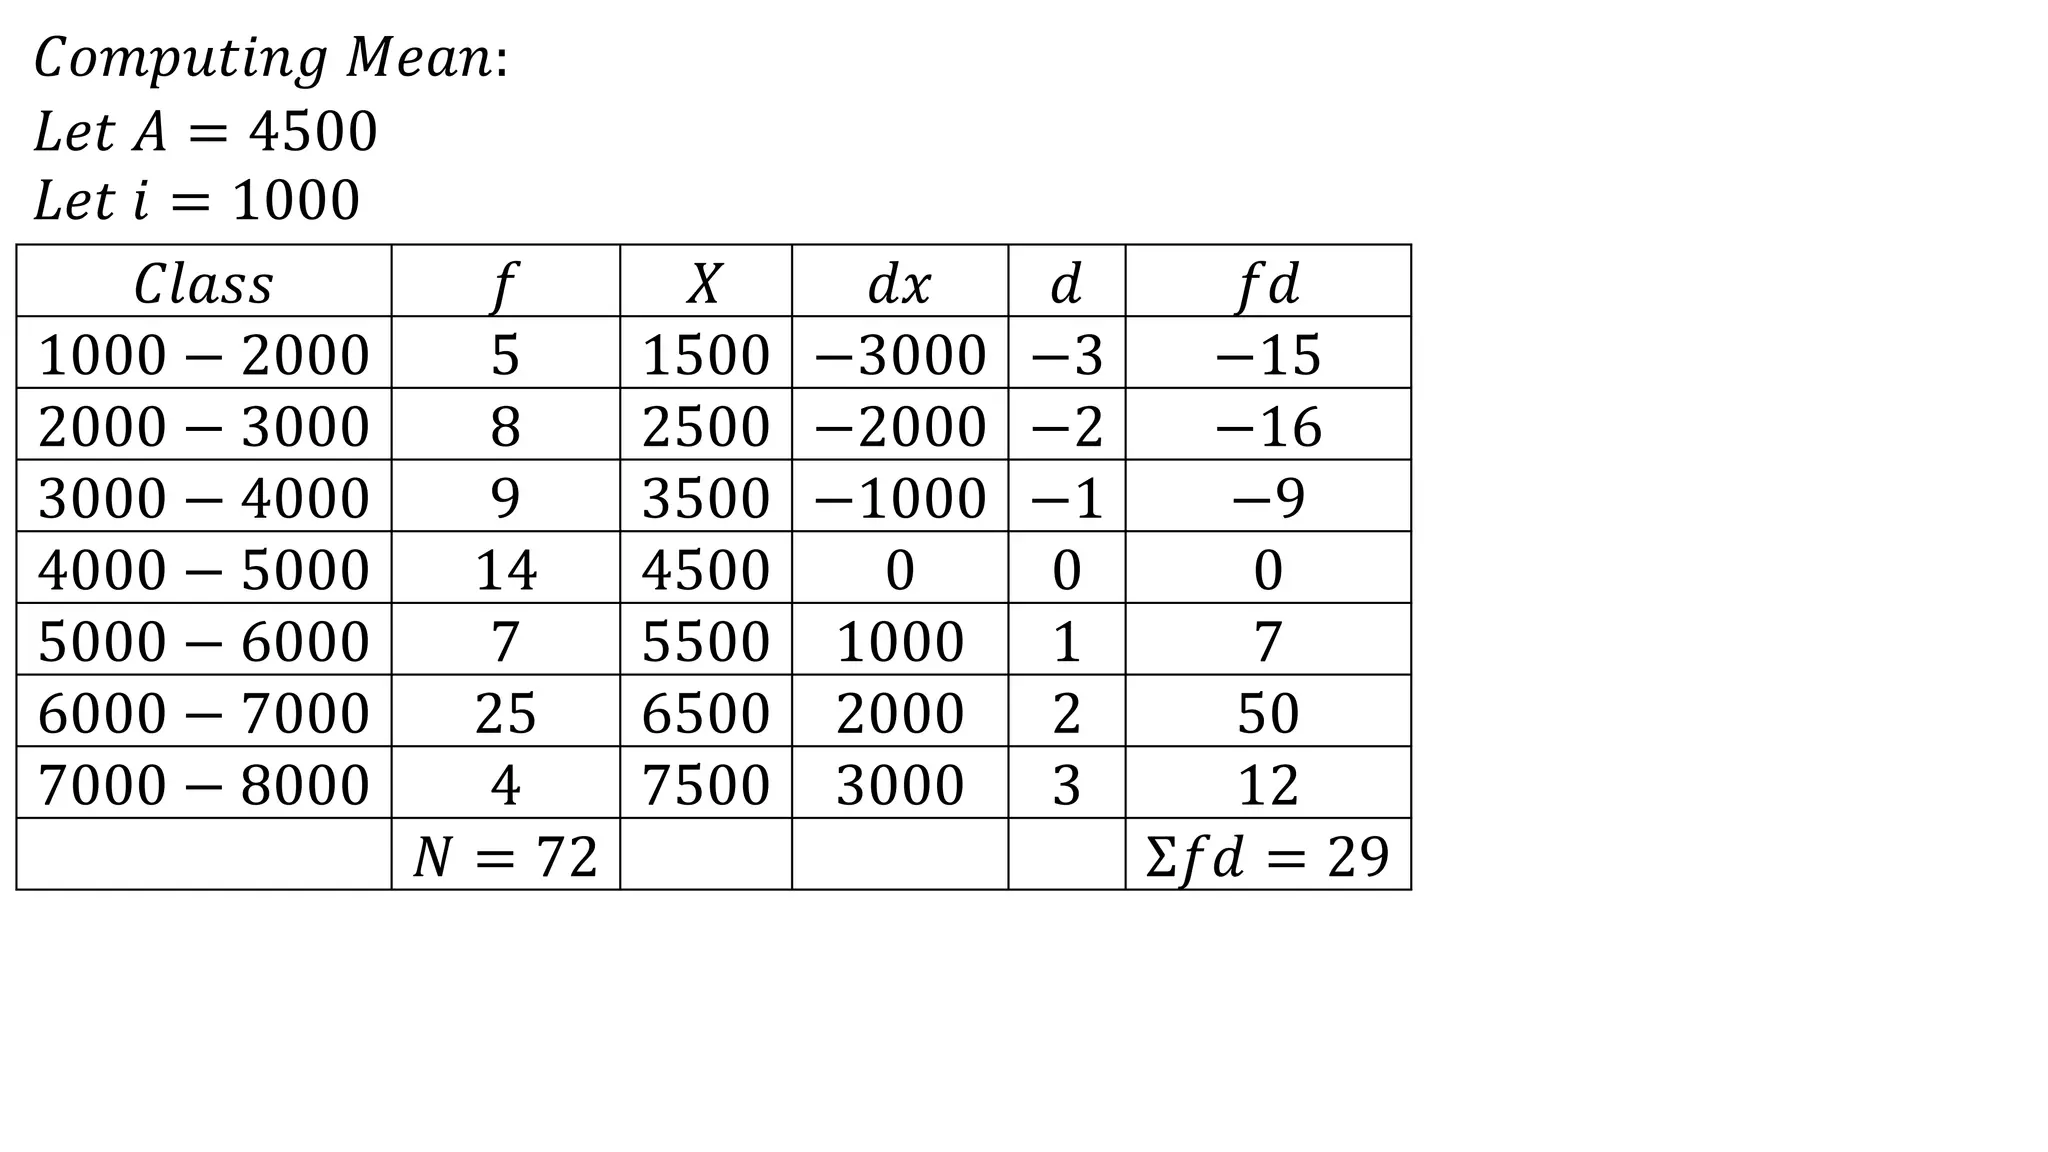
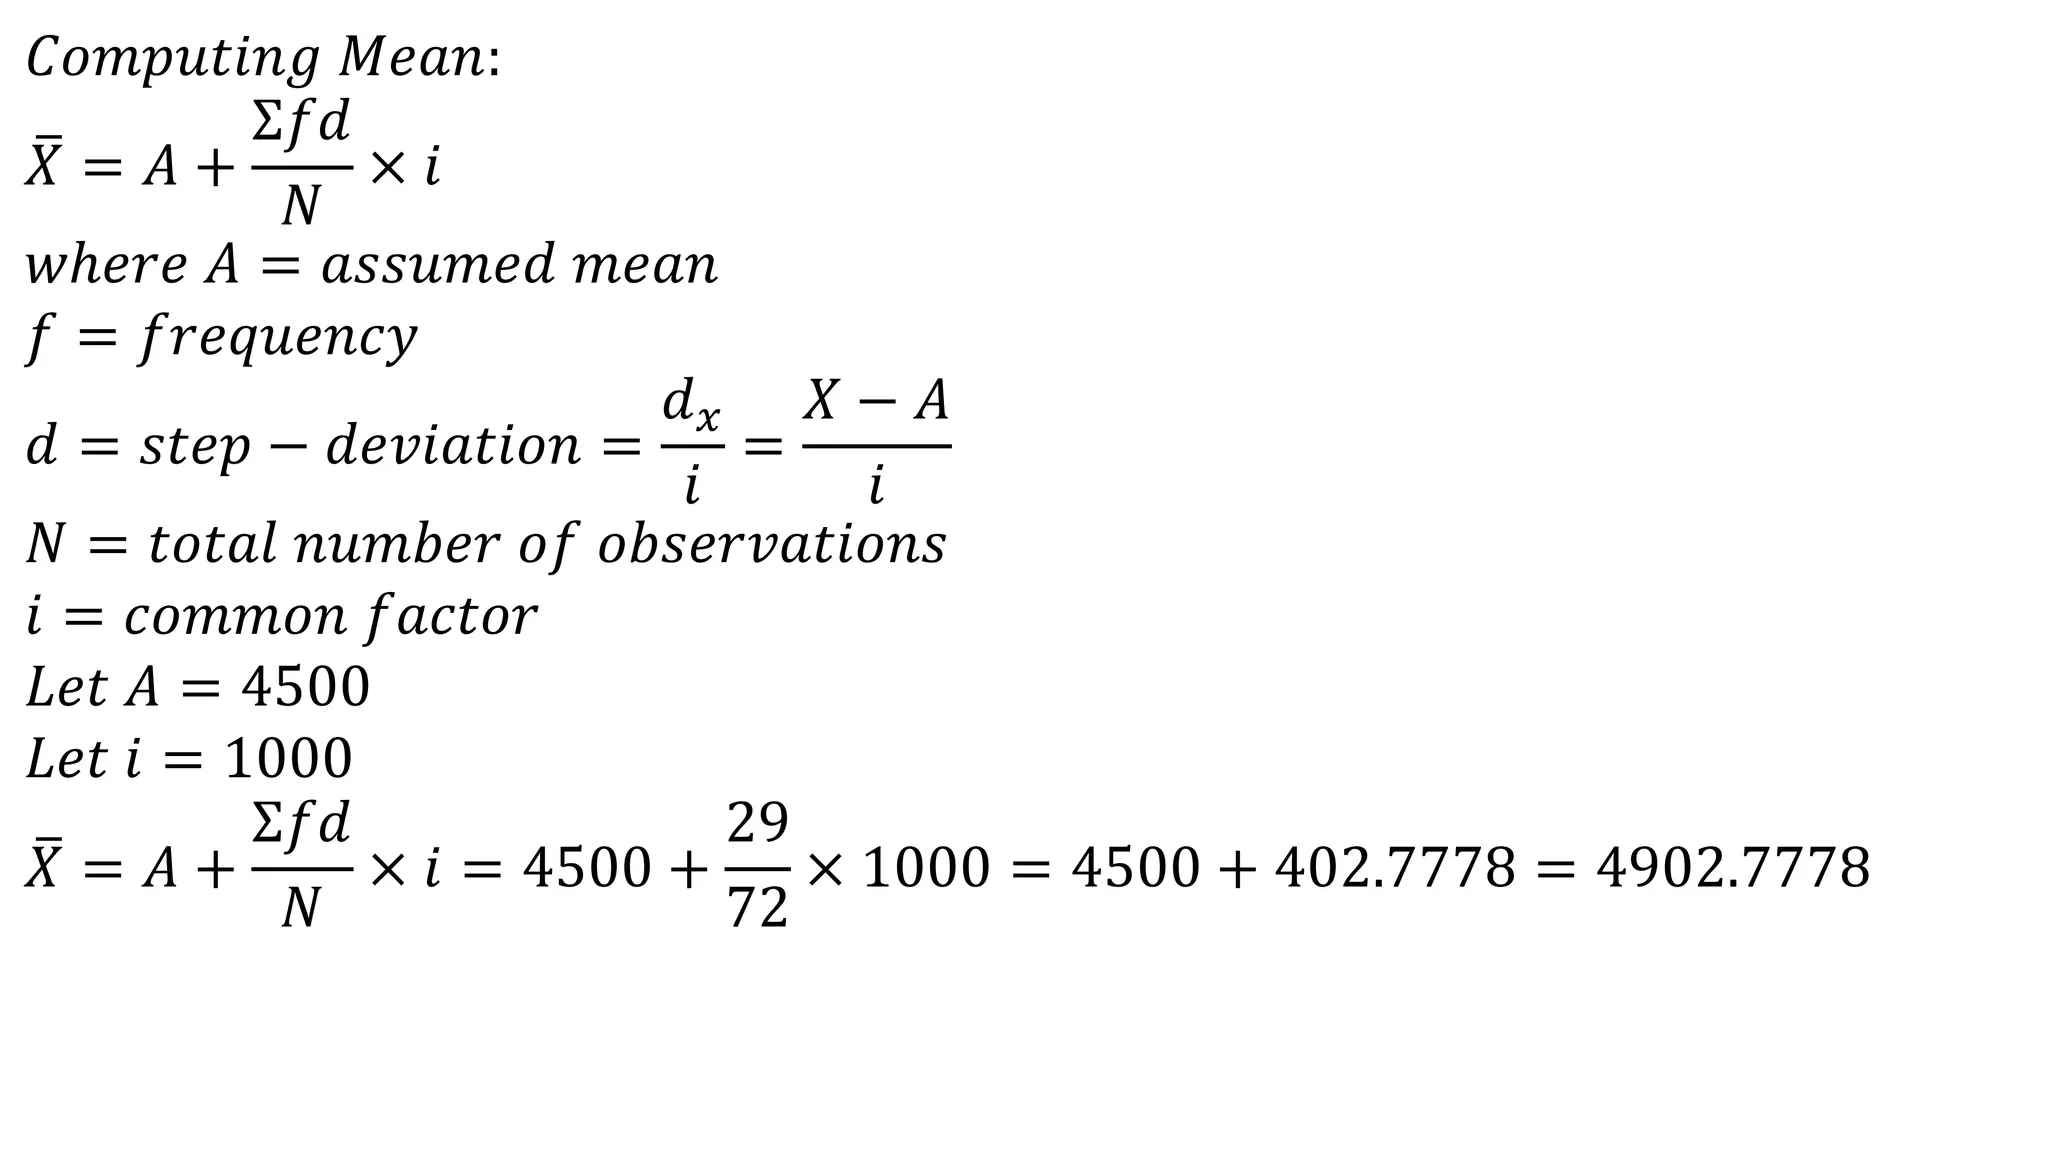
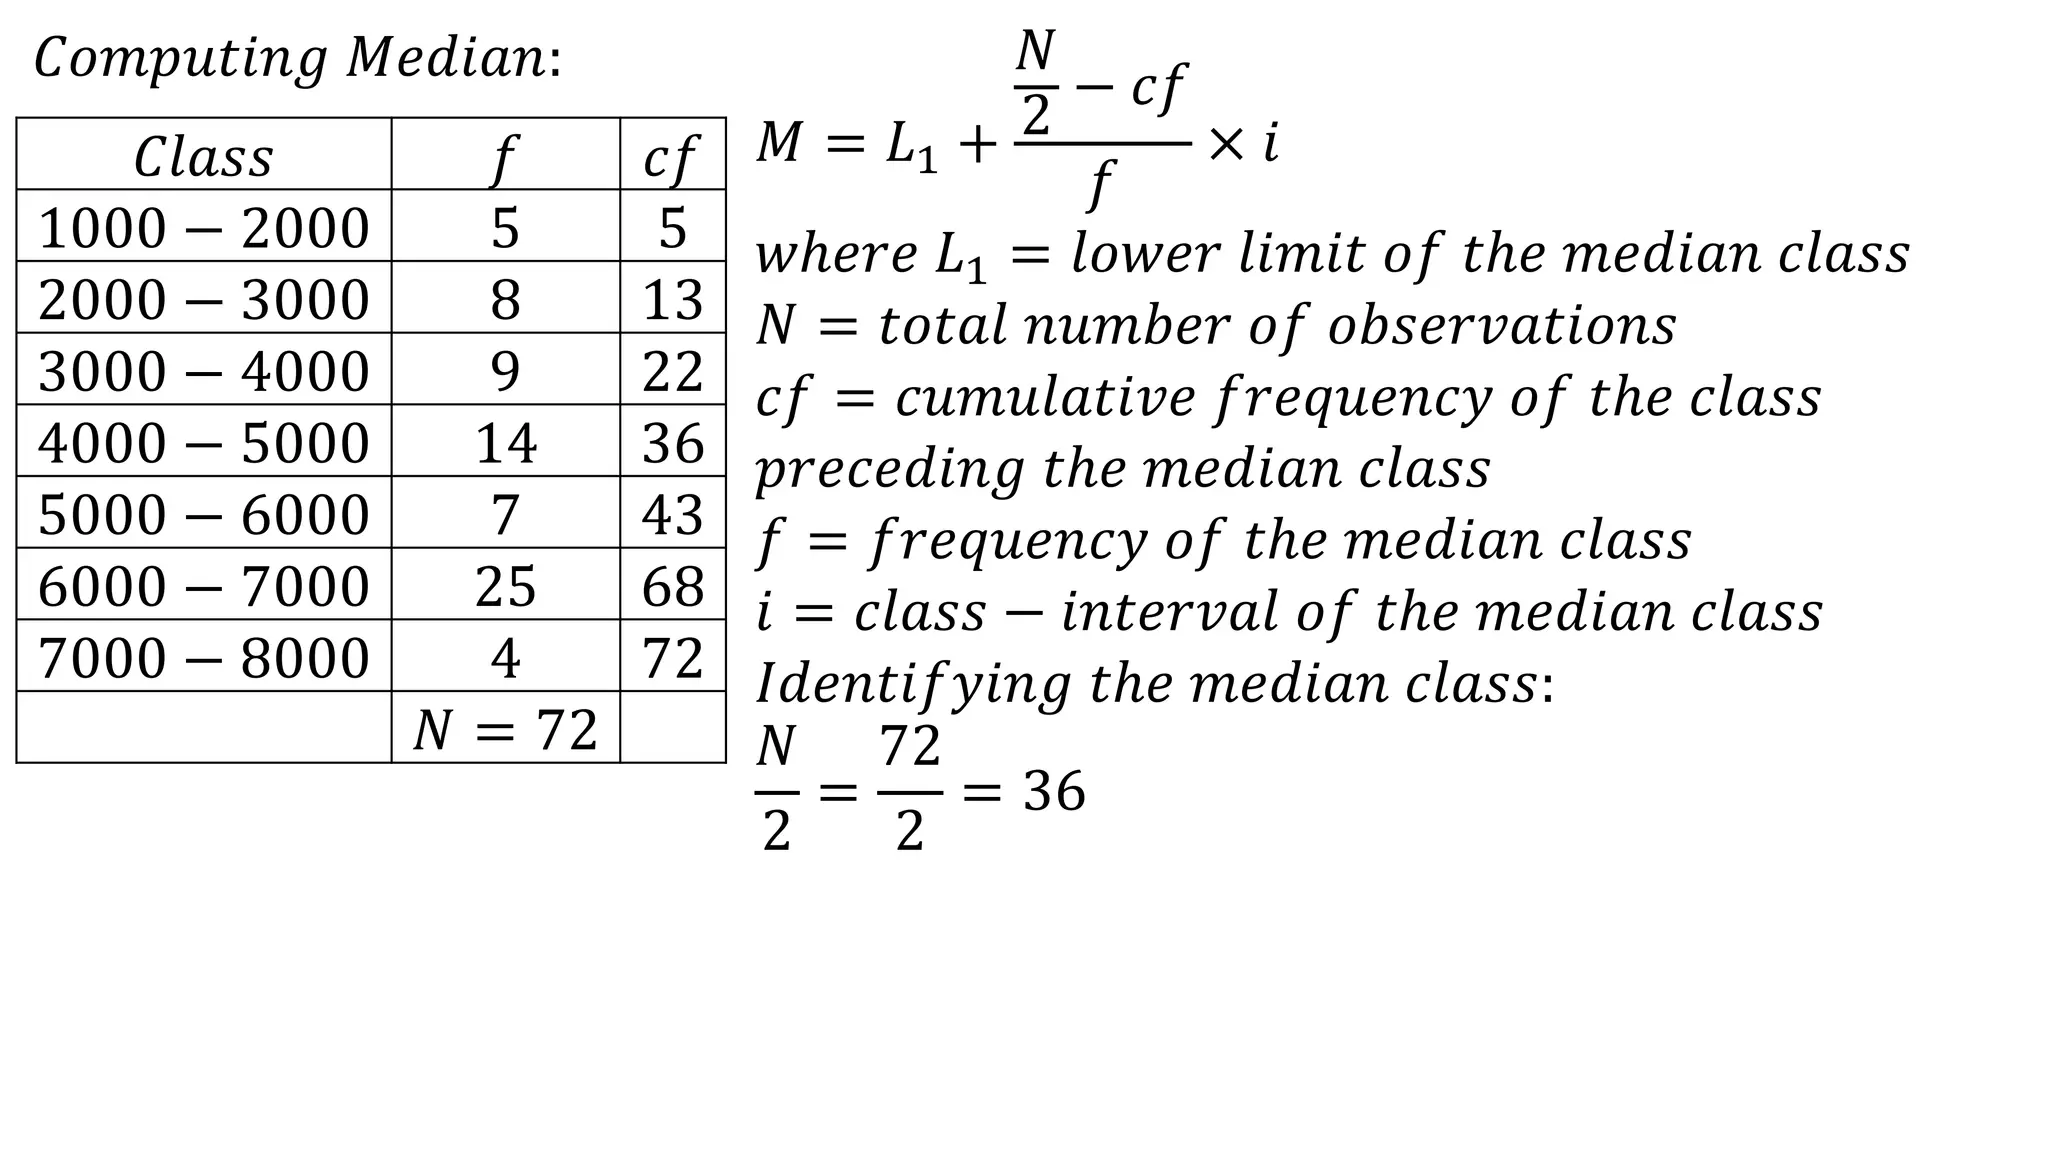
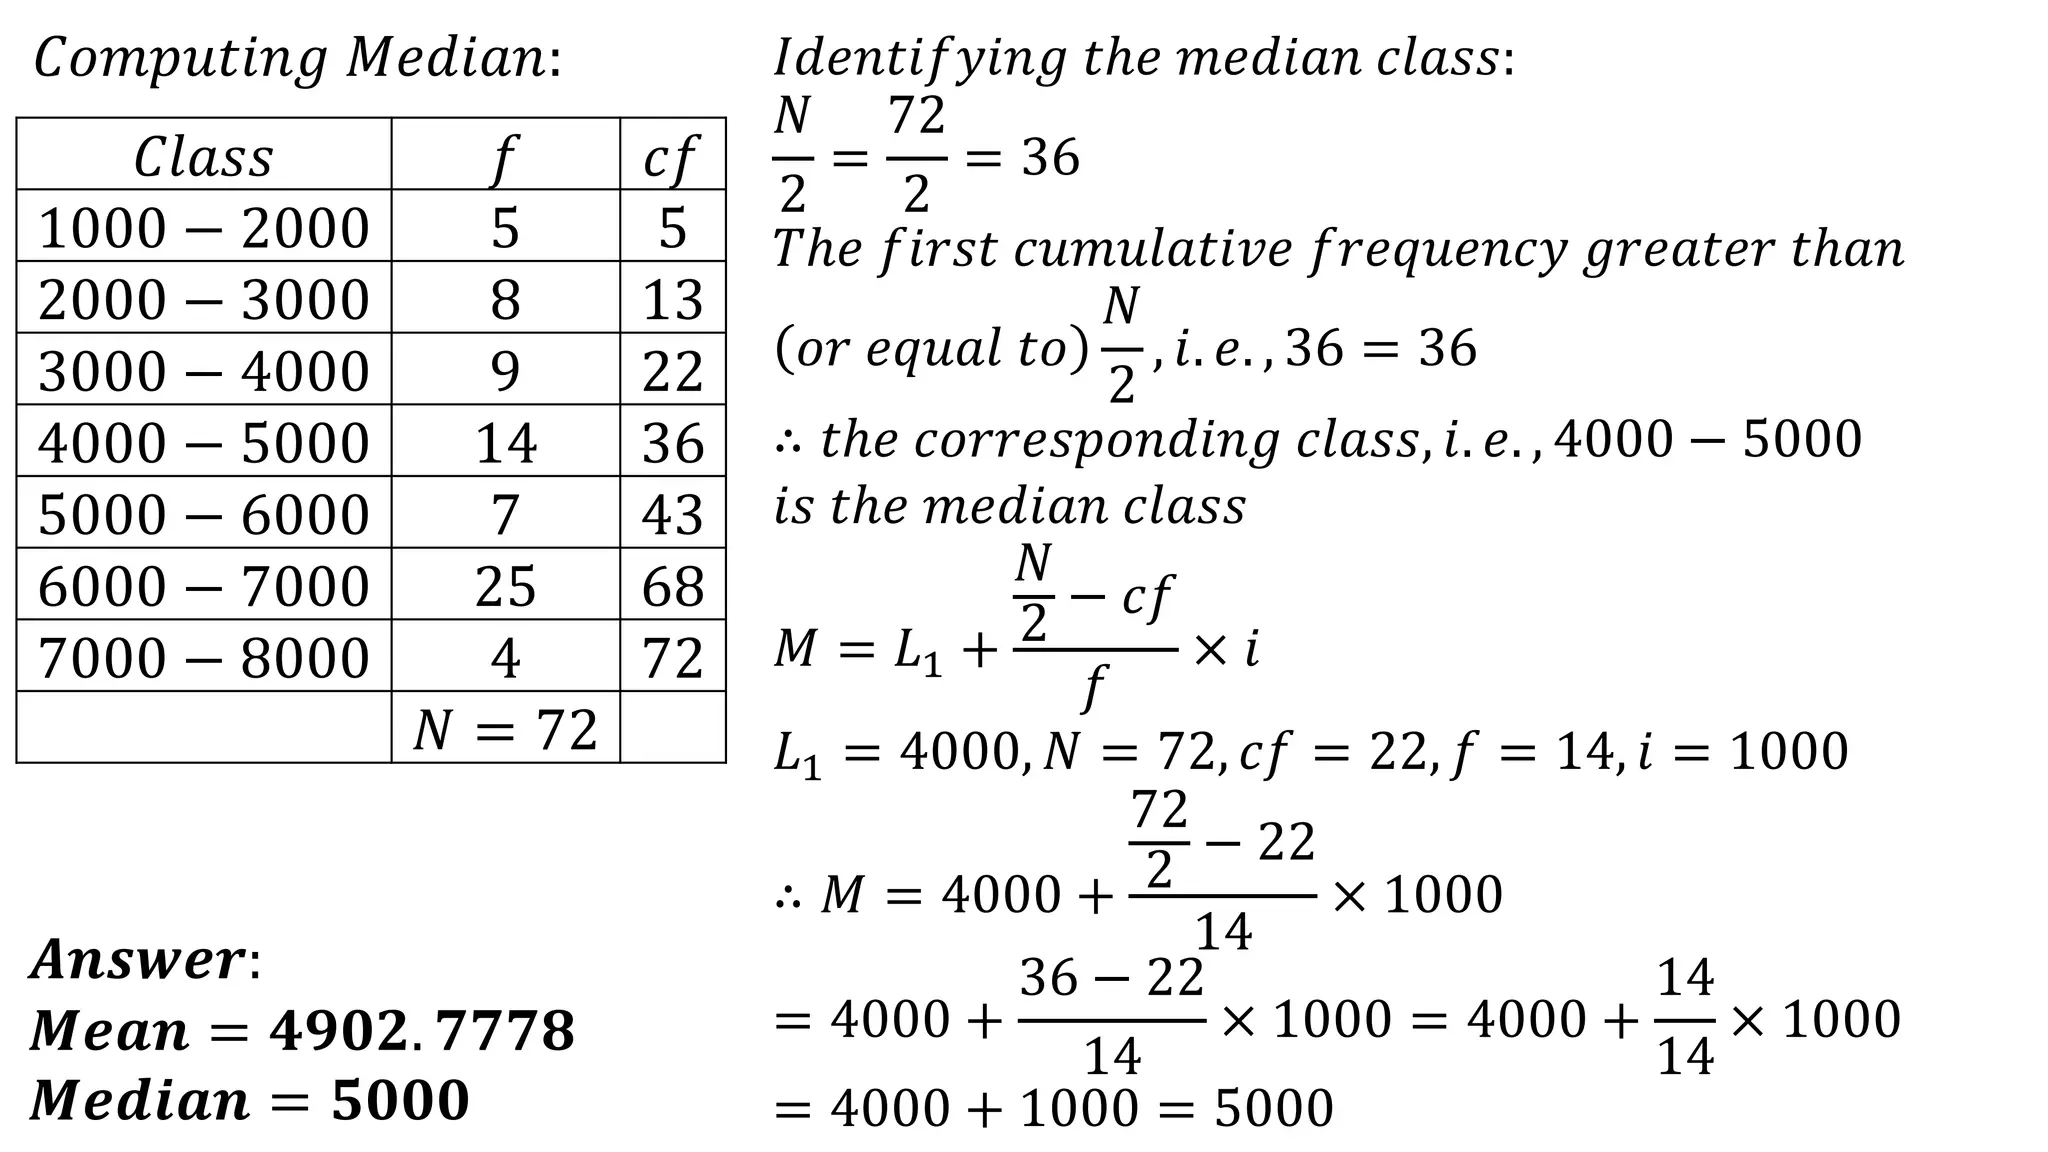
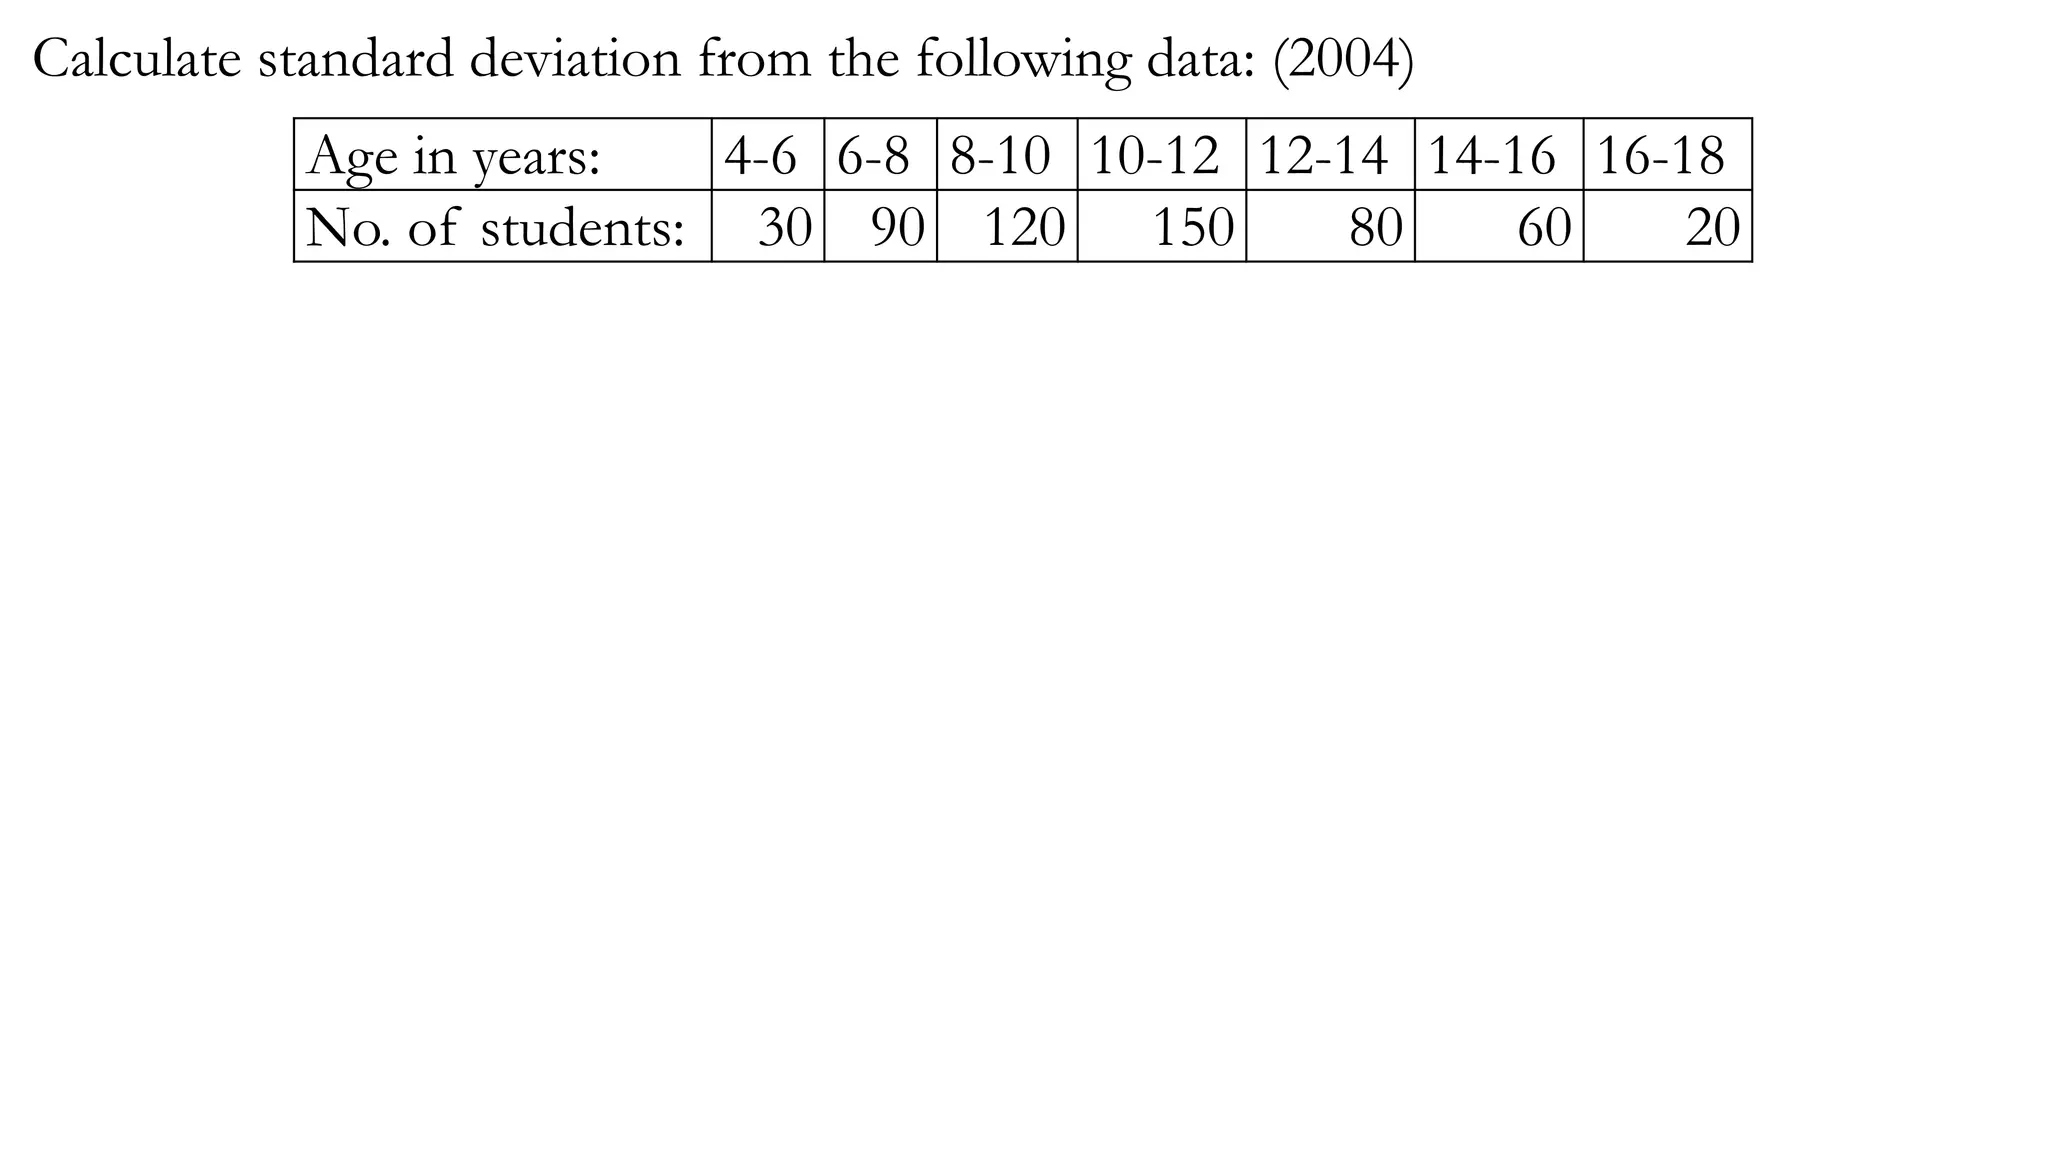
4. Find the arithmetic mean and standard deviation from the following data. Also find
coefficient of variation. (2006)
Age (less than): 10 20 30 40 50 60 70 80
No. of persons: 15 30 50 75 100 110 115 125
9. Compute mean and median from the following data: (2007)
Income more than (in Rs.): 1000 2000 3000 4000 5000 6000 7000 8000
No. of persons: 72 67 59 50 36 29 4 0
15. An incomplete frequency distribution is given as follows. Given that the median value
is 46, determine the missing frequencies using the median formula. (2009)
Variable 10-20 20-30 30-40 40-50 50-60 60-70 70-80 Total
Frequency 12 30 ? 65 ? 25 18 229
19. The mean annual salary of employees of a company is Rs.30000. The mean annual
salaries of male and female employees are Rs.35000 and Rs.23000, respectively. Find
out the percentage of male and female employees working in the company. (2009)
22. 8 coins are tossed at a time, 256 times. The actual results of getting the numbers of
heads are as follows. Find out expected frequencies. Also calculate mean and standard
deviation. (2010)
No. of Heads: 0 1 2 3 4 5 6 7 8 Total
Frequency: 2 6 30 52 67 56 32 10 1 256
31. Measures of Dispersion
β’ Standard Deviation: 3 (2004, 2006, 2010)
β’ Coefficient of Variation: 4 (2005, 2006, 2008, 2012)
β’ Total: 7
32. Calculate standard deviation from the following data: (2004)
Age in years: 4-6 6-8 8-10 10-12 12-14 14-16 16-18
No. of students: 30 90 120 150 80 60 20
35. Find the coefficient of variation, if the sum of squares of the deviations of 10
observations taken from mean 50 is 250. (2005)
πΊππ£ππ π‘βππ‘: π = 10, π = 50, Ξ£π π₯
2 = 250
πΆπ =
π
π
Γ 100
π =
Ξ£π π₯
2
π
β΄ πΆπ =
Ξ£π π₯
2
π
π
Γ 100 =
250
10
50
Γ 100 =
25
50
Γ 100 =
5
50
Γ 100 = 10
36. Find the arithmetic mean and standard deviation from the following data. Also find
coefficient of variation. (2006)
Age (less than): 10 20 30 40 50 60 70 80
No. of persons: 15 30 50 75 100 110 115 125
41. Share prices of two companies A Ltd. and B Ltd. were recorded as follows. Which
companyβs share prices are more variable? (2008, 2012)
A Ltd. 12 13 15 14 14 14 13 17
B Ltd. 113 114 113 115 117 114 112 114
48. 8 coins are tossed at a time, 256 times. The actual results of getting the numbers of
heads are as follows. Find out expected frequencies. Also calculate mean and standard
deviation. (2010)
No. of Heads: 0 1 2 3 4 5 6 7 8 Total
Frequency: 2 6 30 52 67 56 32 10 1 256
60. Find the measure of skewness and kurtosis on the basis of moments for the
following distribution: (2010)
Marks: 5-15 15-25 25-35 35-45 45-55
No. of Students: 1 3 5 7 4