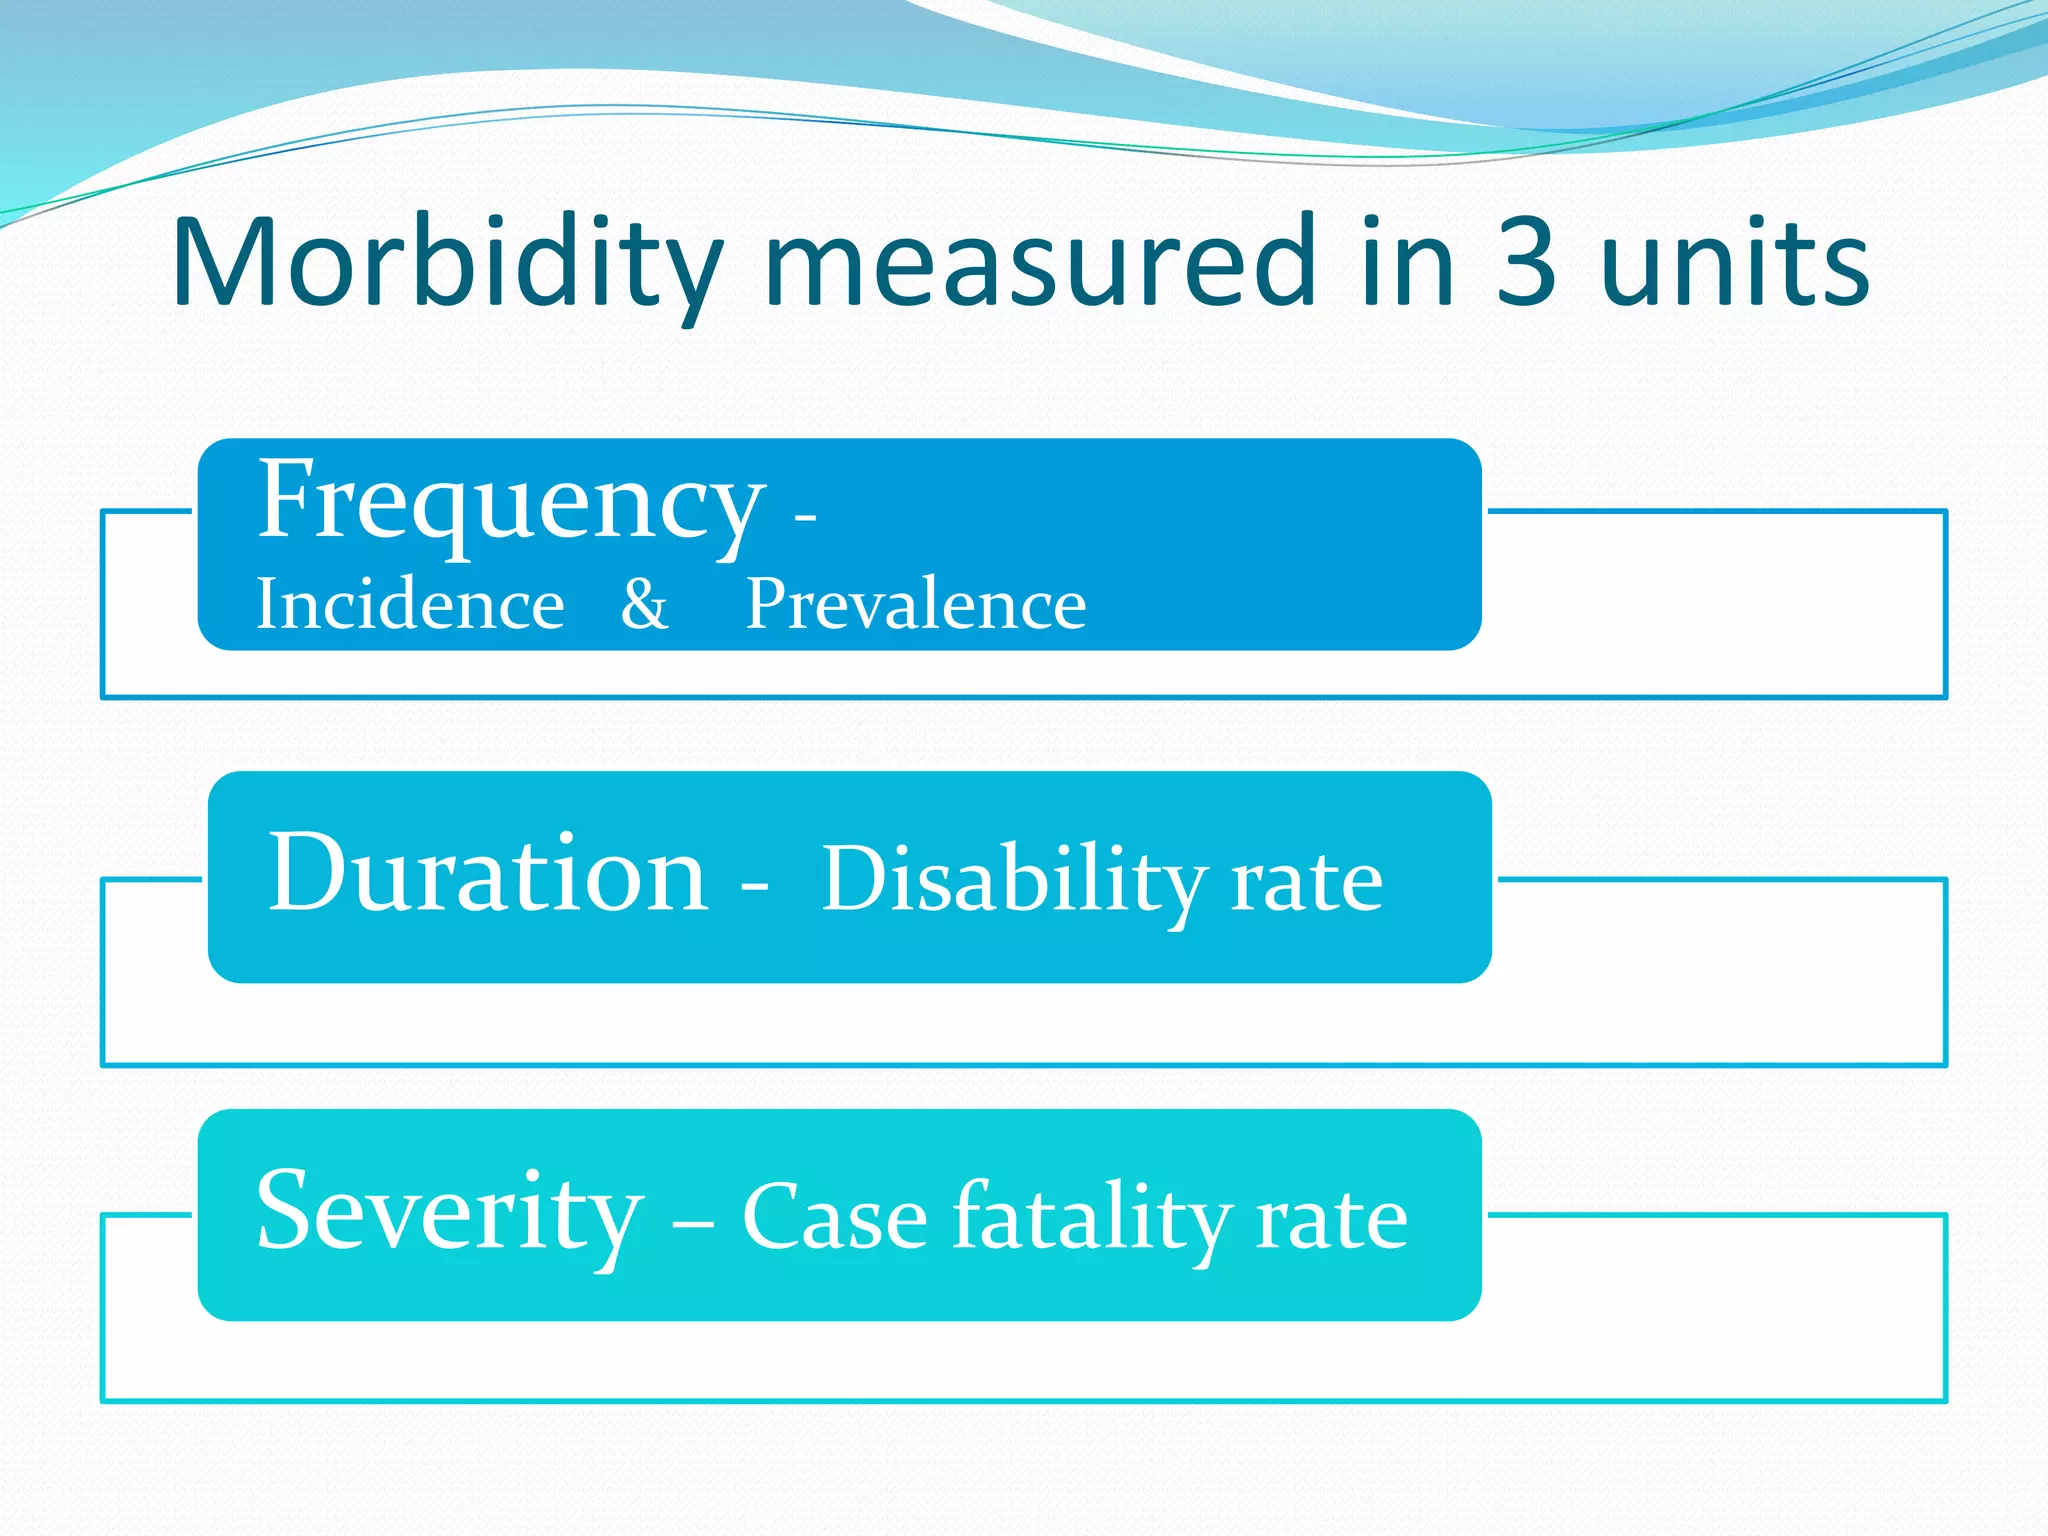
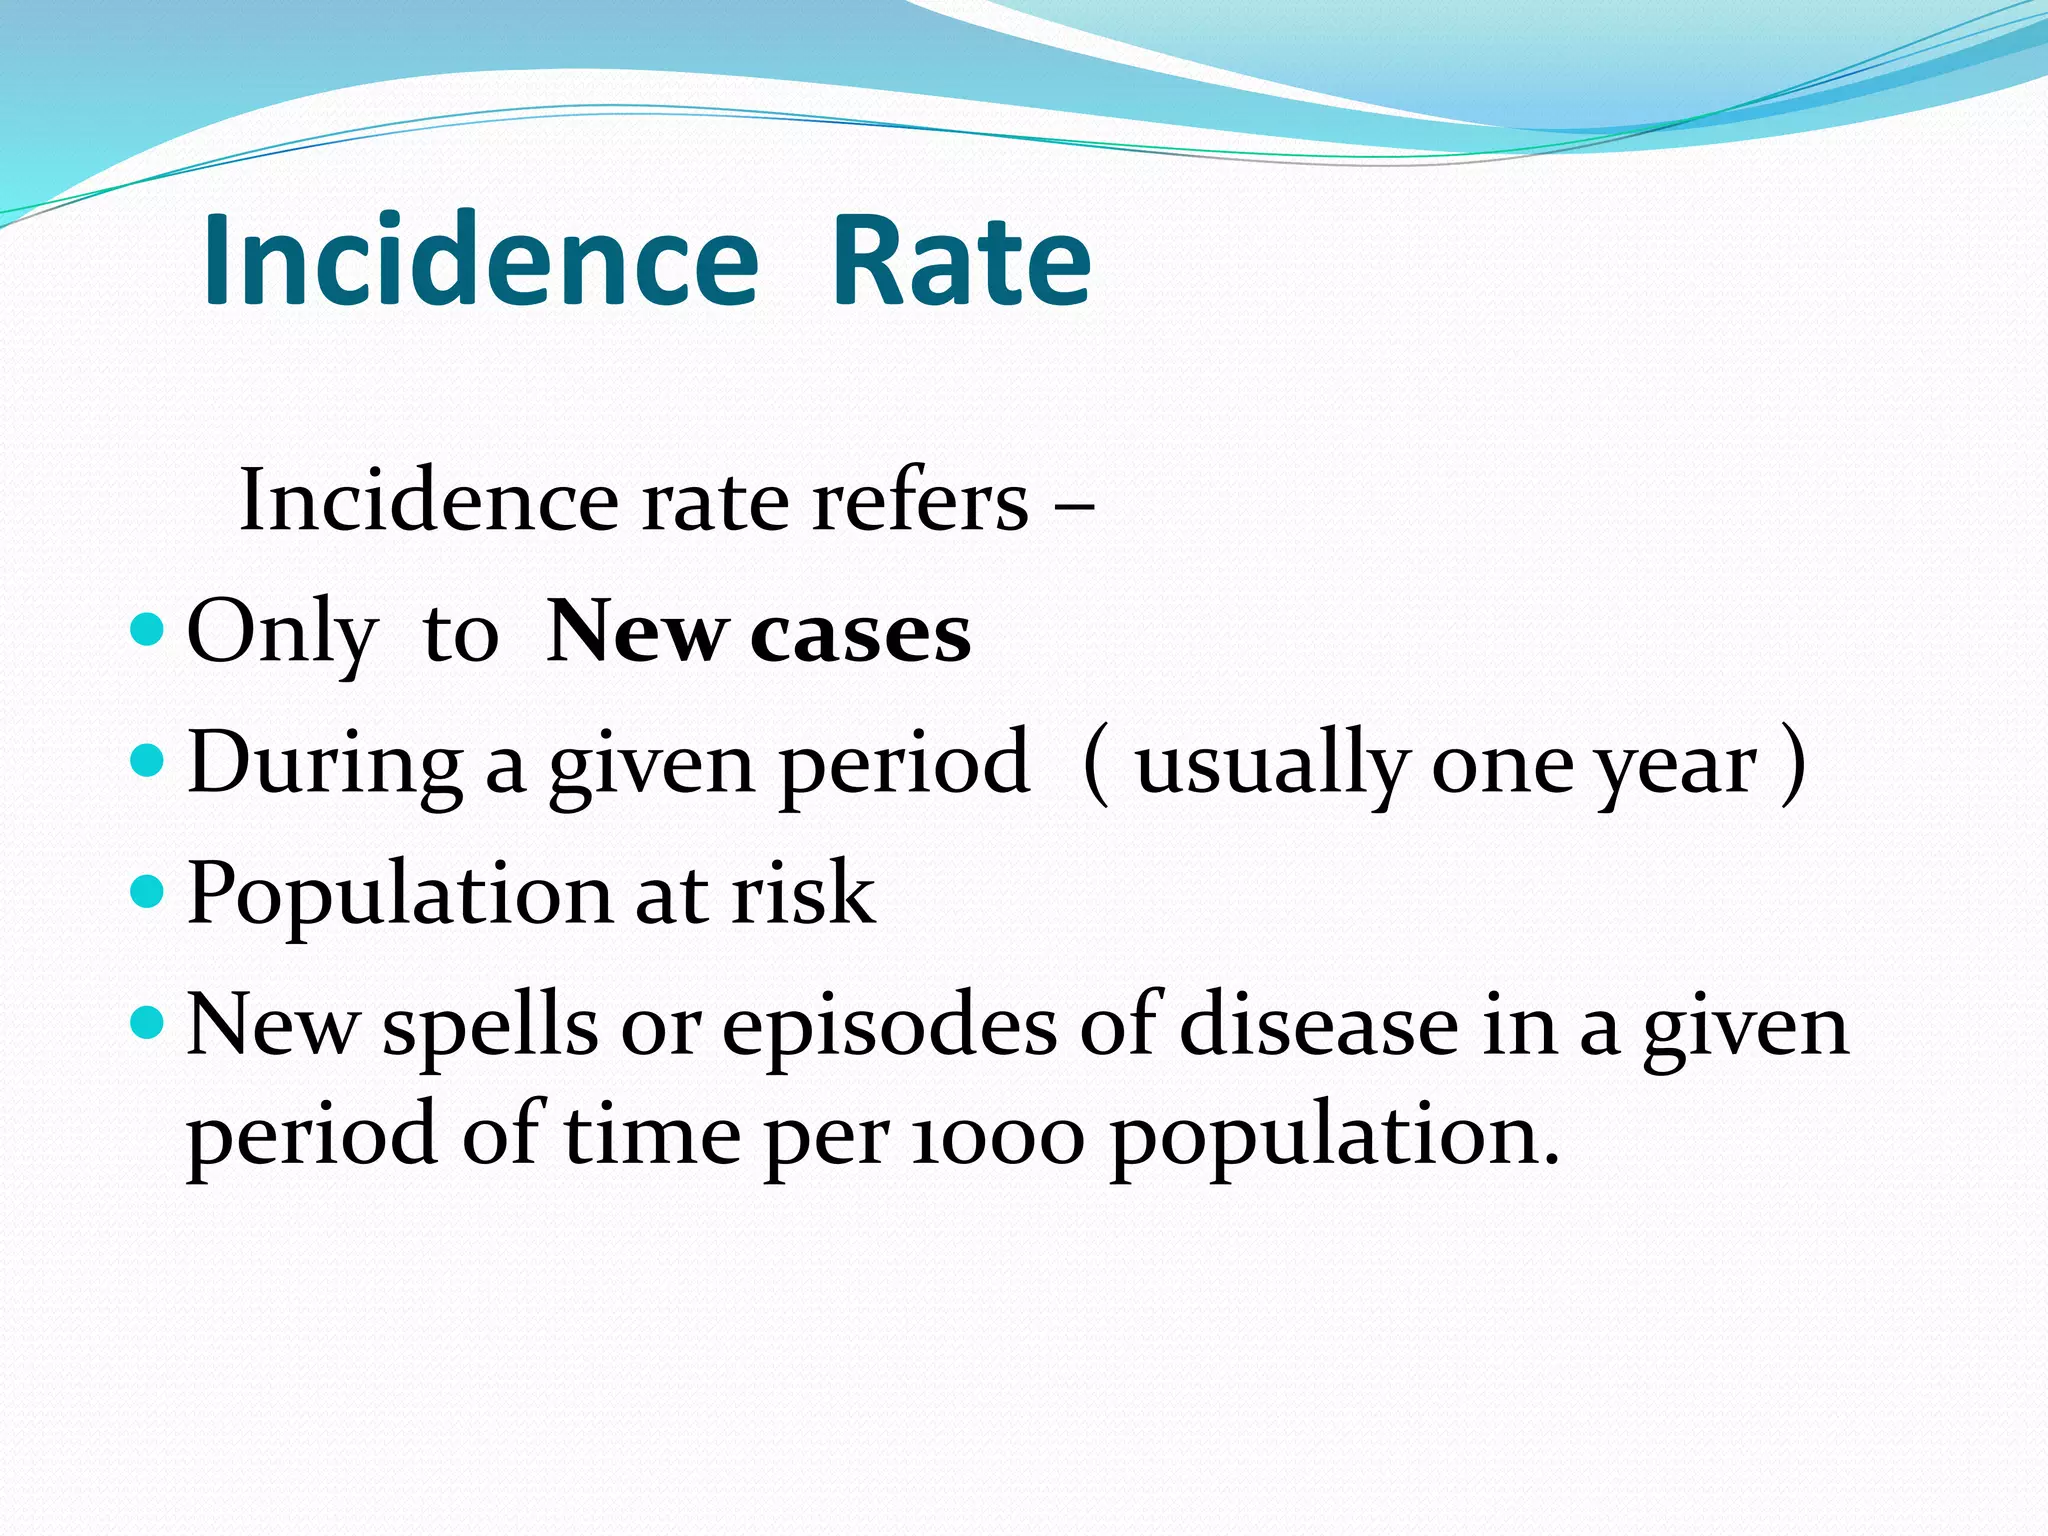
Dr. Anjali Wagh
Professor & HOD
Dept. of Community Medicine
D.Y.Patil Medical College, Kolhapur
Measurement of Morbidity
 “ Any departure, subjective or objective,
from a state of physiological well-being”
 Sickness, illness, disability
Morbidity measured in 3 units.
 Frequency - Incidence & prevalence
 Duration - Disability rate
 Severity – Case fatality rate.
Morbidity measured in 3 units
Frequency -
Incidence & Prevalence
Duration - Disability rate
Severity – Case fatality rate
Uses of Morbidity data
• Describe the disease load in the community &
assist in establishment of priorities.
• Provide more comprehensive, accurate &
clinically relevant data essential for basic
research
• Monitoring & Evaluation of disease control &
prevention activities.
Incidence
 “ The number of New cases occurring in a defined
population during a specified period of time”
Number of new cases of specific disease
during a given time period
Incidence Rate = -------------------------------------- X 1000
Population at risk during that period
500
IR = ------ X 1000 = 16.7 per 1000 per year
30,000
Incidence Rate
Incidence rate refers –
 Only to New cases
 During a given period ( usually one year )
 Population at risk
 New spells or episodes of disease in a given
period of time per 1000 population.
Special Incidence rates
 Attack rate = No. of new cases of disease during
specified time period
----------------------------------------- x 100
Total population at risk during
same period.
 It is the percentage of population at risk , getting the
disease .
Secondary attack rate:
 The number of exposed persons developing the
disease within the range of Incubation period
following exposure to a primary case.
 e.g. In family of 6 persons, consisting of 2 parents
(immune) & 4 children, susceptible to chickenpox, one
child develops chickenpox & after sometimes 2
children develop among three.
 SAR = 2 / 3 X 100 = 66 %
Uses of incidence rate
Useful for taking action
 A) to control disease
 B) for research into etiology and pathogenesis,
distribution of diseases, efficacy of preventive &
therapeutic measures
Prevalence
 All current cases (old & new) existing at a given
point of time, or over a period of time in a given
population
 Definition: The total number of all individuals
who have an attribute or disease at a particular time
divided by the population at risk of having the
attribute or disease at this point in time or midway
through the period
 Two types – Point prevalence
Period prevalence
Point Prevalence
 Point prevalence:- the number of all current (old and
new) cases of a disease at one point in time in
relation to a defined population.
Number of all current (old &new) cases of
specific disease existing at a given time period
= ----------------------------------------------------------- X 100
Estimated Population at the same point of time
Period prevalence
 Period prevalence: -the number of all current (old and
new) cases existing during a defined period of time
expressed in relation to a defined population.
Number of existing cases (old &new) cases of a
specified disease during a given period of time interval
= -------------------------------------------------------- X 100
Estimated mid-interval Population at risk
Case -1
Case -3
Case -5
Case -6
Case -8
Case -2
Case -4
Case -7
case 9
Jan. 1 Dec. 31
 Incidence (cases ) – 3, 4 ,5, & 8
 Point prevalence ( Jan 1st) – 1 ,2, 7 & 9
 Point prevalence (Dec 31st) – 1, 3, 5 , 8 & 9
 Period prevalence ( Jan – Dec ) cases -
1, 2, 3, 4 ,5, 7 , 8 & 9
Relationship between
Incidence and Prevalence
P = I X D
= Incidence X mean duration
Incidence = P / D
Duration = P / I
Relationship between
Incidence and Prevalence
Factors influencing observed prevalence rate
• Longer duration of the disease
• Prolongation of life without cure
• Increase in new cases (incidence / risk)
• Out-migration of non-diseased people
• In-migration of susceptible/diseased people
• Improved diagnostic &/or reporting
Relationship between
Incidence and Prevalence
Factors influencing observed prevalence rate
• Shorter duration of the disease
• Increased case-fatality rate
• Decrease in new cases (incidence / risk)
• In-migration of “healthy” people
• Out-migration of diseased people
• Improved cure rate
Relationship between
Incidence and Prevalence
Uses of prevalence
 Helps to estimate the magnitude of health
problem / disease in the community.
 Identify potential high risk population.
 Useful for administrative & planning
purposes.
Measurement of morbidity

Measurement of morbidity

  • 1.
    Dr. Anjali Wagh Professor& HOD Dept. of Community Medicine D.Y.Patil Medical College, Kolhapur
  • 2.
    Measurement of Morbidity “ Any departure, subjective or objective, from a state of physiological well-being”  Sickness, illness, disability Morbidity measured in 3 units.  Frequency - Incidence & prevalence  Duration - Disability rate  Severity – Case fatality rate.
  • 3.
    Morbidity measured in3 units Frequency - Incidence & Prevalence Duration - Disability rate Severity – Case fatality rate
  • 4.
    Uses of Morbiditydata • Describe the disease load in the community & assist in establishment of priorities. • Provide more comprehensive, accurate & clinically relevant data essential for basic research • Monitoring & Evaluation of disease control & prevention activities.
  • 5.
    Incidence  “ Thenumber of New cases occurring in a defined population during a specified period of time” Number of new cases of specific disease during a given time period Incidence Rate = -------------------------------------- X 1000 Population at risk during that period 500 IR = ------ X 1000 = 16.7 per 1000 per year 30,000
  • 6.
    Incidence Rate Incidence raterefers –  Only to New cases  During a given period ( usually one year )  Population at risk  New spells or episodes of disease in a given period of time per 1000 population.
  • 7.
    Special Incidence rates Attack rate = No. of new cases of disease during specified time period ----------------------------------------- x 100 Total population at risk during same period.  It is the percentage of population at risk , getting the disease .
  • 8.
    Secondary attack rate: The number of exposed persons developing the disease within the range of Incubation period following exposure to a primary case.  e.g. In family of 6 persons, consisting of 2 parents (immune) & 4 children, susceptible to chickenpox, one child develops chickenpox & after sometimes 2 children develop among three.  SAR = 2 / 3 X 100 = 66 %
  • 9.
    Uses of incidencerate Useful for taking action  A) to control disease  B) for research into etiology and pathogenesis, distribution of diseases, efficacy of preventive & therapeutic measures
  • 10.
    Prevalence  All currentcases (old & new) existing at a given point of time, or over a period of time in a given population  Definition: The total number of all individuals who have an attribute or disease at a particular time divided by the population at risk of having the attribute or disease at this point in time or midway through the period  Two types – Point prevalence Period prevalence
  • 11.
    Point Prevalence  Pointprevalence:- the number of all current (old and new) cases of a disease at one point in time in relation to a defined population. Number of all current (old &new) cases of specific disease existing at a given time period = ----------------------------------------------------------- X 100 Estimated Population at the same point of time
  • 12.
    Period prevalence  Periodprevalence: -the number of all current (old and new) cases existing during a defined period of time expressed in relation to a defined population. Number of existing cases (old &new) cases of a specified disease during a given period of time interval = -------------------------------------------------------- X 100 Estimated mid-interval Population at risk
  • 13.
    Case -1 Case -3 Case-5 Case -6 Case -8 Case -2 Case -4 Case -7 case 9 Jan. 1 Dec. 31
  • 14.
     Incidence (cases) – 3, 4 ,5, & 8  Point prevalence ( Jan 1st) – 1 ,2, 7 & 9  Point prevalence (Dec 31st) – 1, 3, 5 , 8 & 9  Period prevalence ( Jan – Dec ) cases - 1, 2, 3, 4 ,5, 7 , 8 & 9
  • 19.
  • 20.
    P = IX D = Incidence X mean duration Incidence = P / D Duration = P / I Relationship between Incidence and Prevalence
  • 21.
    Factors influencing observedprevalence rate • Longer duration of the disease • Prolongation of life without cure • Increase in new cases (incidence / risk) • Out-migration of non-diseased people • In-migration of susceptible/diseased people • Improved diagnostic &/or reporting
  • 22.
  • 23.
    Factors influencing observedprevalence rate • Shorter duration of the disease • Increased case-fatality rate • Decrease in new cases (incidence / risk) • In-migration of “healthy” people • Out-migration of diseased people • Improved cure rate
  • 24.
  • 25.
    Uses of prevalence Helps to estimate the magnitude of health problem / disease in the community.  Identify potential high risk population.  Useful for administrative & planning purposes.