Downloaded 684 times

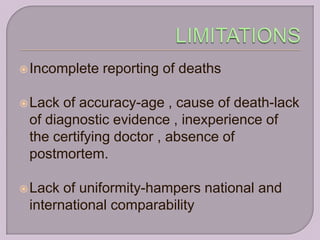
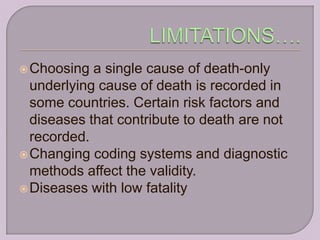
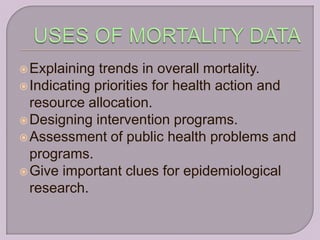
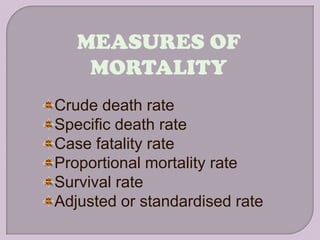
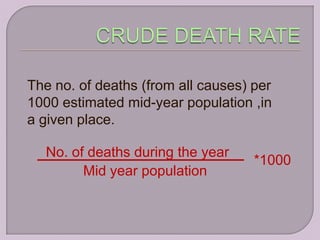
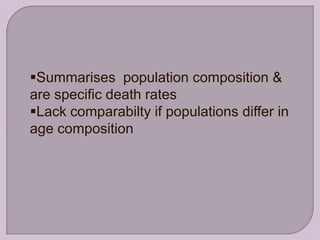
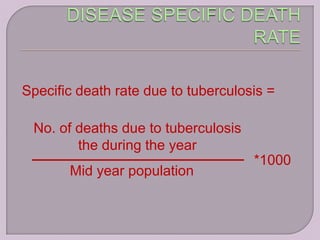
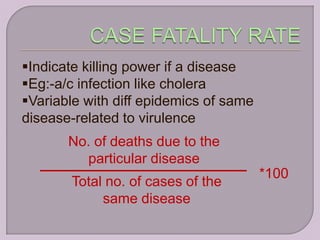
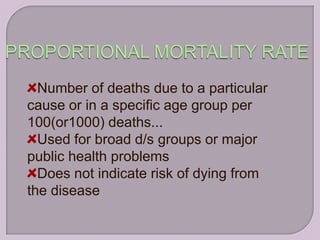
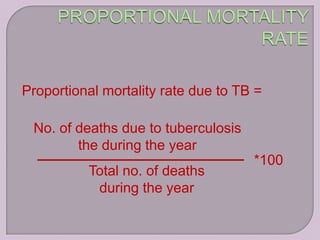


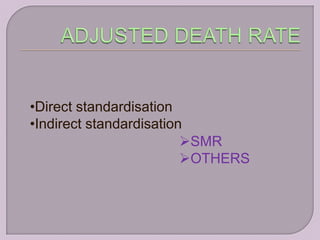


Measures of mortality provide important information for epidemiological studies. They include crude death rate, specific death rates, case fatality rate, proportional mortality rate, and survival rate. Standardized rates allow for comparisons between populations with different age compositions. Some challenges include incomplete reporting, inaccurate information, and non-uniformity across locations. However, mortality measures are useful for explaining trends, prioritizing health issues, designing interventions, and assessing public health programs.


