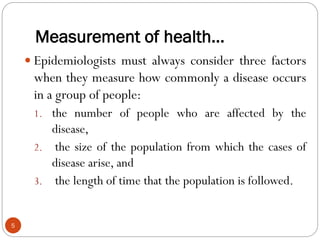
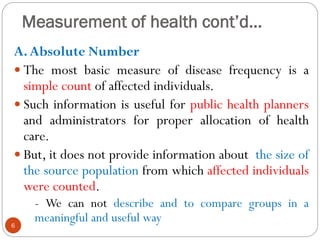
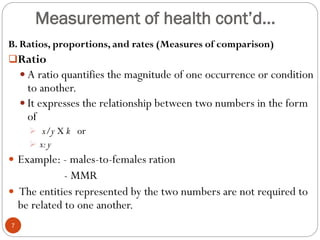
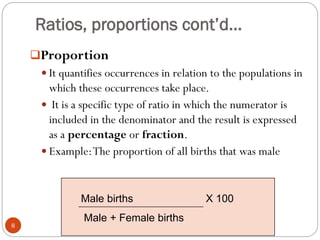
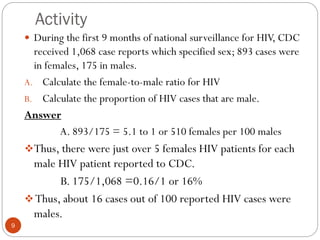
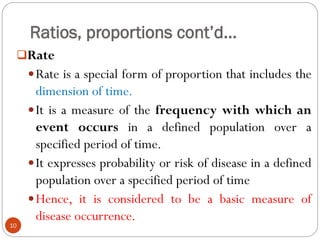
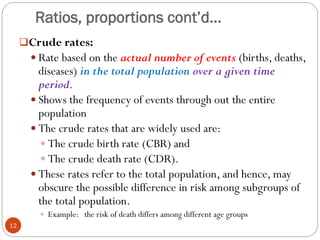
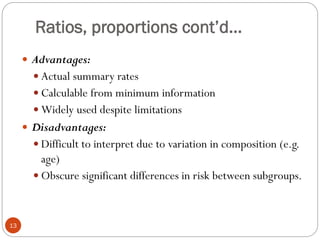
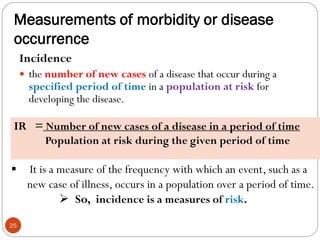
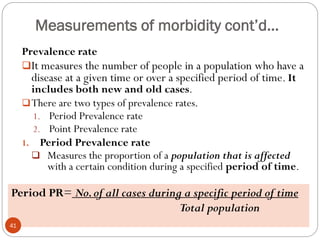
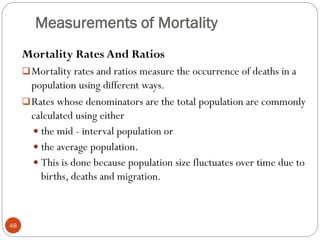
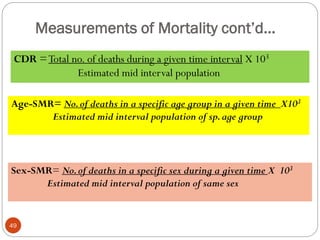
By
ADANE ASEFA ( BSc, MPHE , Ass Prof )
Measurement in Epidemiology
1
OBJECTIVES
At the end of this chapter the student is expected to:
 Describe the principles of measurement in epidemiology
 Explain how to measure health and health related events in
a given population
 Calculate different morbidity and mortality measures
2
Introduction
3
 Epidemiologists study the distribution and determinants
of disease frequency in human populations to control
health problems.
 Thus, the objectives of epidemiology are to determine
the extent of disease in a population,identify patterns
and trends in disease occurrence, identify the causes
of disease, and evaluate the effectiveness of prevention
and treatment activities.
 Measuring how often a disease arises in a
population is usually the first step in achieving these
goals.
Measurement of health
Health status of a community is assessed by the
collection, analysis and interpretation of data on :
Illness (morbidity)
Death (mortality)
Disability and
Utilization of health services
4
Measurement of health…
5
 Epidemiologists must always consider three factors
when they measure how commonly a disease occurs
in a group of people:
1. the number of people who are affected by the
disease,
2. the size of the population from which the cases of
disease arise, and
3. the length of time that the population is followed.
Measurement of health cont’d…
A.Absolute Number
 The most basic measure of disease frequency is a
simple count of affected individuals.
 Such information is useful for public health planners
and administrators for proper allocation of health
care.
 But, it does not provide information about the size of
the source population from which affected individuals
were counted.
- We can not describe and to compare groups in a
meaningful and useful way
6
Measurement of health cont’d…
B. Ratios, proportions, and rates (Measures of comparison)
Ratio
 A ratio quantifies the magnitude of one occurrence or condition
to another.
 It expresses the relationship between two numbers in the form
of
 x/y X k or
 x:y
 Example: - males-to-females ration
- MMR
 The entities represented by the two numbers are not required to
be related to one another.
7
Ratios, proportions cont’d…
Proportion
 It quantifies occurrences in relation to the populations in
which these occurrences take place.
 It is a specific type of ratio in which the numerator is
included in the denominator and the result is expressed
as a percentage or fraction.
 Example:The proportion of all births that was male
Male births X 100
Male + Female births
8
Activity
9
 During the first 9 months of national surveillance for HIV, CDC
received 1,068 case reports which specified sex; 893 cases were
in females, 175 in males.
A. Calculate the female-to-male ratio for HIV
B. Calculate the proportion of HIV cases that are male.
Answer
A. 893/175 = 5.1 to 1 or 510 females per 100 males
Thus, there were just over 5 females HIV patients for each
male HIV patient reported to CDC.
B. 175/1,068 =0.16/1 or 16%
Thus, about 16 cases out of 100 reported HIV cases were
males.
Ratios, proportions cont’d…
Rate
Rate is a special form of proportion that includes the
dimension of time.
It is a measure of the frequency with which an
event occurs in a defined population over a
specified period of time.
It expresses probability or risk of disease in a defined
population over a specified period of time
Hence, it is considered to be a basic measure of
disease occurrence.
10
Ratios, proportions cont’d…
Types of rates: There are three types of rates:
Crude rates
Specific rates
Adjusted rates
Rate = Number of events in a specific period x k
Popn at risk of these events in a specified Period
11
Ratios, proportions cont’d…
Crude rates:
 Rate based on the actual number of events (births, deaths,
diseases) in the total population over a given time
period.
 Shows the frequency of events through out the entire
population
 The crude rates that are widely used are:
 The crude birth rate (CBR) and
 The crude death rate (CDR).
 These rates refer to the total population, and hence, may
obscure the possible difference in risk among subgroups of
the total population.
 Example: the risk of death differs among different age groups
12
Ratios, proportions cont’d…
 Advantages:
 Actual summary rates
 Calculable from minimum information
 Widely used despite limitations
 Disadvantages:
 Difficult to interpret due to variation in composition (e.g.
age)
 Obscure significant differences in risk between subgroups.
13
Ratios, proportions cont’d…
Specific rates
 Specific rates apply to specific subgroups in the
population, such as a specific age group, sex,
occupation, marital status, etc.
 Except for cause-specific rates, the denominator should
be the population in that specific subgroup
 As a result, specific rates do not add up to a crude rate.
14
Ratios, proportions cont’d…
 Example: Infant Mortality Rate (IMR), Neonatal Mortality Rate
(NMR), Maternal Mortality Rate (MMR)
 Advantages:
 The rates apply to homogenous subgroups
 The rates are detailed and useful for epidemiological and
public health purposes.
 Disadvantages:
 It is cumbersome to compare many subgroups of two or more
populations
15
standardized or adjusted rate
16
 Crude rates are summary measures of disease frequency that
are based on the raw data.
 It is difficult to interpret absolute and relative measures of
comparison that are based on crude rates when the compared
groups differ on a characteristic that affects the rate of
disease (such as age, gender, or race).
standardized or adjusted rate
17
 What explains the difference between the crude mortality
rates of the two states? Probably due to age?
Ratios, proportions cont’d…
Adjusted rates
 Are summary rates that have undergone statistical
transformation, to permit fair comparison between
groups
For example: age needs adjustment due to its marked effect
on both diseases and death.
 When comparing the crude death rates of two or more
places, it is impossible to know whether the difference
is due to age composition, age specific death rate or
both.
 In Age adjusted rates, the effect of age composition is
artificially removed.
18
Ratios, proportions cont’d…
Methods of adjustment
 Direct method
 The adjusted rate is derived by applying the category specific
rates observed in each of the populations to a single standard
population.
 Requires the following information: (1) age-specific rates in each
group (in this case, each state) and (2) age structure of a
“standard” population
 age-adjusted rate:
 Use a standard population for each age group of both areas.
 Note that the populations of the groups to be compared have to
be equal when standardizing.
 you may use one population eitherA or B as a standard or
combine the two population.
19
Ratios, proportions cont’d…
Step of direct method
1. Multiply the ASMR in each age group by the standard
population; this will give the annual number of deaths
occurring in the specific age group.
2. Add the number of deaths occurring in each age group to
obtain the total number of deaths
3. Then divide the total number of deaths by the total
standard population.
 See next example:
20
Age-specific mortality rate and age
distribution of two populations, A and B.
Age-
group
(years)
ASMR per 1000
per year of
population A
ASMR per
1000 per year
of population B
Age
distribution of
population A
Age
distribution of
population B
< 15 2 3 3000 4000
15-44 5 4 4000 5000
>44 20 20 3000 1000
Totals 10,000 10,000
• Calculate the crude death rate for each population
• Calculate the age-adjusted rate for each population
21
Ratios, proportions cont’d…
Indirect method
 This method implies the process of applying the specific rates of a
standard population to a population of interest to yield a number of
"expected" deaths.
 A common way of carrying out indirect age adjustment is to relate
the total expected deaths thus obtained to observed deaths through a
formula known as the standardized mortality ratio (SMR).
SMR = Total observed deaths in a population
Total expected deaths in that population
22
23
Ratios, proportions cont’d…
 Advantages:
 Summary rates
 Permit unbiased comparison
 Easy to interpret
 Disadvantages:
 Fictitious rates
 Absolute magnitude depends on standard population
24
Measurements of morbidity or disease
occurrence
Incidence
 the number of new cases of a disease that occur during a
specified period of time in a population at risk for
developing the disease.
IR = Number of new cases of a disease in a period of time
Population at risk during the given period of time
 It is a measure of the frequency with which an event, such as a
new case of illness, occurs in a population over a period of time.
 So, incidence is a measures of risk.
25
Measurements of morbidity cont’d…
Nevertheless, the determination of population at risk is a
major problem in the study of disease incidences.
It may require a detailed study based on:
 interviews
 medical records or
 serology for antibodies, which are very expensive and
time consuming.
Population fluctuation due to births, deaths, and migration
is another problem in the calculation of the denominator.
26
Measurements of morbidity cont’d…
Types of incidence
1. Cumulative Incidence (CI):
An incidence rate that is calculated from a population that is
more or less stable
 denominator is the population at the beginning of the time
period.
The cumulative incidence assumes that the entire population at
risk at the beginning of the study period has been followed for
the specified time interval for the development of the outcome
under investigation.
It provides an estimate of the probability, or risk, that an
individual will develop a disease during a specified period of
time.
27
Measurements of morbidity cont’d…
CI = Number of new cases during a given period of time
Total population at risk
28
Example
 Two surveys were done in the same community 12 months
apart. Of 5,000 people surveyed the first time, 25 had
antibodies for HIV.Twelve months later, 35 had antibodies,
including the original 25.
1. What is incidence of HIV at the second survey?
Example
29
 Incidence during the 12-month period:
 x = number of new positives during the 12-month period
= 35 − 25 = 10
 y = population at risk
= 5,000 − 25 = 4,975
 x/y × 10n = 10/4,975 × 1,000 = 2 per 1,000
Measurements of morbidity cont’d
30
2. Incidence Density or incidence rate:
An incidence rate whose denominator is calculated using
person-time units.
The numerator of the incidence density is the number of
new cases in the population.
The denominator, however, is the sum of each individual’s
time at risk or the sum of the time that each person remained
under observation, i.e., person – time denominator.
The time units – can be the number of cases per person – day,
person – month or person – year.
Measurements of morbidity cont’d…
Incidence density = Number of new cases during a given period x10 n
Time each person was observed,totaled for all
Basic requirements for calculating incidence rates
1. Knowledge of the health status of the study population
2. Time of Onset
3. Specification of Numerator
4. Specification of Denominator
5. Period of Observation
31
Measurements of morbidity cont’d…
32
Exposure
(+)
(-)
CI+ = 2/3
CI- = 2/3
or
ID+=2/5py
ID-= 2/10py
Years
X
X
X
X
Example
Incidence Density or incidence rate…
33
 But if individual followed yearly, some may have developed
illness or lost to follow-up in month 1, and others in months 2
through 12.
 Many researchers assume that persons develop disease, or lost
to follow-up were, on average, disease-free or under follow-
up for half the year, and thus contribute ½ year to the
denominator
 Therefore, the person followed for one year before being
found lost to follow-up 2 year contributes 1.5 person-years
 So, someone lost to follow-up in year 3, and someone
diagnosed with the disease in year 3, each contributes 2.5
years of disease-free follow-up to the denominator.
EXAMPLE
 Investigators enrolled 2,100 men in a study and followed them
over 4 years to determine the rate of heart disease.
 We assume that persons diagnosed with disease and those lost
to follow-up were disease-free for half of the year, and thus
contribute ½ year to the denominator. Calculate the incidence
rate of heart disease among this cohort.
 Initial enrolment: 2,100 men free of disease
• After 1 year: 2,000 disease-free, 0 with disease, 100 lost to
follow-up
• After 2 years: 1,900 disease-free, 1 with disease, 99 lost to
follow-up
• After 3 years: 1,100 disease-free, 7 with disease, 793 lost to
follow-up
• After 4 years: 700 disease-free, 8 with disease, 392 lost to
follow-up
1. Identify x: x = cases diagnosed = 1 + 7 + 8 = 16
2. Calculate y, the person-years of observation:
IR= 16/6400= .0025 cases per person-year or= 2.5 cases per
1,000 person-years
Alternative methods
 A second way to calculate the person-years of
observation is to turn the data around to reflect how
many people were followed for how many years, as
follows:
 700 men x 4.0 years = 2,800 person-years
 8 + 392 = 400 menx3.5 years = 1,400 person-years
 7 + 793 = 800 menx2.5 years = 2,000 person-years
 1 + 99 = 100 menx1.5 years = 150 person-years
 0 + 100 = 100 menx0.5 years = 50 person-years
 Total = 6,400 person-years of observation
Commonly used incidence rate
1.Attack Rate
 An attack rate is a variant of an incidence rate, applied to a narrowly defined
population observed for a limited time, such as during an epidemic.
 The attack rate is usually expressed as a percent.
Example
 Of 75 persons who attended a church picnic, 46 subsequently developed
gastroenteritis. Calculate the attack rate of gastroenteritis.
The attack rate is
Commonly used incidence rate…
2. Secondary Attack Rate
 A secondary attack rate is a measure of the frequency of new cases
of a disease among the contacts of known cases.
 To calculate the total number of household contacts, we usually
subtract the number of primary cases from the total number of
people residing in those households.
Example
 Seven cases of hepatitis A occurred among 70 children
attending a child care centre. Each infected child came
from a different family. The total number of persons in
the 7 affected families was 32. One incubation period
later, 5 family members of the 7 infected children also
developed hepatitis A. Calculate the attack rate in
the child care centre and the secondary attack rate
among family contacts of those cases.
Attack Rate cont…
1.Attack rate in child care centre:
x = cases of hepatitis A among children in child care centre = 7
y = number of children enrolled in the child care centre = 70
Continued…
Measurements of morbidity cont’d…
Prevalence rate
It measures the number of people in a population who have a
disease at a given time or over a specified period of time. It
includes both new and old cases.
There are two types of prevalence rates.
1. Period Prevalence rate
2. Point Prevalence rate
1. Period Prevalence rate
 Measures the proportion of a population that is affected
with a certain condition during a specified period of time.
Period PR= No.of all cases during a specific period of time
Total population
41
Measurements of morbidity cont’d…
2. Point Prevalence rate:
Measures the proportion of a population with a certain
condition at a given point in time.
Point PR= All persons with a Condition at one point in time
Total population
42
Example
Identify the type of prevalence and compute its value
for the following questions
1. A researcher found 260 individuals who have a
common cold at some point during the month of
February 2001 in a particular geographic region
with population of 3000.
2. A researcher found 260 individuals who have a
common cold in a particular geographic region with
3000 population from January 01 to February 01,
2001
Measurements of morbidity cont’d…
Uses of incidence and prevalence rates
Prevalence rates are important particularly for:
 Chronic disease studies
 Planning health facilities and manpower
 Monitoring disease control programs
 Tracking changes in disease patterns over time
Incidence rate is important as:
 A fundamental tool for etiologic studies of acute and
chronic diseases
 A direct measure of risk
44
Measurements of morbidity cont’d…
High prevalence may reflect :
 An increase in survival due to;
 change in virulence or in host factors or
 Improvement in medical care.
Low prevalence may reflect:
A rapidly fatal process
Rapid cure of disease
Low incidence
Limitations of prevalence studies
Prevalence studies favor inclusion of chronic over acute
cases.
45
Factors influencing prevalence
Example
47
 Two surveys were done of the same community 12 months
apart. Of 5,000 people surveyed the first time, 25 had
antibodies to HIV.Twelve months later, 35 had antibodies,
including the original 25.
 Calculate the prevalence at the second survey, and compare the
prevalence with the 1-year incidence.
Prevalence at the second survey:
 x = antibody positive at second survey = 35
 y = population = 5,000
 x/y × 10n = 35/5,000 × 1,000 = 7 per 1,000
Measurements of Mortality
Mortality Rates And Ratios
Mortality rates and ratios measure the occurrence of deaths in a
population using different ways.
Rates whose denominators are the total population are commonly
calculated using either
 the mid - interval population or
 the average population.
 This is done because population size fluctuates over time due to
births, deaths and migration.
48
Measurements of Mortality cont’d…
CDR =Total no. of deaths during a given time interval X 103
Estimated mid interval population
Age-SMR= No.of deaths in a specific age group in a given time X103
Estimated mid interval population of sp.age group
Sex-SMR= No.of deaths in a specific sex during a given time X 103
Estimated mid interval population of same sex
49
Measurements of Mortality cont’d…
Cause- SMR= No.of deaths from a specific cause during a given time X 103
Estimated mid interval population at risk
Proportionate = No.of deaths from a sp.cause during a given time x102
mortality ratio Total no.of deaths from all causes in the same time
Case Fatality = No. of deaths from a sp. disease during a given time x 102
Rate (CFR) No. of cases of that disease during the same time
50
Measurements of Mortality cont’d…
Fetal Death = No.of deaths of >=28 wks gestation reported during a given time
Rate No.of deaths of >=28 wks gestation and live births in the same time
Perinatal = No.of deaths of >=28 wks gestation + no.of deaths under 7 days
MR No.of deaths of >=28 wks gestation+ no.of live births during the same time
Neonatal MR= No.of deaths <28 days of age during a given time x 103
No.of live births reported during the same time
51
Measurements of Mortality cont’d…
Infant MR= No. of deaths under 1 yr of age during a given time X 103
No. of live births reported during the same time interval
Child MR= No.of deaths of 1-4 yrs of age during a given time X 103
Mid-interval population of same age at same time
<5 MR= No.of deaths of 0-4 yrs of age during a given time X 103
Mid-interval population of the same age at same time
52
Measurements of Mortality cont’d…
MM Ratio = No.of pregnancy associated deaths in a given time x 105
No.of live births in the same time
Other Commonly Used Indices Of Health
Crude Birth Rate = No. of live births reported during a time interval X 103
Estimated mid-interval population
General Fertility Rate = No. of live births reported during a given time interval X 103
Estimated no. of women 15-44 years of age at mid interval
53
2/15/2023
survival and predictors ofTb/HIV co-
infection.....Birtukan
54

2.Measurements.pdf

  • 1.
    By ADANE ASEFA (BSc, MPHE , Ass Prof ) Measurement in Epidemiology 1
  • 2.
    OBJECTIVES At the endof this chapter the student is expected to:  Describe the principles of measurement in epidemiology  Explain how to measure health and health related events in a given population  Calculate different morbidity and mortality measures 2
  • 3.
    Introduction 3  Epidemiologists studythe distribution and determinants of disease frequency in human populations to control health problems.  Thus, the objectives of epidemiology are to determine the extent of disease in a population,identify patterns and trends in disease occurrence, identify the causes of disease, and evaluate the effectiveness of prevention and treatment activities.  Measuring how often a disease arises in a population is usually the first step in achieving these goals.
  • 4.
    Measurement of health Healthstatus of a community is assessed by the collection, analysis and interpretation of data on : Illness (morbidity) Death (mortality) Disability and Utilization of health services 4
  • 5.
    Measurement of health… 5 Epidemiologists must always consider three factors when they measure how commonly a disease occurs in a group of people: 1. the number of people who are affected by the disease, 2. the size of the population from which the cases of disease arise, and 3. the length of time that the population is followed.
  • 6.
    Measurement of healthcont’d… A.Absolute Number  The most basic measure of disease frequency is a simple count of affected individuals.  Such information is useful for public health planners and administrators for proper allocation of health care.  But, it does not provide information about the size of the source population from which affected individuals were counted. - We can not describe and to compare groups in a meaningful and useful way 6
  • 7.
    Measurement of healthcont’d… B. Ratios, proportions, and rates (Measures of comparison) Ratio  A ratio quantifies the magnitude of one occurrence or condition to another.  It expresses the relationship between two numbers in the form of  x/y X k or  x:y  Example: - males-to-females ration - MMR  The entities represented by the two numbers are not required to be related to one another. 7
  • 8.
    Ratios, proportions cont’d… Proportion It quantifies occurrences in relation to the populations in which these occurrences take place.  It is a specific type of ratio in which the numerator is included in the denominator and the result is expressed as a percentage or fraction.  Example:The proportion of all births that was male Male births X 100 Male + Female births 8
  • 9.
    Activity 9  During thefirst 9 months of national surveillance for HIV, CDC received 1,068 case reports which specified sex; 893 cases were in females, 175 in males. A. Calculate the female-to-male ratio for HIV B. Calculate the proportion of HIV cases that are male. Answer A. 893/175 = 5.1 to 1 or 510 females per 100 males Thus, there were just over 5 females HIV patients for each male HIV patient reported to CDC. B. 175/1,068 =0.16/1 or 16% Thus, about 16 cases out of 100 reported HIV cases were males.
  • 10.
    Ratios, proportions cont’d… Rate Rateis a special form of proportion that includes the dimension of time. It is a measure of the frequency with which an event occurs in a defined population over a specified period of time. It expresses probability or risk of disease in a defined population over a specified period of time Hence, it is considered to be a basic measure of disease occurrence. 10
  • 11.
    Ratios, proportions cont’d… Typesof rates: There are three types of rates: Crude rates Specific rates Adjusted rates Rate = Number of events in a specific period x k Popn at risk of these events in a specified Period 11
  • 12.
    Ratios, proportions cont’d… Cruderates:  Rate based on the actual number of events (births, deaths, diseases) in the total population over a given time period.  Shows the frequency of events through out the entire population  The crude rates that are widely used are:  The crude birth rate (CBR) and  The crude death rate (CDR).  These rates refer to the total population, and hence, may obscure the possible difference in risk among subgroups of the total population.  Example: the risk of death differs among different age groups 12
  • 13.
    Ratios, proportions cont’d… Advantages:  Actual summary rates  Calculable from minimum information  Widely used despite limitations  Disadvantages:  Difficult to interpret due to variation in composition (e.g. age)  Obscure significant differences in risk between subgroups. 13
  • 14.
    Ratios, proportions cont’d… Specificrates  Specific rates apply to specific subgroups in the population, such as a specific age group, sex, occupation, marital status, etc.  Except for cause-specific rates, the denominator should be the population in that specific subgroup  As a result, specific rates do not add up to a crude rate. 14
  • 15.
    Ratios, proportions cont’d… Example: Infant Mortality Rate (IMR), Neonatal Mortality Rate (NMR), Maternal Mortality Rate (MMR)  Advantages:  The rates apply to homogenous subgroups  The rates are detailed and useful for epidemiological and public health purposes.  Disadvantages:  It is cumbersome to compare many subgroups of two or more populations 15
  • 16.
    standardized or adjustedrate 16  Crude rates are summary measures of disease frequency that are based on the raw data.  It is difficult to interpret absolute and relative measures of comparison that are based on crude rates when the compared groups differ on a characteristic that affects the rate of disease (such as age, gender, or race).
  • 17.
    standardized or adjustedrate 17  What explains the difference between the crude mortality rates of the two states? Probably due to age?
  • 18.
    Ratios, proportions cont’d… Adjustedrates  Are summary rates that have undergone statistical transformation, to permit fair comparison between groups For example: age needs adjustment due to its marked effect on both diseases and death.  When comparing the crude death rates of two or more places, it is impossible to know whether the difference is due to age composition, age specific death rate or both.  In Age adjusted rates, the effect of age composition is artificially removed. 18
  • 19.
    Ratios, proportions cont’d… Methodsof adjustment  Direct method  The adjusted rate is derived by applying the category specific rates observed in each of the populations to a single standard population.  Requires the following information: (1) age-specific rates in each group (in this case, each state) and (2) age structure of a “standard” population  age-adjusted rate:  Use a standard population for each age group of both areas.  Note that the populations of the groups to be compared have to be equal when standardizing.  you may use one population eitherA or B as a standard or combine the two population. 19
  • 20.
    Ratios, proportions cont’d… Stepof direct method 1. Multiply the ASMR in each age group by the standard population; this will give the annual number of deaths occurring in the specific age group. 2. Add the number of deaths occurring in each age group to obtain the total number of deaths 3. Then divide the total number of deaths by the total standard population.  See next example: 20
  • 21.
    Age-specific mortality rateand age distribution of two populations, A and B. Age- group (years) ASMR per 1000 per year of population A ASMR per 1000 per year of population B Age distribution of population A Age distribution of population B < 15 2 3 3000 4000 15-44 5 4 4000 5000 >44 20 20 3000 1000 Totals 10,000 10,000 • Calculate the crude death rate for each population • Calculate the age-adjusted rate for each population 21
  • 22.
    Ratios, proportions cont’d… Indirectmethod  This method implies the process of applying the specific rates of a standard population to a population of interest to yield a number of "expected" deaths.  A common way of carrying out indirect age adjustment is to relate the total expected deaths thus obtained to observed deaths through a formula known as the standardized mortality ratio (SMR). SMR = Total observed deaths in a population Total expected deaths in that population 22
  • 23.
  • 24.
    Ratios, proportions cont’d… Advantages:  Summary rates  Permit unbiased comparison  Easy to interpret  Disadvantages:  Fictitious rates  Absolute magnitude depends on standard population 24
  • 25.
    Measurements of morbidityor disease occurrence Incidence  the number of new cases of a disease that occur during a specified period of time in a population at risk for developing the disease. IR = Number of new cases of a disease in a period of time Population at risk during the given period of time  It is a measure of the frequency with which an event, such as a new case of illness, occurs in a population over a period of time.  So, incidence is a measures of risk. 25
  • 26.
    Measurements of morbiditycont’d… Nevertheless, the determination of population at risk is a major problem in the study of disease incidences. It may require a detailed study based on:  interviews  medical records or  serology for antibodies, which are very expensive and time consuming. Population fluctuation due to births, deaths, and migration is another problem in the calculation of the denominator. 26
  • 27.
    Measurements of morbiditycont’d… Types of incidence 1. Cumulative Incidence (CI): An incidence rate that is calculated from a population that is more or less stable  denominator is the population at the beginning of the time period. The cumulative incidence assumes that the entire population at risk at the beginning of the study period has been followed for the specified time interval for the development of the outcome under investigation. It provides an estimate of the probability, or risk, that an individual will develop a disease during a specified period of time. 27
  • 28.
    Measurements of morbiditycont’d… CI = Number of new cases during a given period of time Total population at risk 28 Example  Two surveys were done in the same community 12 months apart. Of 5,000 people surveyed the first time, 25 had antibodies for HIV.Twelve months later, 35 had antibodies, including the original 25. 1. What is incidence of HIV at the second survey?
  • 29.
    Example 29  Incidence duringthe 12-month period:  x = number of new positives during the 12-month period = 35 − 25 = 10  y = population at risk = 5,000 − 25 = 4,975  x/y × 10n = 10/4,975 × 1,000 = 2 per 1,000
  • 30.
    Measurements of morbiditycont’d 30 2. Incidence Density or incidence rate: An incidence rate whose denominator is calculated using person-time units. The numerator of the incidence density is the number of new cases in the population. The denominator, however, is the sum of each individual’s time at risk or the sum of the time that each person remained under observation, i.e., person – time denominator. The time units – can be the number of cases per person – day, person – month or person – year.
  • 31.
    Measurements of morbiditycont’d… Incidence density = Number of new cases during a given period x10 n Time each person was observed,totaled for all Basic requirements for calculating incidence rates 1. Knowledge of the health status of the study population 2. Time of Onset 3. Specification of Numerator 4. Specification of Denominator 5. Period of Observation 31
  • 32.
    Measurements of morbiditycont’d… 32 Exposure (+) (-) CI+ = 2/3 CI- = 2/3 or ID+=2/5py ID-= 2/10py Years X X X X Example
  • 33.
    Incidence Density orincidence rate… 33  But if individual followed yearly, some may have developed illness or lost to follow-up in month 1, and others in months 2 through 12.  Many researchers assume that persons develop disease, or lost to follow-up were, on average, disease-free or under follow- up for half the year, and thus contribute ½ year to the denominator  Therefore, the person followed for one year before being found lost to follow-up 2 year contributes 1.5 person-years  So, someone lost to follow-up in year 3, and someone diagnosed with the disease in year 3, each contributes 2.5 years of disease-free follow-up to the denominator.
  • 34.
    EXAMPLE  Investigators enrolled2,100 men in a study and followed them over 4 years to determine the rate of heart disease.  We assume that persons diagnosed with disease and those lost to follow-up were disease-free for half of the year, and thus contribute ½ year to the denominator. Calculate the incidence rate of heart disease among this cohort.  Initial enrolment: 2,100 men free of disease • After 1 year: 2,000 disease-free, 0 with disease, 100 lost to follow-up • After 2 years: 1,900 disease-free, 1 with disease, 99 lost to follow-up • After 3 years: 1,100 disease-free, 7 with disease, 793 lost to follow-up • After 4 years: 700 disease-free, 8 with disease, 392 lost to follow-up 1. Identify x: x = cases diagnosed = 1 + 7 + 8 = 16 2. Calculate y, the person-years of observation: IR= 16/6400= .0025 cases per person-year or= 2.5 cases per 1,000 person-years
  • 35.
    Alternative methods  Asecond way to calculate the person-years of observation is to turn the data around to reflect how many people were followed for how many years, as follows:  700 men x 4.0 years = 2,800 person-years  8 + 392 = 400 menx3.5 years = 1,400 person-years  7 + 793 = 800 menx2.5 years = 2,000 person-years  1 + 99 = 100 menx1.5 years = 150 person-years  0 + 100 = 100 menx0.5 years = 50 person-years  Total = 6,400 person-years of observation
  • 36.
    Commonly used incidencerate 1.Attack Rate  An attack rate is a variant of an incidence rate, applied to a narrowly defined population observed for a limited time, such as during an epidemic.  The attack rate is usually expressed as a percent. Example  Of 75 persons who attended a church picnic, 46 subsequently developed gastroenteritis. Calculate the attack rate of gastroenteritis. The attack rate is
  • 37.
    Commonly used incidencerate… 2. Secondary Attack Rate  A secondary attack rate is a measure of the frequency of new cases of a disease among the contacts of known cases.  To calculate the total number of household contacts, we usually subtract the number of primary cases from the total number of people residing in those households.
  • 38.
    Example  Seven casesof hepatitis A occurred among 70 children attending a child care centre. Each infected child came from a different family. The total number of persons in the 7 affected families was 32. One incubation period later, 5 family members of the 7 infected children also developed hepatitis A. Calculate the attack rate in the child care centre and the secondary attack rate among family contacts of those cases.
  • 39.
    Attack Rate cont… 1.Attackrate in child care centre: x = cases of hepatitis A among children in child care centre = 7 y = number of children enrolled in the child care centre = 70
  • 40.
  • 41.
    Measurements of morbiditycont’d… Prevalence rate It measures the number of people in a population who have a disease at a given time or over a specified period of time. It includes both new and old cases. There are two types of prevalence rates. 1. Period Prevalence rate 2. Point Prevalence rate 1. Period Prevalence rate  Measures the proportion of a population that is affected with a certain condition during a specified period of time. Period PR= No.of all cases during a specific period of time Total population 41
  • 42.
    Measurements of morbiditycont’d… 2. Point Prevalence rate: Measures the proportion of a population with a certain condition at a given point in time. Point PR= All persons with a Condition at one point in time Total population 42
  • 43.
    Example Identify the typeof prevalence and compute its value for the following questions 1. A researcher found 260 individuals who have a common cold at some point during the month of February 2001 in a particular geographic region with population of 3000. 2. A researcher found 260 individuals who have a common cold in a particular geographic region with 3000 population from January 01 to February 01, 2001
  • 44.
    Measurements of morbiditycont’d… Uses of incidence and prevalence rates Prevalence rates are important particularly for:  Chronic disease studies  Planning health facilities and manpower  Monitoring disease control programs  Tracking changes in disease patterns over time Incidence rate is important as:  A fundamental tool for etiologic studies of acute and chronic diseases  A direct measure of risk 44
  • 45.
    Measurements of morbiditycont’d… High prevalence may reflect :  An increase in survival due to;  change in virulence or in host factors or  Improvement in medical care. Low prevalence may reflect: A rapidly fatal process Rapid cure of disease Low incidence Limitations of prevalence studies Prevalence studies favor inclusion of chronic over acute cases. 45
  • 46.
  • 47.
    Example 47  Two surveyswere done of the same community 12 months apart. Of 5,000 people surveyed the first time, 25 had antibodies to HIV.Twelve months later, 35 had antibodies, including the original 25.  Calculate the prevalence at the second survey, and compare the prevalence with the 1-year incidence. Prevalence at the second survey:  x = antibody positive at second survey = 35  y = population = 5,000  x/y × 10n = 35/5,000 × 1,000 = 7 per 1,000
  • 48.
    Measurements of Mortality MortalityRates And Ratios Mortality rates and ratios measure the occurrence of deaths in a population using different ways. Rates whose denominators are the total population are commonly calculated using either  the mid - interval population or  the average population.  This is done because population size fluctuates over time due to births, deaths and migration. 48
  • 49.
    Measurements of Mortalitycont’d… CDR =Total no. of deaths during a given time interval X 103 Estimated mid interval population Age-SMR= No.of deaths in a specific age group in a given time X103 Estimated mid interval population of sp.age group Sex-SMR= No.of deaths in a specific sex during a given time X 103 Estimated mid interval population of same sex 49
  • 50.
    Measurements of Mortalitycont’d… Cause- SMR= No.of deaths from a specific cause during a given time X 103 Estimated mid interval population at risk Proportionate = No.of deaths from a sp.cause during a given time x102 mortality ratio Total no.of deaths from all causes in the same time Case Fatality = No. of deaths from a sp. disease during a given time x 102 Rate (CFR) No. of cases of that disease during the same time 50
  • 51.
    Measurements of Mortalitycont’d… Fetal Death = No.of deaths of >=28 wks gestation reported during a given time Rate No.of deaths of >=28 wks gestation and live births in the same time Perinatal = No.of deaths of >=28 wks gestation + no.of deaths under 7 days MR No.of deaths of >=28 wks gestation+ no.of live births during the same time Neonatal MR= No.of deaths <28 days of age during a given time x 103 No.of live births reported during the same time 51
  • 52.
    Measurements of Mortalitycont’d… Infant MR= No. of deaths under 1 yr of age during a given time X 103 No. of live births reported during the same time interval Child MR= No.of deaths of 1-4 yrs of age during a given time X 103 Mid-interval population of same age at same time <5 MR= No.of deaths of 0-4 yrs of age during a given time X 103 Mid-interval population of the same age at same time 52
  • 53.
    Measurements of Mortalitycont’d… MM Ratio = No.of pregnancy associated deaths in a given time x 105 No.of live births in the same time Other Commonly Used Indices Of Health Crude Birth Rate = No. of live births reported during a time interval X 103 Estimated mid-interval population General Fertility Rate = No. of live births reported during a given time interval X 103 Estimated no. of women 15-44 years of age at mid interval 53
  • 54.
    2/15/2023 survival and predictorsofTb/HIV co- infection.....Birtukan 54