Tools of epidemiology& Basic
mortality measurements
Dr. Laila Afzal
Assistant Professor
Department of Community Medicine, SMDC
2.
• At theend of this lecture, students should be able to:
1. Recall tools of epidemiology and basic measurements of
mortality
2. Describe limitations and uses of mortality data
3. Calculate and interpret crude, specific and standardized
mortality rates
3.
Measurements in Epidemiology:
•Measurement of mortality
• Measurement of morbidity
• Measurement of disability
• Measurement of natality
• Measurement of the
presence, absence or
distribution of the
characteristic or attributes of
the disease
• Measurement of medical
needs, health care facilities,
utilization of health services
and other health-related
events
• Measurement of the
presence, absence or
distribution of the
environmental and other
factors suspected of causing
the disease
• Measurement of
demographic variables.
Rate:
• A ratemeasures the occurrence of some particular event
(development of disease or the occurrence of death) in a
defined population during a given time period.
• It is a statement of the risk of developing a condition.
• It indicates the change in some event that takes place in a
population over a period of time.
6.
Rate:
• The timedimension is usually a calendar year.
• The rate is expressed per 1000 or some other round figure
(10,000; 100,000) selected according to the convenience or
convention to avoid fractions.
7.
Rate:
• Death rate=number of deaths in one year in a
population/Midyear population x 1,000
• A rate comprises the following elements - numerator,
denominator, time specification and multiplier.
8.
• Numerator refersto the number of times an event (e.g.,
sickness, birth, death, episodes of sickness) has occurred in a
population, during a specified time-period.
• The numerator is a component of the denominator in
calculating a rate, but not in a ratio.
9.
• The epidemiologisthas to choose an appropriate
denominator while calculating a rate.
• It may be (a) related to the population, or (b) related to the
total events.
10.
• Denominators relatedto population:
• Mid-year population: The mid-point refers to the population
estimated as on the first of July of an year.
• Population at risk: the term is applied to all those to whom
an event could have happened whether it did or not. For
example, if we are determining the rate of accidents for a
town, the population at risk is all the people in the town. But
sometimes, it may be necessary to exclude people because
they are not at risk, as for example, in food poisoning, only
those who ate the food are at risk of becoming ill.
11.
• Person-time: Themost frequently used person- time is
person- years. For example. if 10 persons remain in the study
for 10 years, there are said to be 100 person-years of
observation.
• The denominator may be subgroups of a population, e.g.,
age, sex, occupation, social class, etc.
12.
• Denominators relatedto total events :
• For example:
• Infant mortality rate= total number of deaths of infants in a
year/ total live births x 1,000
13.
• Crude rates:The actual observed rates such as the birth and
death rates, also known as unstandardized rates.
• Specific rates: These are the actual observed rates due to
specific causes (e.g., tuberculosis); or occurring in specific
groups (e.g., age-sex groups) or during specific time periods
(e.g., annual, monthly or weekly rates).
• Standardized rates
14.
Ratio:
• A ratioexpresses a relation in size between two random
quantities.
• The numerator is not a component of the denominator.
• Broadly, ratio is the result of dividing one quantity by
another.
• It is expressed in the form of x : y or x/y
15.
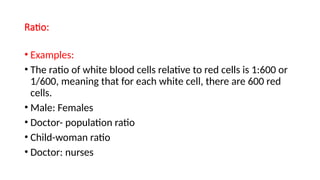
Ratio:
• Examples:
• Theratio of white blood cells relative to red cells is 1:600 or
1/600, meaning that for each white cell, there are 600 red
cells.
• Male: Females
• Doctor- population ratio
• Child-woman ratio
• Doctor: nurses
16.
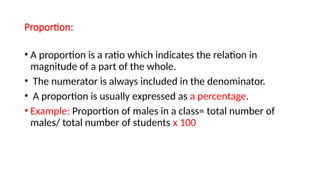
Proportion:
• A proportionis a ratio which indicates the relation in
magnitude of a part of the whole.
• The numerator is always included in the denominator.
• A proportion is usually expressed as a percentage.
• Example: Proportion of males in a class= total number of
males/ total number of students x 100
17.
Measurement of mortality
•The basis of mortality data is the Death Certificate.
• For ensuring national and international comparability, it is
very necessary to have a uniform and standardized system of
recording and classifying deaths.
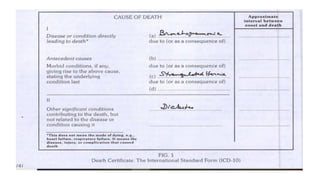
19.
• Part Ideals with the immediate cause of death and the
underlying cause.
• The causes of death to be entered on the medical certificate
of cause of death are all those diseases, morbid conditions,
or injuries that either resulted in or contributed to death and
circumstances of the accident or violence which produced
any such injuries.
20.
• The underlyingcause of death is (1) the disease or injury that
initiated the train of events leading to death or (2) the
circumstances of the accident or violence that produced the
fatal injury."
21.
Limitations of mortalitydata:
• Incomplete reporting of deaths
• Lack of accuracy: due to difficulties as lack of diagnostic
evidence, inexperience on the part of the certifying doctor
and absence of postmortem which may be important in
deciding the cause of death
• Lack of uniformity in collection of data
• Choosing a single cause of death: Most countries tabulate
mortality data only according to the underlying cause and
other conditions which contribute to the patient's death are
not tabulated, and valuable information is thereby lost.
22.
• Changing codingsystems and changing fashions in diagnosis
may affect the validity
• Mortality statistics are virtually useless, if the disease is
associated with low fatality (e.g., mental diseases, arthritis).
23.
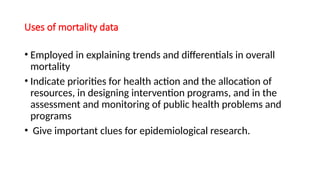
Uses of mortalitydata
• Employed in explaining trends and differentials in overall
mortality
• Indicate priorities for health action and the allocation of
resources, in designing intervention programs, and in the
assessment and monitoring of public health problems and
programs
• Give important clues for epidemiological research.
24.
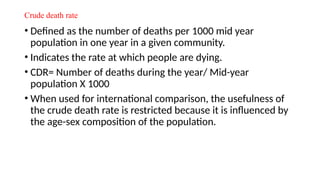
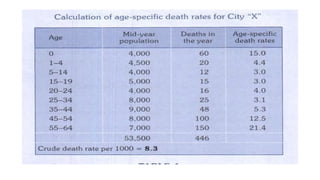
Crude death rate
•Defined as the number of deaths per 1000 mid year
population in one year in a given community.
• Indicates the rate at which people are dying.
• CDR= Number of deaths during the year/ Mid-year
population X 1000
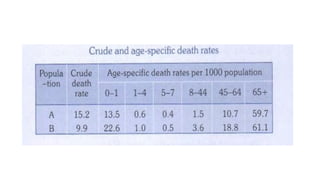
• When used for international comparison, the usefulness of
the crude death rate is restricted because it is influenced by
the age-sex composition of the population.
26.
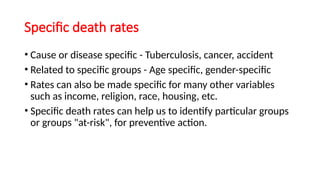
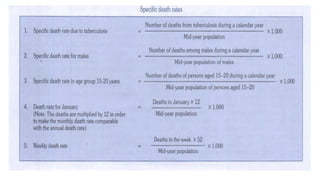
Specific death rates
•Cause or disease specific - Tuberculosis, cancer, accident
• Related to specific groups - Age specific, gender-specific
• Rates can also be made specific for many other variables
such as income, religion, race, housing, etc.
• Specific death rates can help us to identify particular groups
or groups "at-risk", for preventive action.
28.
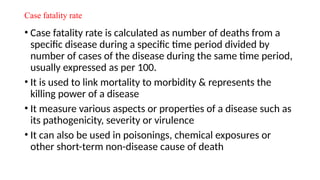
Case fatality rate
•Case fatality rate is calculated as number of deaths from a
specific disease during a specific time period divided by
number of cases of the disease during the same time period,
usually expressed as per 100.
• It is used to link mortality to morbidity & represents the
killing power of a disease
• It measure various aspects or properties of a disease such as
its pathogenicity, severity or virulence
• It can also be used in poisonings, chemical exposures or
other short-term non-disease cause of death
29.
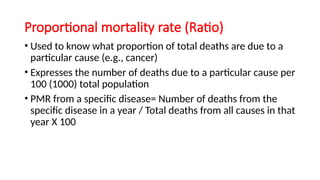
Proportional mortality rate(Ratio)
• Used to know what proportion of total deaths are due to a
particular cause (e.g., cancer)
• Expresses the number of deaths due to a particular cause per
100 (1000) total population
• PMR from a specific disease= Number of deaths from the
specific disease in a year / Total deaths from all causes in that
year X 100
30.
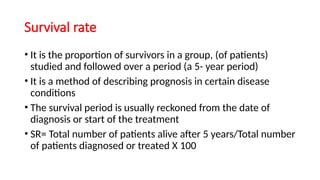
Survival rate
• Itis the proportion of survivors in a group, (of patients)
studied and followed over a period (a 5- year period)
• It is a method of describing prognosis in certain disease
conditions
• The survival period is usually reckoned from the date of
diagnosis or start of the treatment
• SR= Total number of patients alive after 5 years/Total number
of patients diagnosed or treated X 100
31.
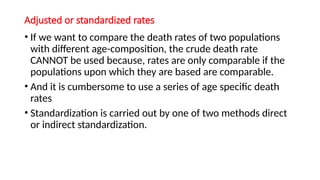
Adjusted or standardizedrates
• If we want to compare the death rates of two populations
with different age-composition, the crude death rate
CANNOT be used because, rates are only comparable if the
populations upon which they are based are comparable.
• And it is cumbersome to use a series of age specific death
rates
• Standardization is carried out by one of two methods direct
or indirect standardization.
32.
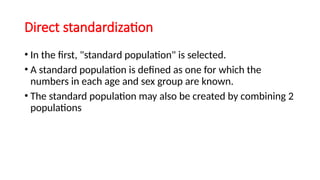
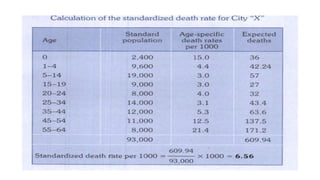
Direct standardization
• Inthe first, "standard population" is selected.
• A standard population is defined as one for which the
numbers in each age and sex group are known.
• The standard population may also be created by combining 2
populations
33.
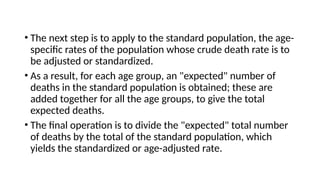
• The nextstep is to apply to the standard population, the age-
specific rates of the population whose crude death rate is to
be adjusted or standardized.
• As a result, for each age group, an "expected" number of
deaths in the standard population is obtained; these are
added together for all the age groups, to give the total
expected deaths.
• The final operation is to divide the "expected" total number
of deaths by the total of the standard population, which
yields the standardized or age-adjusted rate.
37.
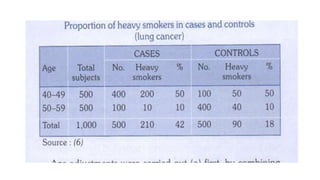
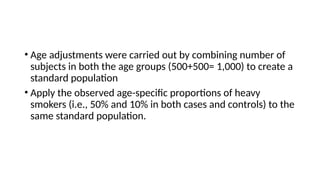
• Age adjustmentswere carried out by combining number of
subjects in both the age groups (500+500= 1,000) to create a
standard population
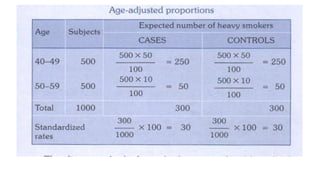
• Apply the observed age-specific proportions of heavy
smokers (i.e., 50% and 10% in both cases and controls) to the
same standard population.
39.
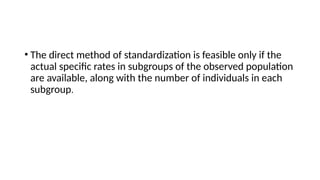
• The directmethod of standardization is feasible only if the
actual specific rates in subgroups of the observed population
are available, along with the number of individuals in each
subgroup.
40.
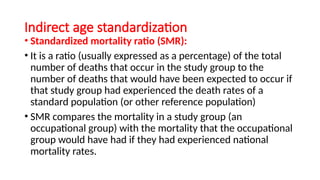
Indirect age standardization
•Standardized mortality ratio (SMR):
• It is a ratio (usually expressed as a percentage) of the total
number of deaths that occur in the study group to the
number of deaths that would have been expected to occur if
that study group had experienced the death rates of a
standard population (or other reference population)
• SMR compares the mortality in a study group (an
occupational group) with the mortality that the occupational
group would have had if they had experienced national
mortality rates.
41.
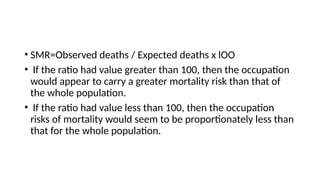
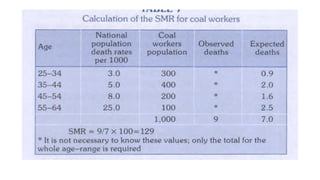
• SMR=Observed deaths/ Expected deaths x lOO
• If the ratio had value greater than 100, then the occupation
would appear to carry a greater mortality risk than that of
the whole population.
• If the ratio had value less than 100, then the occupation
risks of mortality would seem to be proportionately less than
that for the whole population.
43.
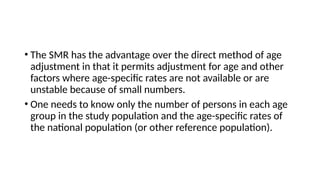
• The SMRhas the advantage over the direct method of age
adjustment in that it permits adjustment for age and other
factors where age-specific rates are not available or are
unstable because of small numbers.
• One needs to know only the number of persons in each age
group in the study population and the age-specific rates of
the national population (or other reference population).
44.
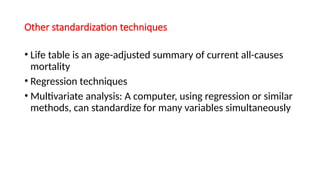
Other standardization techniques
•Life table is an age-adjusted summary of current all-causes
mortality
• Regression techniques
• Multivariate analysis: A computer, using regression or similar
methods, can standardize for many variables simultaneously
45.
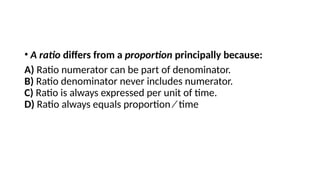
• A ratiodiffers from a proportion principally because:
A) Ratio numerator can be part of denominator.
B) Ratio denominator never includes numerator.
C) Ratio is always expressed per unit of time.
D) Ratio always equals proportion ⁄ time
46.
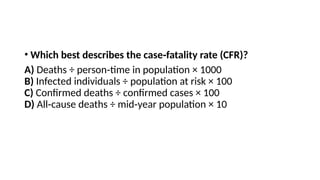
• Which bestdescribes the case fatality rate (CFR)?
‑
A) Deaths ÷ person time in population × 1000
‑
B) Infected individuals ÷ population at risk × 100
C) Confirmed deaths ÷ confirmed cases × 100
D) All cause deaths ÷ mid year population × 10
‑ ‑
47.
• The indicatordefined as (deaths due to specific cause ÷
total deaths from all causes) × 100 is:
A) Cause specific mortality rate
‑
B) Disease specific incidence rate
‑
C) Crude death rate
D) Proportionate mortality rate
48.
• A causespecific death rate
‑ is calculated as:
A. Total deaths ÷ total population × constant
B. Deaths due to one cause ÷ total number of cases of that
cause × 1000
C. Deaths due to one cause ÷ total mid year population × 1000
‑
D. Expected deaths ÷ observed deaths
49.
• The mainadvantage of using age adjusted (standardized)
‑
death rates over the crude death rate is that they:
A. Account for differences in age structure across populations
B. Are easier to calculate
C. Always yield lower numeric values than crude rates
D. Are based on observed, not expected, deaths
50.
• Which methodis typically used when age specific rates are
‑
unstable or unavailable, and yields a standardized mortality
ratio (SMR)?
A. Direct standardization
B. Indirect standardization
C. Calculation of cause specific crude rate
‑
D. Adjustment using mid year population only
‑