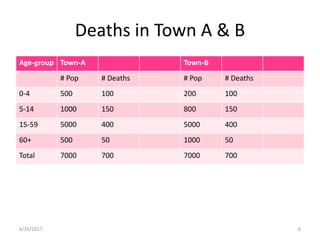
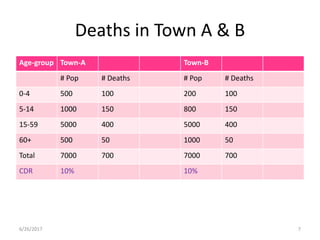
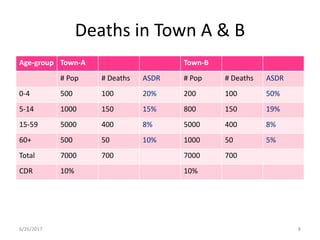
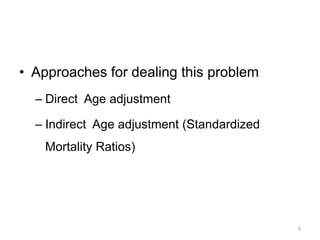
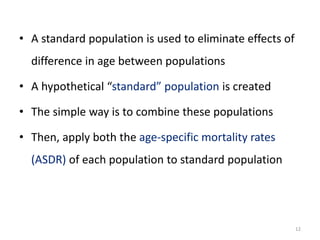
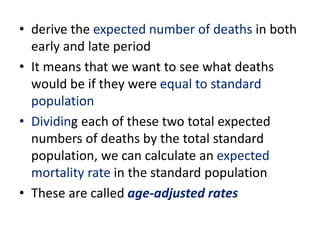
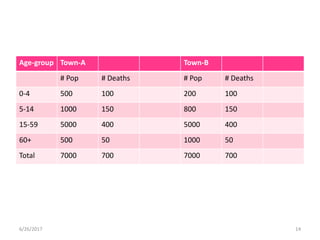
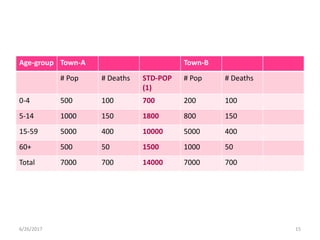
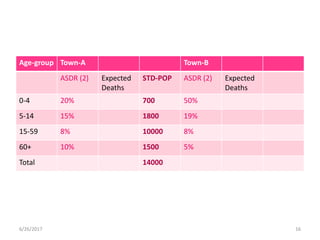
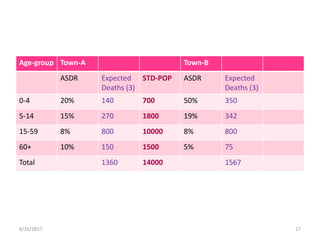
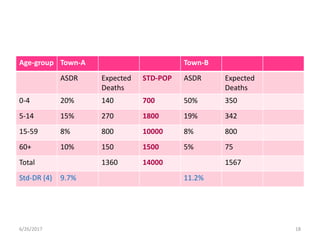
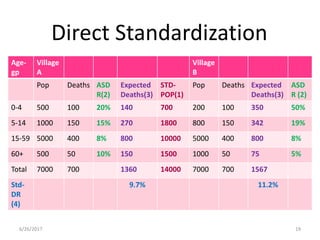
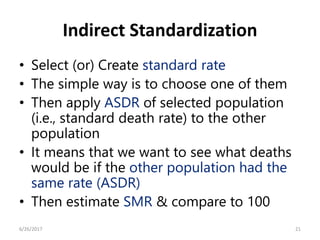
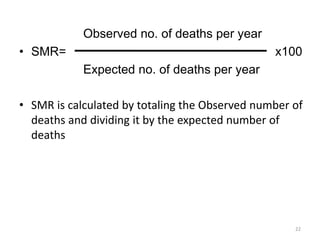
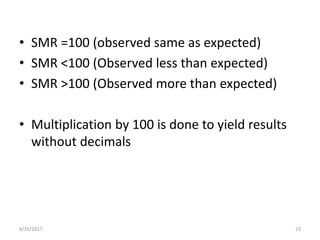
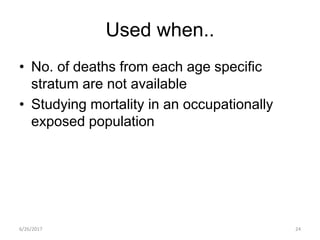
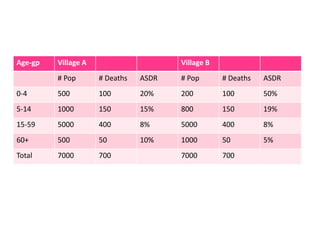
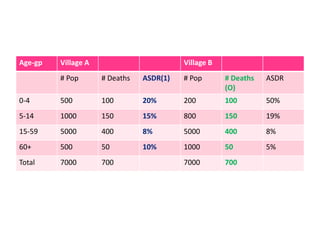
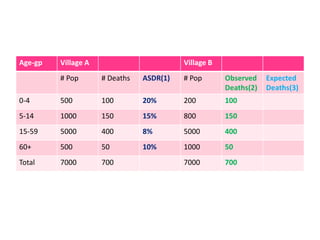
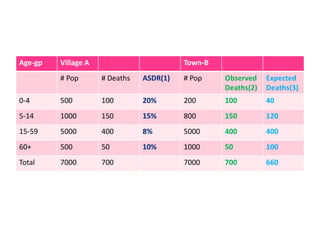
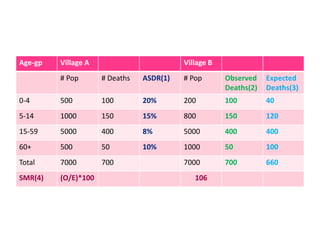
STANDARDIZATION
Dr. Win Aye Hlaing
Lecturer
Department of Epidemiology
University of Public Health, Yangon
6/26/2017 1
Comparing mortality in different populations
• Mortality rates for white and black
residents of Baltimore in 1965
• Any comments?
2
Race Mortality per 1000 pop:
White 14.3
Black 10.2
Death rates by age and race,
Baltimore City, 1965
• overall mortality (also called crude or unadjusted
mortality) is higher in whites than in blacks
• each age-specific group, mortality is higher in
blacks than in whites
3
Death rates by age per 1000 pop:
Race All ages <1 1-4 5-17 18-44 45-64 >65
White 14.3 23.9 0.7 0.4 2.5 15.2 69.3
BLack 10.2 31.3 1.6 0.6 4.8 22.6 75.9
Different Rates
• Crude
• Specific
• Standardized
6/26/2017 4
Crude Death Rate
&
Age Specific Death Rate
6/26/2017 5
Deaths in Town A & B
Age-group Town-A Town-B
# Pop # Deaths # Pop # Deaths
0-4 500 100 200 100
5-14 1000 150 800 150
15-59 5000 400 5000 400
60+ 500 50 1000 50
Total 7000 700 7000 700
6/26/2017 6
Deaths in Town A & B
Age-group Town-A Town-B
# Pop # Deaths # Pop # Deaths
0-4 500 100 200 100
5-14 1000 150 800 150
15-59 5000 400 5000 400
60+ 500 50 1000 50
Total 7000 700 7000 700
CDR 10% 10%
6/26/2017 7
Deaths in Town A & B
Age-group Town-A Town-B
# Pop # Deaths ASDR # Pop # Deaths ASDR
0-4 500 100 20% 200 100 50%
5-14 1000 150 15% 800 150 19%
15-59 5000 400 8% 5000 400 8%
60+ 500 50 10% 1000 50 5%
Total 7000 700 7000 700
CDR 10% 10%
6/26/2017 8
• Approaches for dealing this problem
– Direct Age adjustment
– Indirect Age adjustment (Standardized
Mortality Ratios)
9
Standardized Rate
6/26/2017 10
I. Direct Standardization
• A standard population is used to eliminate effects of
difference in age between populations
• A hypothetical “standard” population is created
• The simple way is to combine these populations
• Then, apply both the age-specific mortality rates
(ASDR) of each population to standard population
12
• derive the expected number of deaths in both
early and late period
• It means that we want to see what deaths
would be if they were equal to standard
population
• Dividing each of these two total expected
numbers of deaths by the total standard
population, we can calculate an expected
mortality rate in the standard population
• These are called age-adjusted rates
Age-group Town-A Town-B
# Pop # Deaths # Pop # Deaths
0-4 500 100 200 100
5-14 1000 150 800 150
15-59 5000 400 5000 400
60+ 500 50 1000 50
Total 7000 700 7000 700
6/26/2017 14
Age-group Town-A Town-B
# Pop # Deaths STD-POP
(1)
# Pop # Deaths
0-4 500 100 700 200 100
5-14 1000 150 1800 800 150
15-59 5000 400 10000 5000 400
60+ 500 50 1500 1000 50
Total 7000 700 14000 7000 700
6/26/2017 15
Age-group Town-A Town-B
ASDR (2) Expected
Deaths
STD-POP ASDR (2) Expected
Deaths
0-4 20% 700 50%
5-14 15% 1800 19%
15-59 8% 10000 8%
60+ 10% 1500 5%
Total 14000
6/26/2017 16
Age-group Town-A Town-B
ASDR Expected
Deaths (3)
STD-POP ASDR Expected
Deaths (3)
0-4 20% 140 700 50% 350
5-14 15% 270 1800 19% 342
15-59 8% 800 10000 8% 800
60+ 10% 150 1500 5% 75
Total 1360 14000 1567
6/26/2017 17
Age-group Town-A Town-B
ASDR Expected
Deaths
STD-POP ASDR Expected
Deaths
0-4 20% 140 700 50% 350
5-14 15% 270 1800 19% 342
15-59 8% 800 10000 8% 800
60+ 10% 150 1500 5% 75
Total 1360 14000 1567
Std-DR (4) 9.7% 11.2%
6/26/2017 18
6/26/2017 19
Age-
gp
Village
A
Village
B
Pop Deaths ASD
R(2)
Expected
Deaths(3)
STD-
POP(1)
Pop Deaths Expected
Deaths(3)
ASD
R (2)
0-4 500 100 20% 140 700 200 100 350 50%
5-14 1000 150 15% 270 1800 800 150 342 19%
15-59 5000 400 8% 800 10000 5000 400 800 8%
60+ 500 50 10% 150 1500 1000 50 75 5%
Total 7000 700 1360 14000 7000 700 1567
Std-
DR
(4)
9.7% 11.2%
Direct Standardization
Indirect Standardization
(Standardized Mortality Ratios-SMR)
Indirect Standardization
• Select (or) Create standard rate
• The simple way is to choose one of them
• Then apply ASDR of selected population
(i.e., standard death rate) to the other
population
• It means that we want to see what deaths
would be if the other population had the
same rate (ASDR)
• Then estimate SMR & compare to 100
6/26/2017 21
Observed no. of deaths per year
• SMR= x100
Expected no. of deaths per year
• SMR is calculated by totaling the Observed number of
deaths and dividing it by the expected number of
deaths
22
• SMR =100 (observed same as expected)
• SMR <100 (Observed less than expected)
• SMR ˃100 (Observed more than expected)
• Multiplication by 100 is done to yield results
without decimals
6/26/2017 23
Used when..
• No. of deaths from each age specific
stratum are not available
• Studying mortality in an occupationally
exposed population
6/26/2017 24
Example of Indirect Age Adjustment
Age-gp Village A Village B
# Pop # Deaths ASDR # Pop # Deaths ASDR
0-4 500 100 20% 200 100 50%
5-14 1000 150 15% 800 150 19%
15-59 5000 400 8% 5000 400 8%
60+ 500 50 10% 1000 50 5%
Total 7000 700 7000 700
Age-gp Village A Village B
# Pop # Deaths ASDR(1) # Pop # Deaths
(O)
ASDR
0-4 500 100 20% 200 100 50%
5-14 1000 150 15% 800 150 19%
15-59 5000 400 8% 5000 400 8%
60+ 500 50 10% 1000 50 5%
Total 7000 700 7000 700
Age-gp Village A Village B
# Pop # Deaths ASDR(1) # Pop Observed
Deaths(2)
Expected
Deaths(3)
0-4 500 100 20% 200 100
5-14 1000 150 15% 800 150
15-59 5000 400 8% 5000 400
60+ 500 50 10% 1000 50
Total 7000 700 7000 700
Age-gp Village A Town-B
# Pop # Deaths ASDR(1) # Pop Observed
Deaths(2)
Expected
Deaths(3)
0-4 500 100 20% 200 100 40
5-14 1000 150 15% 800 150 120
15-59 5000 400 8% 5000 400 400
60+ 500 50 10% 1000 50 100
Total 7000 700 7000 700 660
Age-gp Village A Village B
# Pop # Deaths ASDR(1) # Pop Observed
Deaths(2)
Expected
Deaths(3)
0-4 500 100 20% 200 100 40
5-14 1000 150 15% 800 150 120
15-59 5000 400 8% 5000 400 400
60+ 500 50 10% 1000 50 100
Total 7000 700 7000 700 660
SMR(4) (O/E)*100 106
Summary
• Not a real
• Just to control the effect of unequal
distribution in comparison
• It means that “to control confounding factor”
6/26/2017 31
THANK YOU!!
6/26/2017 32

Standardization dr.wah

  • 1.
    STANDARDIZATION Dr. Win AyeHlaing Lecturer Department of Epidemiology University of Public Health, Yangon 6/26/2017 1
  • 2.
    Comparing mortality indifferent populations • Mortality rates for white and black residents of Baltimore in 1965 • Any comments? 2 Race Mortality per 1000 pop: White 14.3 Black 10.2
  • 3.
    Death rates byage and race, Baltimore City, 1965 • overall mortality (also called crude or unadjusted mortality) is higher in whites than in blacks • each age-specific group, mortality is higher in blacks than in whites 3 Death rates by age per 1000 pop: Race All ages <1 1-4 5-17 18-44 45-64 >65 White 14.3 23.9 0.7 0.4 2.5 15.2 69.3 BLack 10.2 31.3 1.6 0.6 4.8 22.6 75.9
  • 4.
    Different Rates • Crude •Specific • Standardized 6/26/2017 4
  • 5.
    Crude Death Rate & AgeSpecific Death Rate 6/26/2017 5
  • 6.
    Deaths in TownA & B Age-group Town-A Town-B # Pop # Deaths # Pop # Deaths 0-4 500 100 200 100 5-14 1000 150 800 150 15-59 5000 400 5000 400 60+ 500 50 1000 50 Total 7000 700 7000 700 6/26/2017 6
  • 7.
    Deaths in TownA & B Age-group Town-A Town-B # Pop # Deaths # Pop # Deaths 0-4 500 100 200 100 5-14 1000 150 800 150 15-59 5000 400 5000 400 60+ 500 50 1000 50 Total 7000 700 7000 700 CDR 10% 10% 6/26/2017 7
  • 8.
    Deaths in TownA & B Age-group Town-A Town-B # Pop # Deaths ASDR # Pop # Deaths ASDR 0-4 500 100 20% 200 100 50% 5-14 1000 150 15% 800 150 19% 15-59 5000 400 8% 5000 400 8% 60+ 500 50 10% 1000 50 5% Total 7000 700 7000 700 CDR 10% 10% 6/26/2017 8
  • 9.
    • Approaches fordealing this problem – Direct Age adjustment – Indirect Age adjustment (Standardized Mortality Ratios) 9
  • 10.
  • 11.
  • 12.
    • A standardpopulation is used to eliminate effects of difference in age between populations • A hypothetical “standard” population is created • The simple way is to combine these populations • Then, apply both the age-specific mortality rates (ASDR) of each population to standard population 12
  • 13.
    • derive theexpected number of deaths in both early and late period • It means that we want to see what deaths would be if they were equal to standard population • Dividing each of these two total expected numbers of deaths by the total standard population, we can calculate an expected mortality rate in the standard population • These are called age-adjusted rates
  • 14.
    Age-group Town-A Town-B #Pop # Deaths # Pop # Deaths 0-4 500 100 200 100 5-14 1000 150 800 150 15-59 5000 400 5000 400 60+ 500 50 1000 50 Total 7000 700 7000 700 6/26/2017 14
  • 15.
    Age-group Town-A Town-B #Pop # Deaths STD-POP (1) # Pop # Deaths 0-4 500 100 700 200 100 5-14 1000 150 1800 800 150 15-59 5000 400 10000 5000 400 60+ 500 50 1500 1000 50 Total 7000 700 14000 7000 700 6/26/2017 15
  • 16.
    Age-group Town-A Town-B ASDR(2) Expected Deaths STD-POP ASDR (2) Expected Deaths 0-4 20% 700 50% 5-14 15% 1800 19% 15-59 8% 10000 8% 60+ 10% 1500 5% Total 14000 6/26/2017 16
  • 17.
    Age-group Town-A Town-B ASDRExpected Deaths (3) STD-POP ASDR Expected Deaths (3) 0-4 20% 140 700 50% 350 5-14 15% 270 1800 19% 342 15-59 8% 800 10000 8% 800 60+ 10% 150 1500 5% 75 Total 1360 14000 1567 6/26/2017 17
  • 18.
    Age-group Town-A Town-B ASDRExpected Deaths STD-POP ASDR Expected Deaths 0-4 20% 140 700 50% 350 5-14 15% 270 1800 19% 342 15-59 8% 800 10000 8% 800 60+ 10% 150 1500 5% 75 Total 1360 14000 1567 Std-DR (4) 9.7% 11.2% 6/26/2017 18
  • 19.
    6/26/2017 19 Age- gp Village A Village B Pop DeathsASD R(2) Expected Deaths(3) STD- POP(1) Pop Deaths Expected Deaths(3) ASD R (2) 0-4 500 100 20% 140 700 200 100 350 50% 5-14 1000 150 15% 270 1800 800 150 342 19% 15-59 5000 400 8% 800 10000 5000 400 800 8% 60+ 500 50 10% 150 1500 1000 50 75 5% Total 7000 700 1360 14000 7000 700 1567 Std- DR (4) 9.7% 11.2% Direct Standardization
  • 20.
  • 21.
    Indirect Standardization • Select(or) Create standard rate • The simple way is to choose one of them • Then apply ASDR of selected population (i.e., standard death rate) to the other population • It means that we want to see what deaths would be if the other population had the same rate (ASDR) • Then estimate SMR & compare to 100 6/26/2017 21
  • 22.
    Observed no. ofdeaths per year • SMR= x100 Expected no. of deaths per year • SMR is calculated by totaling the Observed number of deaths and dividing it by the expected number of deaths 22
  • 23.
    • SMR =100(observed same as expected) • SMR <100 (Observed less than expected) • SMR ˃100 (Observed more than expected) • Multiplication by 100 is done to yield results without decimals 6/26/2017 23
  • 24.
    Used when.. • No.of deaths from each age specific stratum are not available • Studying mortality in an occupationally exposed population 6/26/2017 24
  • 25.
    Example of IndirectAge Adjustment
  • 26.
    Age-gp Village AVillage B # Pop # Deaths ASDR # Pop # Deaths ASDR 0-4 500 100 20% 200 100 50% 5-14 1000 150 15% 800 150 19% 15-59 5000 400 8% 5000 400 8% 60+ 500 50 10% 1000 50 5% Total 7000 700 7000 700
  • 27.
    Age-gp Village AVillage B # Pop # Deaths ASDR(1) # Pop # Deaths (O) ASDR 0-4 500 100 20% 200 100 50% 5-14 1000 150 15% 800 150 19% 15-59 5000 400 8% 5000 400 8% 60+ 500 50 10% 1000 50 5% Total 7000 700 7000 700
  • 28.
    Age-gp Village AVillage B # Pop # Deaths ASDR(1) # Pop Observed Deaths(2) Expected Deaths(3) 0-4 500 100 20% 200 100 5-14 1000 150 15% 800 150 15-59 5000 400 8% 5000 400 60+ 500 50 10% 1000 50 Total 7000 700 7000 700
  • 29.
    Age-gp Village ATown-B # Pop # Deaths ASDR(1) # Pop Observed Deaths(2) Expected Deaths(3) 0-4 500 100 20% 200 100 40 5-14 1000 150 15% 800 150 120 15-59 5000 400 8% 5000 400 400 60+ 500 50 10% 1000 50 100 Total 7000 700 7000 700 660
  • 30.
    Age-gp Village AVillage B # Pop # Deaths ASDR(1) # Pop Observed Deaths(2) Expected Deaths(3) 0-4 500 100 20% 200 100 40 5-14 1000 150 15% 800 150 120 15-59 5000 400 8% 5000 400 400 60+ 500 50 10% 1000 50 100 Total 7000 700 7000 700 660 SMR(4) (O/E)*100 106
  • 31.
    Summary • Not areal • Just to control the effect of unequal distribution in comparison • It means that “to control confounding factor” 6/26/2017 31
  • 32.