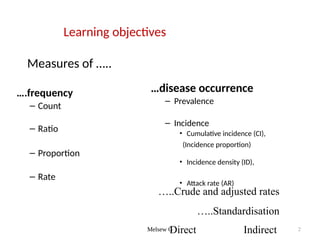
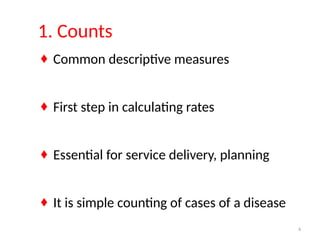
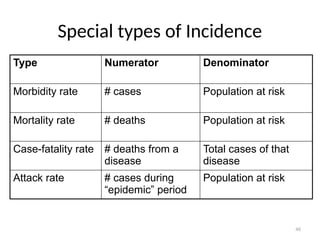
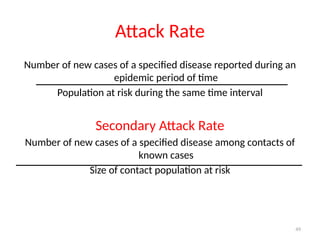
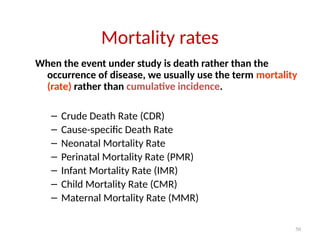
Melsew G
Ass. Professor
Basic measurements in epidemiology
Melsew G 2
Learning objectives
Measures of …..
….frequency
– Count
– Ratio
– Proportion
– Rate
…disease occurrence
– Prevalence
– Incidence
• Cumulative incidence (CI),
(Incidence proportion)
• Incidence density (ID),
• Attack rate (AR)
…..Crude and adjusted rates
…..Standardisation
Direct Indirect
3
Count
Ratios
 Proportions
 Rates
1. Measures of frequency
4
1. Counts
♦ Common descriptive measures
♦ First step in calculating rates
♦ Essential for service delivery, planning
♦ It is simple counting of cases of a disease
5
Simple count
6
2. Ratio
• A ratio is the relative size of two
quantities
• It quantifies the magnitude of
occurrence of something in
relation to another.
• One character divided by another
• no specific relationship between
the numerator and denominator
• Example: sex ratio
7
• No specific relationship is necessary between the
numerator and denominator
(numerator NOT necessarily included in the
denominator)
 Either the numerator or denominator is set to 1.
n:y or n/n: y/n or 1 to y/n
Cont….
8
Example
• # beds per doctor
– 120 beds/10
doctors
– 120/10 : 10/10
– 12 beds for a doctor
• # students per facilitator
• # inhabitants per latrine
• Sex ratio:
– Male / Female
• Odds ratio
• Rate ratio
• Maternal mortality rate
9
3. Proportion
 It is comparison of a part to the whole
population
 Numerator MUST BE INCLUDED in the
denominator
 Its result ranges between 0 and 1 or
(0–100%)
 Percentage = Proportion x 100
10
Population
3500 women
6500 men
Proportion of men
= 6500 / (3500 + 6500) = 0.65 or 65 %
Male to female ratio
= 6500 / 6500 = 1.00 to3500/6500 = 0.54
Example
1 male for 0.54 females
11
4. Rate
• Rate: measures the occurrence of an
event in a population over time.
• It is similar to proportion
• But it also adds time dimension
Total number of menopausal women in
2000
Cervical cancer cases in menopausal women in 2000
12
Cont….
2
----- = 0.02 / year
100
Observed in 2006
Total population in 2006
• Rate may be expressed in any power of 10
(100
, 101
, 102
, 103
, 10n
)
• 100, 1,000, 10,000, 100,000
13
Exercise (True/ False)
• All proportions are rates!
• All rates are proportions!
• All ratios are proportions!
• All rates are ratios too!
• All proportions are ratios!
14
2. Measures of disease occurence
Two types of measures :
1. Prevalence
Which measures a population’s disease status
(two forms)
1. Point Prevalence 2. Period prevalence
2. Incidence
Assesses frequency of disease onset
(two forms)
2. Cumulative incidence/ incidence proportion
3. Incidence density or incidence rate
15
1. Prevalence
Number of cases of a disease at a specific time
Mid-year population at the specified time
• It is proportion of a population affected by a disease
at a given time.
• It is expressed as a percentage, per thousand, per
hundred thousand
HIV/AIDS in X city in 2019:
Population 210,000
Cases 3,200
Prevalence 1.5%
16
1. Point Prevalence
• It is proportion of a population that is affected by
disease at a given point in time
• The amount of disease in a population usually changes
constantly
• Thus, may not be useful for assessment of diseases with
short generation period
17
2. Period prevalence
• If we want to know how much disease is present
over a longer period of time, period prevalence
would be preferred.
Number of cases of a disease at a specific time
Mid-year population at the specified time
total population
at starting
Mid-year population =
total population
at the end
2
+
18
t1
t2
Example
A total of 100 people were at risk of disease x, which has no life time
immunity.
What is the prevalence of disease X during time t1?
trends in incidence of thyroid cancer in children in Belarus, Ukraine, and
Russia from 1986 to 1994, obtained from surveillance data following an
explosion in the Chernobyl reactor.
t1
t2
Example
A total of 100 peope were at risk of disease x, which has no life time immunity.
What is the prevalence of disease X during time between t1 and t2?
20
21
2. Incidence
• The number of new events of a disease in a
defined population at risk within a specified
period of time.
• Two forms,
1. Cumulative incidence
2. Incidence density
Number of NEW cases of disease during a specific period
Population at risk during such period
22
a. Cumulative Incidence
Risk
It assumes that the entire population is at risk and
is followed up for specified time of period
x
x
x
x disease onset
Month 0 Month12
CI = 3/12 per year
= 0.25 per year
23
b. Incidence density (rate)
o
t
O
b
s
e
r
v
e
d
f
o
r
t
h
e
F
u
l
l
T
i
m
e
P
e
r
i
o
d
,
Number of NEW cases of disease during a period
Total person-time of observation
Rate
Instantaneous concept of rate (= speed)
Denominator:
- the sum of each individual’s time at risk
(or time free of a disease) is counted
24
Incidence (density) rate
• Incidence rate must take into account
– Number of individuals who become ill in a
population
– Time periods experienced by member of the
population during follow up.
25
Person- time
• It is sum of length of time period passed free of
illness (at risk) by each individual member of study
• It accounts for the amount of exposure time of
members
• It is a good measure in a dynamic cohort
• Dynamic cohort is a cohort of people leaving and
entering a study at different time of period
27
Dynamic (open) cohort study
Birth In-migrants
Death Out-migrants
E. g. Butajira Rural Health Program
28
A
B
C
D
E
90 91 92 93 94 95 96 97 98 99 00 Time at risk
x
x
6.0
6.0
10.0
8.5
5.0
Total years at risk 35.5
-- time followed
x disease onset
ID = 2 / 35.5 person- years
= 0.056 person-year
29
Comparing Incidence and Prevalence
Incidence
• New cases or events
over period of time
• Useful to study
factors causing
disease,
• Useful in “risk”
estimation
Prevalence
• All cases at
point/period of time
• Useful for measuring
size of problem
• For planning
30
Incidence
Deaths,
Cure,
Lost to follow up
Relationship between Incidence,
Prevalence and Disease Duration
Prevalence
Increased By
By longer duration of the
disease
Prolongation of life of patients
without cure
Increase in new cases (increase
in incidence)
In-migration of cases
Out-migration of healthy people
In-migration of susceptible
people
Improved diagnostic facilities
(better reporting)
Decreased By
Shorter duration of the
disease
High case fatality
Decrease in new cases
(decrease in incidence)
In-migration of health people
Out-migration of cases
Out-migration of susceptible
people
Improved cure rate of cases)
Factors influencing
Prevalence
32
Standardization
Melsew G
33
Learning Objectives
When you have completed this session, you will be
able to:
♦ Explain the difference between
– Crude and Adjusted rates
– Direct and Indirect Standardization
♦ State why and how standardized rates are used
♦ Calculate a direct and indirect standardized rate
34
Crude, specific & standardized (adjusted) rates
• Crude rates
– total population (e.g. crude birth rate)
– Summary measure
• Specific rates
– population subgroups (e.g. age-group specific death
rate)
• Standardized rates
– Rates after adjusting for a specific grouping
(age, sex, etc.)
35
Crude rates
• Summary rates
• Based on numbers of events
– e.g. births, deaths
♦ Crude death rate is influenced by:-
– Individual probability of dying
– Population age distribution
36
Specific rates
• Uses
– Detailed understanding of disease occurrence in
different population subsets.
– It could show detailed rates of specific group
(Age, sex, ethnicity)
• Disadvantages
– Difficult to compute/ interprate
37
Standardized (adjusted) rates
• Crude rates
– Comparison is suitable only when populations are
similar in all respects
• Adjustment or standardization
– Produces summary rates adjusted (controlled) for
(age, sex, etc) difference
– Standardization makes the population comparison
38
Standardization:
• The process by which you derive a summary figure to
compare health outcomes of groups
• The process can be used for mortality and morbidity
data
• Two methods
– Direct(SRR) -- Indirect (SMR)
39
1. Direct Adjustment of Rates
♦ It requires
1. a standard population to which the
estimated specific rates are applied
2. Specific rates of event for the study
population
40
Standard Population

1. US 1940 population
2. US 2000 population
3. European standard population
4. WHO world population
5. One of the study populations
6. Sum of the study populations
41
Examples
Standard Population formation
• Comparing the death rate among the 10
regional states in Ethiopia,
– The national population census of Ethiopia may be
used as a standard population
or
– It is also possible to use population of a single state
as a standard population
42
Direct Standardization
Geographic area Age group
15-44 45-64 65+ Total
AAA Population 10 20 70 100
Observed Cases 1 5 35 41
Prevalence 0.10 0.25 0.50 0.41
Adjusted 41/100 0.41
BBB Population 30 40 30 100
Observed Cases 5 18 18 41
Prevalence 0.17 0.45 0.60 0.41
Expected cases 0.17X10=1.7 .45X20=9 .60X70=42 53
Adjusted P 53/100 0.53
DDD Population 70 20 10 100
Observed Cases 21 12 8 41
Prevalence 0.30 0.60 0.80 0.41
Expected case 0.30X10=3 0.60X20=12 0.80X70=56 71
Adjusted prevalence 71/100 0.71
opulation living in geographic area AAA is used as reference po
Stand
Specific
comp
43
Direct Method
Characteristics Geographic Area
AAA BBB DDD
Observed cases 41 41 41
Observed prevalence 0.41 0.41 0.41
Adjusted prevalence 0.41 0.53 0.71
SRR (%)
Standardized Rate Ratio
100 129 173
Comparisons are performed using the geographic area AAA
population as standard (reference) population.
Adjusted prevalence
Observed prevalence
SRR (%) = x 100
44
2. Indirect Standardization
Indirect method requires
• Age structure of the sample study population
• Total cases (death) in the sample population
• Age-specific event (death) rates for a standard
population
• Summary figure is a
STANDARDIZED MORTALITY RATIO (SMR)
Observed
Expected
SMR =
45
Indirect standardization
Geographic area Age group
15-44 45-64 65+ Total
AAA Population 10 20 70 100
Cases 41
Prevalence 0.10 0.25 0.50 0.41
BBB Population 30 40 30 100
Observed Cases 41
Expected Cases (0.10x30) + (0.25x40) + (0.50x30) 28
DDD Population 70 20 10 100
Cases 41
EC (0.10x70) + (0.25x20) + (0.50x10) 17
46
Indirect Method
Characteristics Exposure
Low Medium High
Observed cases 41 41 41
Observed prevalence 0.41 0.41 0.41
Expected cases 41 28 17
SMR (%)
Standardized Mortality Ratio
100 146 241
Comparisons are performed using the low exposure group
prevalence (rate) as standard.
Observed
Expected
SMR = x 100
47
SMR
• SMR = 100
– Rates are similar to the standard population
• SMR < 100
– Fewer deaths occurred than expected (rates are lower
than the standard)
• SMR > 100
– More deaths occurred than expected (rates are higher
than the standard)
48
Special types of Incidence
Type Numerator Denominator
Morbidity rate # cases Population at risk
Mortality rate # deaths Population at risk
Case-fatality rate # deaths from a
disease
Total cases of that
disease
Attack rate # cases during
“epidemic” period
Population at risk
49
Attack Rate
Number of new cases of a specified disease reported during an
epidemic period of time
Population at risk during the same time interval
Secondary Attack Rate
Number of new cases of a specified disease among contacts of
known cases
Size of contact population at risk
50
Mortality rates
When the event under study is death rather than the
occurrence of disease, we usually use the term mortality
(rate) rather than cumulative incidence.
– Crude Death Rate (CDR)
– Cause-specific Death Rate
– Neonatal Mortality Rate
– Perinatal Mortality Rate (PMR)
– Infant Mortality Rate (IMR)
– Child Mortality Rate (CMR)
– Maternal Mortality Rate (MMR)

Lecture 3 Basic measurements in epidemiology.pptx

  • 1.
    Melsew G Ass. Professor Basicmeasurements in epidemiology
  • 2.
    Melsew G 2 Learningobjectives Measures of ….. ….frequency – Count – Ratio – Proportion – Rate …disease occurrence – Prevalence – Incidence • Cumulative incidence (CI), (Incidence proportion) • Incidence density (ID), • Attack rate (AR) …..Crude and adjusted rates …..Standardisation Direct Indirect
  • 3.
  • 4.
    4 1. Counts ♦ Commondescriptive measures ♦ First step in calculating rates ♦ Essential for service delivery, planning ♦ It is simple counting of cases of a disease
  • 5.
  • 6.
    6 2. Ratio • Aratio is the relative size of two quantities • It quantifies the magnitude of occurrence of something in relation to another. • One character divided by another • no specific relationship between the numerator and denominator • Example: sex ratio
  • 7.
    7 • No specificrelationship is necessary between the numerator and denominator (numerator NOT necessarily included in the denominator)  Either the numerator or denominator is set to 1. n:y or n/n: y/n or 1 to y/n Cont….
  • 8.
    8 Example • # bedsper doctor – 120 beds/10 doctors – 120/10 : 10/10 – 12 beds for a doctor • # students per facilitator • # inhabitants per latrine • Sex ratio: – Male / Female • Odds ratio • Rate ratio • Maternal mortality rate
  • 9.
    9 3. Proportion  Itis comparison of a part to the whole population  Numerator MUST BE INCLUDED in the denominator  Its result ranges between 0 and 1 or (0–100%)  Percentage = Proportion x 100
  • 10.
    10 Population 3500 women 6500 men Proportionof men = 6500 / (3500 + 6500) = 0.65 or 65 % Male to female ratio = 6500 / 6500 = 1.00 to3500/6500 = 0.54 Example 1 male for 0.54 females
  • 11.
    11 4. Rate • Rate:measures the occurrence of an event in a population over time. • It is similar to proportion • But it also adds time dimension Total number of menopausal women in 2000 Cervical cancer cases in menopausal women in 2000
  • 12.
    12 Cont…. 2 ----- = 0.02/ year 100 Observed in 2006 Total population in 2006 • Rate may be expressed in any power of 10 (100 , 101 , 102 , 103 , 10n ) • 100, 1,000, 10,000, 100,000
  • 13.
    13 Exercise (True/ False) •All proportions are rates! • All rates are proportions! • All ratios are proportions! • All rates are ratios too! • All proportions are ratios!
  • 14.
    14 2. Measures ofdisease occurence Two types of measures : 1. Prevalence Which measures a population’s disease status (two forms) 1. Point Prevalence 2. Period prevalence 2. Incidence Assesses frequency of disease onset (two forms) 2. Cumulative incidence/ incidence proportion 3. Incidence density or incidence rate
  • 15.
    15 1. Prevalence Number ofcases of a disease at a specific time Mid-year population at the specified time • It is proportion of a population affected by a disease at a given time. • It is expressed as a percentage, per thousand, per hundred thousand HIV/AIDS in X city in 2019: Population 210,000 Cases 3,200 Prevalence 1.5%
  • 16.
    16 1. Point Prevalence •It is proportion of a population that is affected by disease at a given point in time • The amount of disease in a population usually changes constantly • Thus, may not be useful for assessment of diseases with short generation period
  • 17.
    17 2. Period prevalence •If we want to know how much disease is present over a longer period of time, period prevalence would be preferred. Number of cases of a disease at a specific time Mid-year population at the specified time total population at starting Mid-year population = total population at the end 2 +
  • 18.
    18 t1 t2 Example A total of100 people were at risk of disease x, which has no life time immunity. What is the prevalence of disease X during time t1?
  • 19.
    trends in incidenceof thyroid cancer in children in Belarus, Ukraine, and Russia from 1986 to 1994, obtained from surveillance data following an explosion in the Chernobyl reactor.
  • 20.
    t1 t2 Example A total of100 peope were at risk of disease x, which has no life time immunity. What is the prevalence of disease X during time between t1 and t2? 20
  • 21.
    21 2. Incidence • Thenumber of new events of a disease in a defined population at risk within a specified period of time. • Two forms, 1. Cumulative incidence 2. Incidence density Number of NEW cases of disease during a specific period Population at risk during such period
  • 22.
    22 a. Cumulative Incidence Risk Itassumes that the entire population is at risk and is followed up for specified time of period x x x x disease onset Month 0 Month12 CI = 3/12 per year = 0.25 per year
  • 23.
    23 b. Incidence density(rate) o t O b s e r v e d f o r t h e F u l l T i m e P e r i o d , Number of NEW cases of disease during a period Total person-time of observation Rate Instantaneous concept of rate (= speed) Denominator: - the sum of each individual’s time at risk (or time free of a disease) is counted
  • 24.
    24 Incidence (density) rate •Incidence rate must take into account – Number of individuals who become ill in a population – Time periods experienced by member of the population during follow up.
  • 25.
    25 Person- time • Itis sum of length of time period passed free of illness (at risk) by each individual member of study • It accounts for the amount of exposure time of members • It is a good measure in a dynamic cohort • Dynamic cohort is a cohort of people leaving and entering a study at different time of period
  • 27.
    27 Dynamic (open) cohortstudy Birth In-migrants Death Out-migrants E. g. Butajira Rural Health Program
  • 28.
    28 A B C D E 90 91 9293 94 95 96 97 98 99 00 Time at risk x x 6.0 6.0 10.0 8.5 5.0 Total years at risk 35.5 -- time followed x disease onset ID = 2 / 35.5 person- years = 0.056 person-year
  • 29.
    29 Comparing Incidence andPrevalence Incidence • New cases or events over period of time • Useful to study factors causing disease, • Useful in “risk” estimation Prevalence • All cases at point/period of time • Useful for measuring size of problem • For planning
  • 30.
    30 Incidence Deaths, Cure, Lost to followup Relationship between Incidence, Prevalence and Disease Duration Prevalence
  • 31.
    Increased By By longerduration of the disease Prolongation of life of patients without cure Increase in new cases (increase in incidence) In-migration of cases Out-migration of healthy people In-migration of susceptible people Improved diagnostic facilities (better reporting) Decreased By Shorter duration of the disease High case fatality Decrease in new cases (decrease in incidence) In-migration of health people Out-migration of cases Out-migration of susceptible people Improved cure rate of cases) Factors influencing Prevalence
  • 32.
  • 33.
    33 Learning Objectives When youhave completed this session, you will be able to: ♦ Explain the difference between – Crude and Adjusted rates – Direct and Indirect Standardization ♦ State why and how standardized rates are used ♦ Calculate a direct and indirect standardized rate
  • 34.
    34 Crude, specific &standardized (adjusted) rates • Crude rates – total population (e.g. crude birth rate) – Summary measure • Specific rates – population subgroups (e.g. age-group specific death rate) • Standardized rates – Rates after adjusting for a specific grouping (age, sex, etc.)
  • 35.
    35 Crude rates • Summaryrates • Based on numbers of events – e.g. births, deaths ♦ Crude death rate is influenced by:- – Individual probability of dying – Population age distribution
  • 36.
    36 Specific rates • Uses –Detailed understanding of disease occurrence in different population subsets. – It could show detailed rates of specific group (Age, sex, ethnicity) • Disadvantages – Difficult to compute/ interprate
  • 37.
    37 Standardized (adjusted) rates •Crude rates – Comparison is suitable only when populations are similar in all respects • Adjustment or standardization – Produces summary rates adjusted (controlled) for (age, sex, etc) difference – Standardization makes the population comparison
  • 38.
    38 Standardization: • The processby which you derive a summary figure to compare health outcomes of groups • The process can be used for mortality and morbidity data • Two methods – Direct(SRR) -- Indirect (SMR)
  • 39.
    39 1. Direct Adjustmentof Rates ♦ It requires 1. a standard population to which the estimated specific rates are applied 2. Specific rates of event for the study population
  • 40.
    40 Standard Population  1. US1940 population 2. US 2000 population 3. European standard population 4. WHO world population 5. One of the study populations 6. Sum of the study populations
  • 41.
    41 Examples Standard Population formation •Comparing the death rate among the 10 regional states in Ethiopia, – The national population census of Ethiopia may be used as a standard population or – It is also possible to use population of a single state as a standard population
  • 42.
    42 Direct Standardization Geographic areaAge group 15-44 45-64 65+ Total AAA Population 10 20 70 100 Observed Cases 1 5 35 41 Prevalence 0.10 0.25 0.50 0.41 Adjusted 41/100 0.41 BBB Population 30 40 30 100 Observed Cases 5 18 18 41 Prevalence 0.17 0.45 0.60 0.41 Expected cases 0.17X10=1.7 .45X20=9 .60X70=42 53 Adjusted P 53/100 0.53 DDD Population 70 20 10 100 Observed Cases 21 12 8 41 Prevalence 0.30 0.60 0.80 0.41 Expected case 0.30X10=3 0.60X20=12 0.80X70=56 71 Adjusted prevalence 71/100 0.71 opulation living in geographic area AAA is used as reference po Stand Specific comp
  • 43.
    43 Direct Method Characteristics GeographicArea AAA BBB DDD Observed cases 41 41 41 Observed prevalence 0.41 0.41 0.41 Adjusted prevalence 0.41 0.53 0.71 SRR (%) Standardized Rate Ratio 100 129 173 Comparisons are performed using the geographic area AAA population as standard (reference) population. Adjusted prevalence Observed prevalence SRR (%) = x 100
  • 44.
    44 2. Indirect Standardization Indirectmethod requires • Age structure of the sample study population • Total cases (death) in the sample population • Age-specific event (death) rates for a standard population • Summary figure is a STANDARDIZED MORTALITY RATIO (SMR) Observed Expected SMR =
  • 45.
    45 Indirect standardization Geographic areaAge group 15-44 45-64 65+ Total AAA Population 10 20 70 100 Cases 41 Prevalence 0.10 0.25 0.50 0.41 BBB Population 30 40 30 100 Observed Cases 41 Expected Cases (0.10x30) + (0.25x40) + (0.50x30) 28 DDD Population 70 20 10 100 Cases 41 EC (0.10x70) + (0.25x20) + (0.50x10) 17
  • 46.
    46 Indirect Method Characteristics Exposure LowMedium High Observed cases 41 41 41 Observed prevalence 0.41 0.41 0.41 Expected cases 41 28 17 SMR (%) Standardized Mortality Ratio 100 146 241 Comparisons are performed using the low exposure group prevalence (rate) as standard. Observed Expected SMR = x 100
  • 47.
    47 SMR • SMR =100 – Rates are similar to the standard population • SMR < 100 – Fewer deaths occurred than expected (rates are lower than the standard) • SMR > 100 – More deaths occurred than expected (rates are higher than the standard)
  • 48.
    48 Special types ofIncidence Type Numerator Denominator Morbidity rate # cases Population at risk Mortality rate # deaths Population at risk Case-fatality rate # deaths from a disease Total cases of that disease Attack rate # cases during “epidemic” period Population at risk
  • 49.
    49 Attack Rate Number ofnew cases of a specified disease reported during an epidemic period of time Population at risk during the same time interval Secondary Attack Rate Number of new cases of a specified disease among contacts of known cases Size of contact population at risk
  • 50.
    50 Mortality rates When theevent under study is death rather than the occurrence of disease, we usually use the term mortality (rate) rather than cumulative incidence. – Crude Death Rate (CDR) – Cause-specific Death Rate – Neonatal Mortality Rate – Perinatal Mortality Rate (PMR) – Infant Mortality Rate (IMR) – Child Mortality Rate (CMR) – Maternal Mortality Rate (MMR)

Editor's Notes

  • #3 While frequencies are useful in many ways, care should be taken in interpreting them. Therefore, the key in epidemiology is relating the frequency (the numerator) to an appropriate population (the denominator). This is done by computing ratios, proportions and rates.
  • #6 A ratio is the relative size of two quantities, calculated by dividing one quantity into another in which there is no specific relationship between the numerator and denominator. The two quantities could be related or totally independent.
  • #9 A proportion is one number divided by another number in which those who are included in the numerator must also be included in the denominator. A proportion ranges from 0-1, but this measure can also be expressed as a percentage ranging from 0-100%.
  • #16 The amount of disease in a population is constantly changing. For a stop action look at a single point in time you can use point prevalence. If you want to know how much disease is present over a longer period of time can use period prevalence.
  • #17 The amount of disease in a population is constantly changing. For a stop action look at a single point in time you can use point prevalence. If you want to know how much disease is present over a longer period of time can use period prevalence.
  • #18 The amount of disease in a population is constantly changing. For a stop action look at a single point in time you can use point prevalence. If you want to know how much disease is present over a longer period of time can use period prevalence.
  • #20 The amount of disease in a population is constantly changing. For a stop action look at a single point in time you can use point prevalence. If you want to know how much disease is present over a longer period of time can use period prevalence.
  • #22 Denominator= population at risk and observed for the entire period In this denominator, we specify a period of time, and we must know that all of the individuals in the group represented by the denominator have been followed up for that entire period.
  • #23 The denominator consists of the sum of the units of time that each individual was at risk and was observed (person time), could be person months or person years
  • #25 Person time=units of time when each person is observed). Let us consider person-years (py): One person at risk who is observed for one year = one person-year. One person at risk observed for 5 years = 5 personyears (py). But 5 people at risk, each of whom is observed for only 1 year, also = 5 person-years.
  • #26 When all the people in the population being studied are observed for the entire period: Person-years (py) of observation.
  • #30  Let us discuss the relationship between prevalence and incidence, and the differences between the two measures. This barrel of water illustrates the relationship. The level of water in the barrel represents the prevalence of, say, Disinfected persons. This level is a function of the rate at which new infections pour into the barrel, representing incidence, as well as the rate at which water leaves the barrel, representing losses to the population due to mortality or moving out of the community. If no deaths occurred, then the water level, representing the prevalence, would increase over time at the rate of the entry of the incoming water representing new infections. On the other hand, if there were no new cases and water stopped entering the barrel (or new cases of HIV stopped occurring), prevalence would decline as water left the beaker. If the inflow and outflow to the barrel are balanced, even if at very high levels, then a stable level of water would occur. In such a situation, a stable prevalence rate could mask a very high incidence rate. Since epidemiologists and public health officials are concerned about preventing new infections, incidence is generally a better measure to use to monitor how rapidly a disease is spreading. The problem with incidence, of course, is that it requires one to follow cohorts of specific individuals through time to measure new onset of disease. In most cases this is very expensive and not practical.
  • #33 Examples of verbs to use are: Explain Describe Calculate Analyze Prepare Design
  • #37 An important use of mortality data is to compare two or more populations, or one population in different time periods. Such populations may differ in regard to many characteristics that affect mortality, of which age distribution is the most important. In fact, age is the single most important predictor of mortality.
  • #38 It is the process of effectively holding constant characteristics such as age.
  • #40 Choice is somewhat arbitrary since not interested in the absolute value of the adjusted rates interested in the comparison
  • #48 With both incidence and prevalence, the numerators and denominators can be altered to give specialized types of measures suitable for use in particular circumstances. Several specialized incidence rates that you will be hearing and using in epidemiology are morbidity rate, mortality rate, case-fatality rate, and attack rate.   The morbidity rate for a particular disease is the incidence of cases, that is, new cases of that disease, both non-fatal and fatal, in the population at risk during the specified period of time. In reporting morbidity rates, we often use the total population for the denominator, even if that is not really the precise population at risk. For example, we might say that the measles morbidity rate for 1993 in country X was 26 cases per 100,000 population. Technically, people who have already had measles are no longer at risk for it, but for convenience we still might use the total population in expressing a measles morbidity rate, since no one know the number of non-immune persons who might be the more specific "population at risk". The mortality rate for a disease is the incidence of deaths in a population at risk due to that disease during a certain time period, and it is calculated similarly to the morbidity rate. A total mortality rate would reflect all causes of deaths. The population at risk is often the total population, but not always. For example, the mortality rate for prostate cancer and for breast cancer are often expressed with denominators of the populations of either men or women, respectively, since these diseases only occur in one sex or the other.   The case-fatality rate is a measure of how deadly a disease is. It is calculated from the number of deaths from a disease divided by all cases of that disease. It is really a ratio so you can also refer to the death to case ration.   Another type of incidence rate used frequently in epidemic investigations is the attack rate. The attack rate is the cumulative incidence of a disease among a particular population at risk during a specific epidemic period. For example, if all 36 students in this class attend the course picnic, and 12 of you get sick with food poisoning