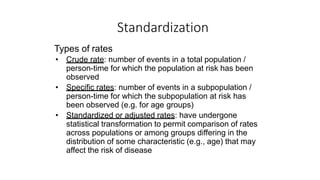
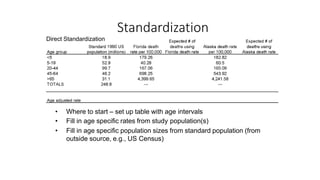
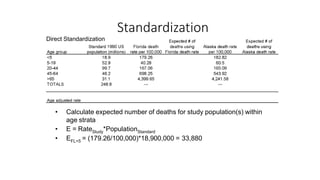
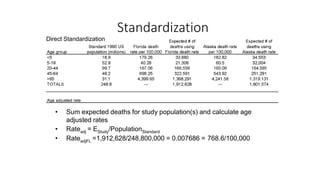
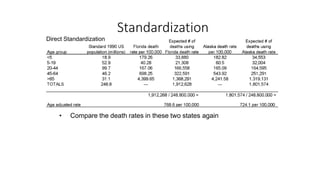
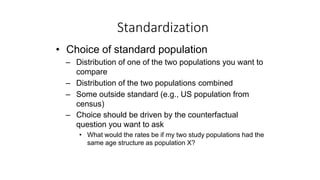
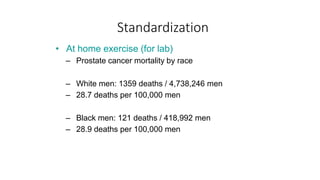
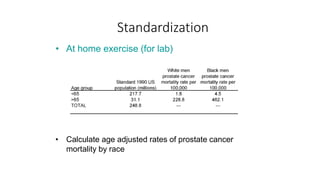
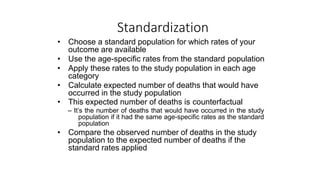
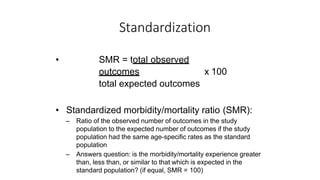
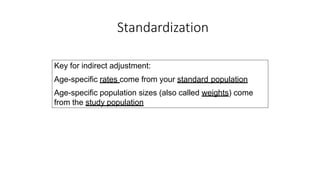
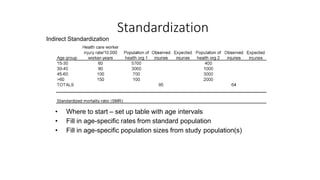
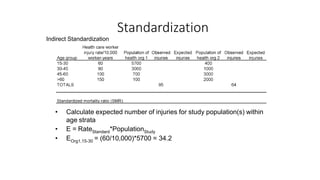
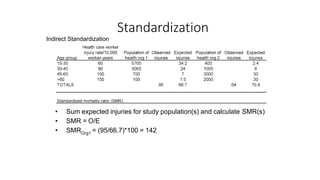
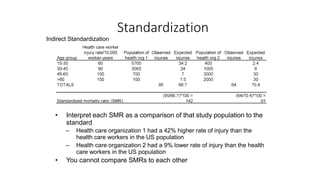
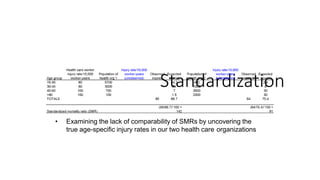
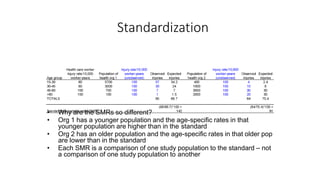
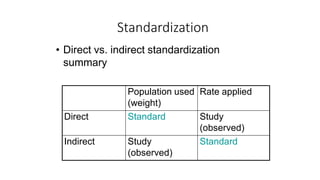
Types of rates
• Crude rate: number of events in a total population /
person-time for which the population at risk has been
observed
• Specific rates: number of events in a subpopulation /
person-time for which the subpopulation at risk has
been observed (e.g. for age groups)
• Standardized or adjusted rates: have undergone
statistical transformation to permit comparison of rates
across populations or among groups differing in the
distribution of some characteristic (e.g., age) that may
affect the risk of disease
Standardization
Comparing crude rates
• A crude rate represents the actual experience of the
population and is thus a valuable way to describe the
disease experience
• Comparing crude rates between two or more
populations can be misleading because populations
may differ with respect to characteristics that affect
morbidity and mortality
• What are some of the principal factors that influence
morbidity and mortality?
Standardization
• Consider age-specific rates…
• The crude rate can be thought of as a weighted average
of the age-specific rates
– the weights are the proportion of the population in
each age category
• Crude rate = ∑(age-specific rate x proportion of pop in
that age category)
• Even if two populations had identical age-specific rates,
the crude rates for the two populations would differ if the
age structure of the two populations were different
Standardization
• Population 1:
– 500,000 people aged 20-24
– 500,000 people aged 25-29
• Population 2:
– 200,000 people aged 20-24
– 800,000 people aged 25-29
• In both populations
– CI among 20-24 = 0.002
– CI among 25-29 = 0.009
• What are the crude “rates” in populations 1 & 2?
Standardization
• Crude rate = ∑(age-specific rate x proportion of pop in that age
category)
• Population 1, crude CI = 0.002*0.5 + 0.009*0.5 = 0.0055
• Population 2, crude CI = 0.002*0.2 + 0.009*0.8 = 0.0076
• What do you think about comparing the health experience of these
two populations using their CI values?
Population 1 Population 2
Age rate proportion rate proportion
20-24 0.002 0.5 0.002 0.2
25-29 0.009 0.5 0.009 0.8
Standardization
• Standardization of rates allows direct
comparison of rates between populations
– A standardized rate is a summary rate that has been
adjusted to account for the differences in the
distribution of characteristics that affect disease (e.g.,
age) between populations
– Standardized rates allow fair comparisons to be
made between populations
– Answers the question: what would the death rate be
in each population, if they had identical distributions
of {X}? e.g. age
– Counterfactual idea
Standardization
• Compare the death rates in these two states
• Concerns about direct comparison of these crude rates?
– Age structures of the populations of these two states are quite
different
Standardization
Direct standardization
• Choose a standard population (e.g., 1990 or 2000 US
population from US Census)
• Use the actual age-specific rates from each study
population (e.g., state)
• Apply these rates to the standard population in each
age category
• Calculate the number of outcomes that would have
been observed in the study population if it had the age
distribution of the standard population – a counterfactual
idea
• Calculate the adjusted rate of the outcome
Standardization
• Age adjusted rate = total expected outcomes
total standard population
Standardization
Key for direct adjustment:
Age specific rates come from your study population
Age specific population sizes (i.e, the weights) come from
the standard population
• Where to start – set up table with age intervals
• Fill in age specific rates from study population(s)
• Fill in age specific population sizes from standard population (from
outside source, e.g., US Census)
Standardization
Direct Standardization
• Calculate expected number of deaths for study population(s) within
age strata
• E = RateStudy*PopulationStandard
• EFL<5 = (179.26/100,000)*18,900,000 = 33,880
Standardization
Direct Standardization
• Sum expected deaths for study population(s) and calculate age
adjusted rates
• Rateadj = EStudy/PopulationStandard
• RateadjFL =1,912,628/248,800,000 = 0.007686 = 768.6/100,000
Standardization
Direct Standardization
Standardization
• Compare the death rates in these two states again
Direct Standardization
• Choice of standard population
– Distribution of one of the two populations you want to
compare
– Distribution of the two populations combined
– Some outside standard (e.g., US population from
census)
– Choice should be driven by the counterfactual
question you want to ask
• What would the rates be if my two study populations had the
same age structure as population X?
Standardization
• Beware: the values you calculate will depend on
the standard population chosen
– Can get different results from different standards if
the standards have notably different age structures
• Note that the actual value of the new adjusted
rate is a product of the choice of a standard
population – it is not a “real” rate
Standardization
Pros:
• Directly standardized rates can be used to compare
disease rates across areas and time
Cons:
• Requires age-specific rates that are not often available
at a local level or in certain populations
• Rates may not be stable for small number of events
(approximately <100 events)
Standardization
Standardization
• At home exercise (for lab)
– Prostate cancer mortality by race
– White men: 1359 deaths / 4,738,246 men
– 28.7 deaths per 100,000 men
– Black men: 121 deaths / 418,992 men
– 28.9 deaths per 100,000 men
Standardization
• At home exercise (for lab)
• Calculate age adjusted rates of prostate cancer
mortality by race
• There may be situations in which age-specific rates are
not available for your study population
– Common in occupational studies – number of cases available
from records but unable to reconstruct rates
• You still want to be able to make a comparison between
the disease experience of your study population and
another population accounting for differences in the
distribution of characteristics (e.g., age)
• If you know the age structure of your study population,
indirect standardization is an option
Standardization
• Choose a standard population for which rates of your
outcome are available
• Use the age-specific rates from the standard population
• Apply these rates to the study population in each age
category
• Calculate expected number of deaths that would have
occurred in the study population
• This expected number of deaths is counterfactual
– It’s the number of deaths that would have occurred in the study
population if it had the same age-specific rates as the standard
population
• Compare the observed number of deaths in the study
population to the expected number of deaths if the
standard rates applied
Standardization
Standardization
• SMR = total observed
outcomes x 100
total expected outcomes
• Standardized morbidity/mortality ratio (SMR):
– Ratio of the observed number of outcomes in the study
population to the expected number of outcomes if the study
population had the same age-specific rates as the standard
population
– Answers question: is the morbidity/mortality experience greater
than, less than, or similar to that which is expected in the
standard population? (if equal, SMR = 100)
• Direct vs. indirect standardization
summary
Population used
(weight)
Rate applied
Direct Standard Study
(observed)
Indirect Study
(observed)
Standard
Standardization
Key for indirect adjustment:
Age-specific rates come from your standard population
Age-specific population sizes (also called weights) come
from the study population
Standardization
• Example: we have data from two health care
organizations on the numbers of occupational injuries
reported
– Health care organization 1: 95
– Health care organization 2: 64
• We are wondering how these health care organizations
compare to the US average for those working in health
care regarding injuries
Standardization
• Where to start – set up table with age intervals
• Fill in age-specific rates from standard population
• Fill in age-specific population sizes from study population(s)
Standardization
Indirect Standardization
• Calculate expected number of injuries for study population(s) within
age strata
• E = RateStandard*PopulationStudy
• EOrg1,15-30 = (60/10,000)*5700 = 34.2
Standardization
Indirect Standardization
• Sum expected injuries for study population(s) and calculate SMR(s)
• SMR = O/E
• SMROrg1 = (95/66.7)*100 = 142
Standardization
Indirect Standardization
• Interpret each SMR as a comparison of that study population to the
standard
– Health care organization 1 had a 42% higher rate of injury than the
health care workers in the US population
– Health care organization 2 had a 9% lower rate of injury than the health
care workers in the US population
• You cannot compare SMRs to each other
Standardization
Indirect Standardization
Pros:
• Indirect standardization does not require age-specific rates, only
total number of events in the study population and age structure of
the study population
Cons:
• SMRs cannot be directly compared
– Each SMR captures a counterfactual comparison within that
specific population
• E.g, Observed deaths from pop A/Expected deaths from pop A (if
standard rates applied)
– The two study populations may have different age structures
and the expected deaths depends on the age structure of each
study population
• Unlike directly standardized rates, SMRs give no idea of the actual
burden of disease
Standardization
Standardization
• Examining the lack of comparability of SMRs by uncovering the
true age-specific injury rates in our two health care organizations
Standardization
• Age-specific injury rates are IDENTICAL in the two health care
organizations
Standardization
• Why are the SMRs so different?
• Org 1 has a younger population and the age-specific rates in that
younger population are higher than in the standard
• Org 2 has an older population and the age-specific rates in that older pop
are lower than in the standard
• Each SMR is a comparison of one study population to the standard – not
a comparison of one study population to another
• Direct vs. indirect standardization
summary
Population used
(weight)
Rate applied
Direct Standard Study
(observed)
Indirect Study
(observed)
Standard
Standardization

1.6 standardization

  • 1.
    Types of rates •Crude rate: number of events in a total population / person-time for which the population at risk has been observed • Specific rates: number of events in a subpopulation / person-time for which the subpopulation at risk has been observed (e.g. for age groups) • Standardized or adjusted rates: have undergone statistical transformation to permit comparison of rates across populations or among groups differing in the distribution of some characteristic (e.g., age) that may affect the risk of disease Standardization
  • 2.
    Comparing crude rates •A crude rate represents the actual experience of the population and is thus a valuable way to describe the disease experience • Comparing crude rates between two or more populations can be misleading because populations may differ with respect to characteristics that affect morbidity and mortality • What are some of the principal factors that influence morbidity and mortality? Standardization
  • 3.
    • Consider age-specificrates… • The crude rate can be thought of as a weighted average of the age-specific rates – the weights are the proportion of the population in each age category • Crude rate = ∑(age-specific rate x proportion of pop in that age category) • Even if two populations had identical age-specific rates, the crude rates for the two populations would differ if the age structure of the two populations were different Standardization
  • 4.
    • Population 1: –500,000 people aged 20-24 – 500,000 people aged 25-29 • Population 2: – 200,000 people aged 20-24 – 800,000 people aged 25-29 • In both populations – CI among 20-24 = 0.002 – CI among 25-29 = 0.009 • What are the crude “rates” in populations 1 & 2? Standardization
  • 5.
    • Crude rate= ∑(age-specific rate x proportion of pop in that age category) • Population 1, crude CI = 0.002*0.5 + 0.009*0.5 = 0.0055 • Population 2, crude CI = 0.002*0.2 + 0.009*0.8 = 0.0076 • What do you think about comparing the health experience of these two populations using their CI values? Population 1 Population 2 Age rate proportion rate proportion 20-24 0.002 0.5 0.002 0.2 25-29 0.009 0.5 0.009 0.8 Standardization
  • 6.
    • Standardization ofrates allows direct comparison of rates between populations – A standardized rate is a summary rate that has been adjusted to account for the differences in the distribution of characteristics that affect disease (e.g., age) between populations – Standardized rates allow fair comparisons to be made between populations – Answers the question: what would the death rate be in each population, if they had identical distributions of {X}? e.g. age – Counterfactual idea Standardization
  • 7.
    • Compare thedeath rates in these two states • Concerns about direct comparison of these crude rates? – Age structures of the populations of these two states are quite different Standardization
  • 8.
    Direct standardization • Choosea standard population (e.g., 1990 or 2000 US population from US Census) • Use the actual age-specific rates from each study population (e.g., state) • Apply these rates to the standard population in each age category • Calculate the number of outcomes that would have been observed in the study population if it had the age distribution of the standard population – a counterfactual idea • Calculate the adjusted rate of the outcome Standardization
  • 9.
    • Age adjustedrate = total expected outcomes total standard population Standardization Key for direct adjustment: Age specific rates come from your study population Age specific population sizes (i.e, the weights) come from the standard population
  • 10.
    • Where tostart – set up table with age intervals • Fill in age specific rates from study population(s) • Fill in age specific population sizes from standard population (from outside source, e.g., US Census) Standardization Direct Standardization
  • 11.
    • Calculate expectednumber of deaths for study population(s) within age strata • E = RateStudy*PopulationStandard • EFL<5 = (179.26/100,000)*18,900,000 = 33,880 Standardization Direct Standardization
  • 12.
    • Sum expecteddeaths for study population(s) and calculate age adjusted rates • Rateadj = EStudy/PopulationStandard • RateadjFL =1,912,628/248,800,000 = 0.007686 = 768.6/100,000 Standardization Direct Standardization
  • 13.
    Standardization • Compare thedeath rates in these two states again Direct Standardization
  • 14.
    • Choice ofstandard population – Distribution of one of the two populations you want to compare – Distribution of the two populations combined – Some outside standard (e.g., US population from census) – Choice should be driven by the counterfactual question you want to ask • What would the rates be if my two study populations had the same age structure as population X? Standardization
  • 15.
    • Beware: thevalues you calculate will depend on the standard population chosen – Can get different results from different standards if the standards have notably different age structures • Note that the actual value of the new adjusted rate is a product of the choice of a standard population – it is not a “real” rate Standardization
  • 16.
    Pros: • Directly standardizedrates can be used to compare disease rates across areas and time Cons: • Requires age-specific rates that are not often available at a local level or in certain populations • Rates may not be stable for small number of events (approximately <100 events) Standardization
  • 17.
    Standardization • At homeexercise (for lab) – Prostate cancer mortality by race – White men: 1359 deaths / 4,738,246 men – 28.7 deaths per 100,000 men – Black men: 121 deaths / 418,992 men – 28.9 deaths per 100,000 men
  • 18.
    Standardization • At homeexercise (for lab) • Calculate age adjusted rates of prostate cancer mortality by race
  • 19.
    • There maybe situations in which age-specific rates are not available for your study population – Common in occupational studies – number of cases available from records but unable to reconstruct rates • You still want to be able to make a comparison between the disease experience of your study population and another population accounting for differences in the distribution of characteristics (e.g., age) • If you know the age structure of your study population, indirect standardization is an option Standardization
  • 20.
    • Choose astandard population for which rates of your outcome are available • Use the age-specific rates from the standard population • Apply these rates to the study population in each age category • Calculate expected number of deaths that would have occurred in the study population • This expected number of deaths is counterfactual – It’s the number of deaths that would have occurred in the study population if it had the same age-specific rates as the standard population • Compare the observed number of deaths in the study population to the expected number of deaths if the standard rates applied Standardization
  • 21.
    Standardization • SMR =total observed outcomes x 100 total expected outcomes • Standardized morbidity/mortality ratio (SMR): – Ratio of the observed number of outcomes in the study population to the expected number of outcomes if the study population had the same age-specific rates as the standard population – Answers question: is the morbidity/mortality experience greater than, less than, or similar to that which is expected in the standard population? (if equal, SMR = 100)
  • 22.
    • Direct vs.indirect standardization summary Population used (weight) Rate applied Direct Standard Study (observed) Indirect Study (observed) Standard Standardization
  • 23.
    Key for indirectadjustment: Age-specific rates come from your standard population Age-specific population sizes (also called weights) come from the study population Standardization
  • 24.
    • Example: wehave data from two health care organizations on the numbers of occupational injuries reported – Health care organization 1: 95 – Health care organization 2: 64 • We are wondering how these health care organizations compare to the US average for those working in health care regarding injuries Standardization
  • 25.
    • Where tostart – set up table with age intervals • Fill in age-specific rates from standard population • Fill in age-specific population sizes from study population(s) Standardization Indirect Standardization
  • 26.
    • Calculate expectednumber of injuries for study population(s) within age strata • E = RateStandard*PopulationStudy • EOrg1,15-30 = (60/10,000)*5700 = 34.2 Standardization Indirect Standardization
  • 27.
    • Sum expectedinjuries for study population(s) and calculate SMR(s) • SMR = O/E • SMROrg1 = (95/66.7)*100 = 142 Standardization Indirect Standardization
  • 28.
    • Interpret eachSMR as a comparison of that study population to the standard – Health care organization 1 had a 42% higher rate of injury than the health care workers in the US population – Health care organization 2 had a 9% lower rate of injury than the health care workers in the US population • You cannot compare SMRs to each other Standardization Indirect Standardization
  • 29.
    Pros: • Indirect standardizationdoes not require age-specific rates, only total number of events in the study population and age structure of the study population Cons: • SMRs cannot be directly compared – Each SMR captures a counterfactual comparison within that specific population • E.g, Observed deaths from pop A/Expected deaths from pop A (if standard rates applied) – The two study populations may have different age structures and the expected deaths depends on the age structure of each study population • Unlike directly standardized rates, SMRs give no idea of the actual burden of disease Standardization
  • 30.
    Standardization • Examining thelack of comparability of SMRs by uncovering the true age-specific injury rates in our two health care organizations
  • 31.
    Standardization • Age-specific injuryrates are IDENTICAL in the two health care organizations
  • 32.
    Standardization • Why arethe SMRs so different? • Org 1 has a younger population and the age-specific rates in that younger population are higher than in the standard • Org 2 has an older population and the age-specific rates in that older pop are lower than in the standard • Each SMR is a comparison of one study population to the standard – not a comparison of one study population to another
  • 33.
    • Direct vs.indirect standardization summary Population used (weight) Rate applied Direct Standard Study (observed) Indirect Study (observed) Standard Standardization